| Param | Original file | Final file |
|---|---|---|
| Filename | modeM0/AS1T04_034T01_9000004632_31733cztM0_level2.evt | modeM0/AS1T04_034T01_9000004632_31733cztM0_level2_quad_clean.evt |
| Size (bytes) | 756,627,840 | 104,696,640 |
| Size | 721.6 MB | 99.8 MB |
| Events in quadrant A | 6,080,234 | 660,621 |
| Events in quadrant B | 6,392,907 | 683,762 |
| Events in quadrant C | 4,505,821 | 658,892 |
| Events in quadrant D | 5,434,767 | 651,082 |
| Mode M9 | |||
|---|---|---|---|
| Quadrant | BADHDUFLAG | Total packets | Discarded packets |
| A | 0 | 13 | 0 |
| B | 0 | 13 | 0 |
| C | 0 | 13 | 0 |
| D | 0 | 13 | 0 |
| Mode SS | |||
|---|---|---|---|
| Quadrant | BADHDUFLAG | Total packets | Discarded packets |
| A | 0 | 152 | 0 |
| B | 0 | 152 | 0 |
| C | 0 | 152 | 0 |
| D | 0 | 152 | 0 |
| Mode M0 | |||
|---|---|---|---|
| Quadrant | BADHDUFLAG | Total packets | Discarded packets |
| A | 0 | 23037 | 9 |
| B | 0 | 24448 | 2 |
| C | 0 | 18095 | 2 |
| D | 0 | 21202 | 2 |
| Quadrant | Total seconds | Saturated seconds | Saturation percentage |
|---|---|---|---|
| A | 7419 | 1043 | 14.058498% |
| B | 7419 | 418 | 5.634183% |
| C | 7419 | 409 | 5.512872% |
| D | 7419 | 274 | 3.693220% |
Noise dominated data is calculated using 1-second bins in cleaned event files. If a bin has >2000 counts, and if more than 50% of those come from <1% of pixels, then it is considered to be noise-dominated and hence unusable.
| Quadrant | # 1 sec bins | Bins with >0 counts | Bins with >2000 counts | High rate bins dominated by noise | Noise dominated (total time) | Noise dominated (detector-on time) | Marked lightcurve |
|---|---|---|---|---|---|---|---|
| A | 8704 | 7421 | 488 | 488 | 5.61% | 6.58% | 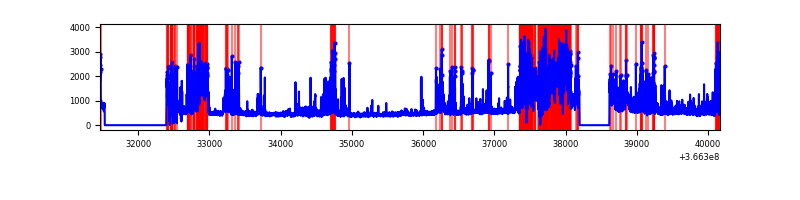 |
| B | 8704 | 7421 | 23 | 23 | 0.26% | 0.31% | 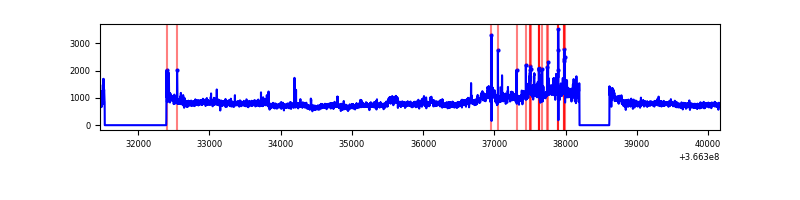 |
| C | 8704 | 7421 | 98 | 98 | 1.13% | 1.32% | 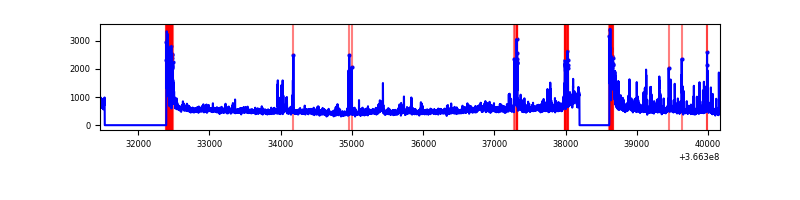 |
| D | 8704 | 7421 | 153 | 153 | 1.76% | 2.06% | 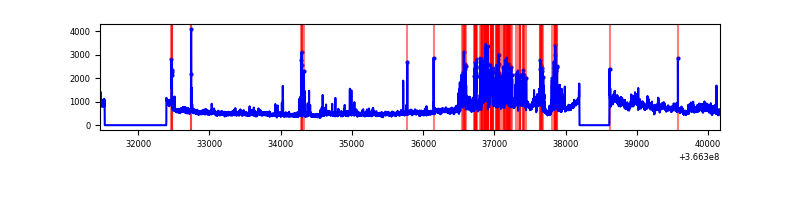 |
Top three noisy pixels from each quadrant. If the there are fewer than three noisy pixels in the level2.evt file, extra rows are filled as -1
| Pixel properties | Quadrant properties | ||||||
|---|---|---|---|---|---|---|---|
| Quadrant | DetID | PixID | Counts | Sigma | Mean | Median | Sigma |
| A | 0 | 13 | 2704402 | 15339.61 | 873 | 854 | 176.2 |
| A | 13 | 254 | 14199 | 75.72 | 873 | 854 | 176.2 |
| A | 3 | 137 | 8917 | 45.75 | 873 | 854 | 176.2 |
| B | 6 | 159 | 2042132 | 11417.22 | 922 | 897 | 178.8 |
| B | 4 | 80 | 568021 | 3172.09 | 922 | 897 | 178.8 |
| B | 5 | 172 | 38529 | 210.49 | 922 | 897 | 178.8 |
| C | 0 | 10 | 663312 | 3158.51 | 886 | 894 | 209.7 |
| C | 14 | 238 | 143196 | 678.52 | 886 | 894 | 209.7 |
| C | 10 | 22 | 138805 | 657.58 | 886 | 894 | 209.7 |
| D | 8 | 195 | 1186119 | 5508.62 | 904 | 882 | 215.2 |
| D | 12 | 233 | 792916 | 3681.13 | 904 | 882 | 215.2 |
| D | 2 | 234 | 31656 | 143.03 | 904 | 882 | 215.2 |
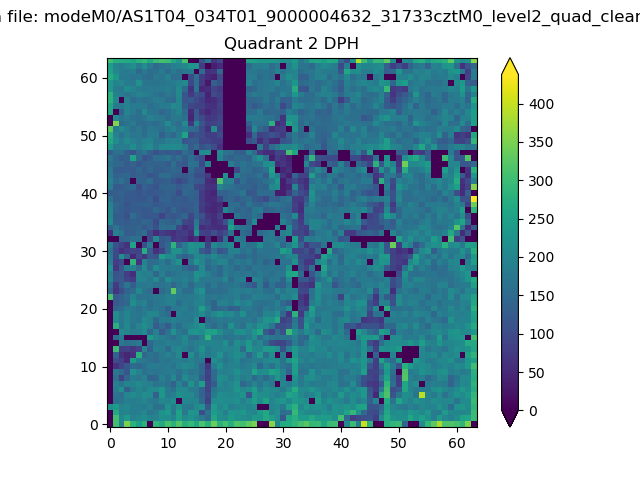
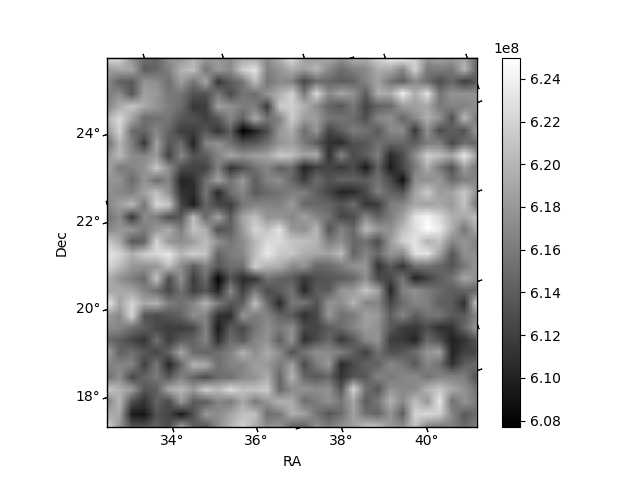
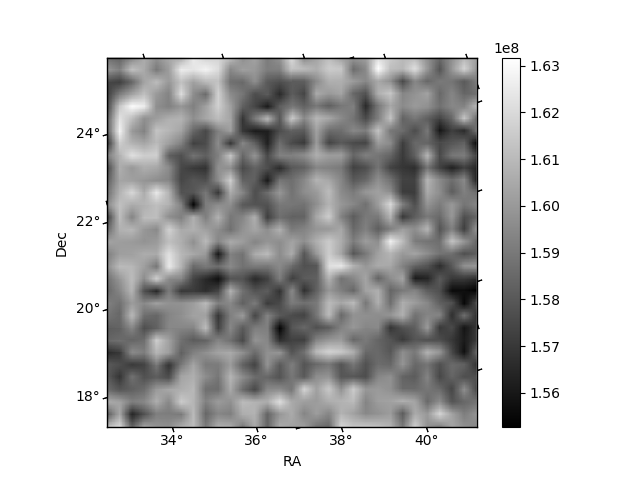
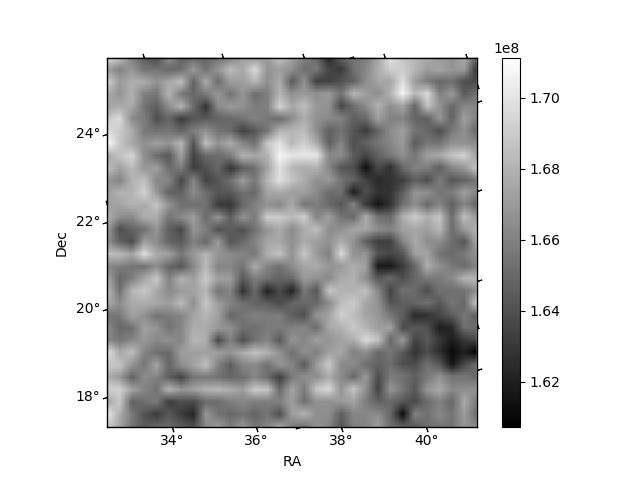
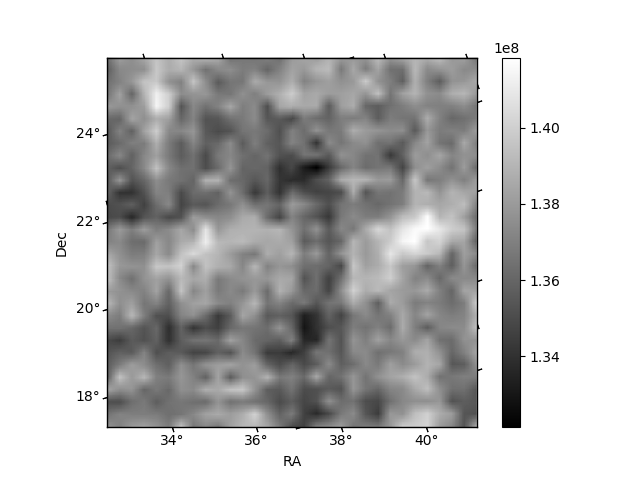
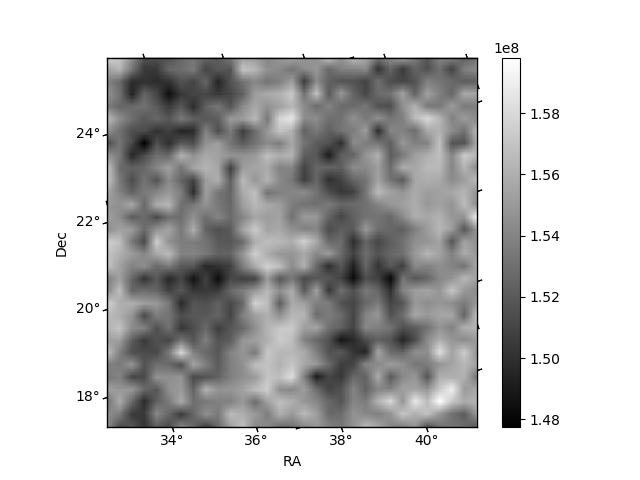
Histogram calculated using DETX and DETY for each event in the final _common_clean file
| Quadrant A | 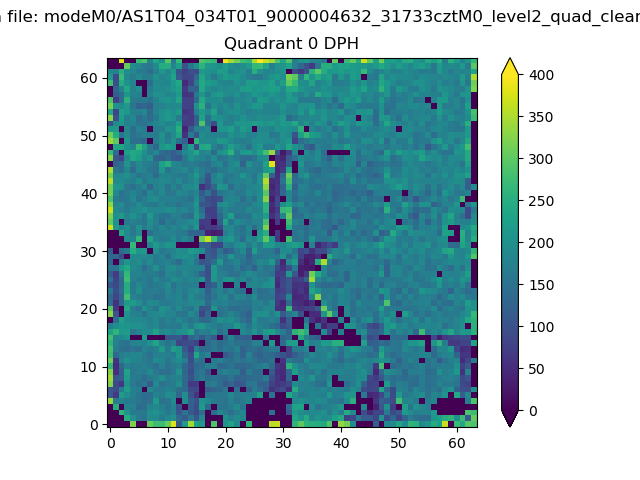 |
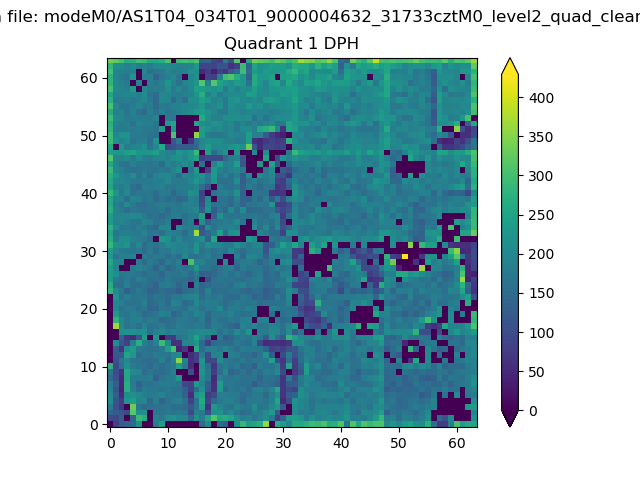 |
Quadrant B |
|---|---|---|---|
| Quadrant D | 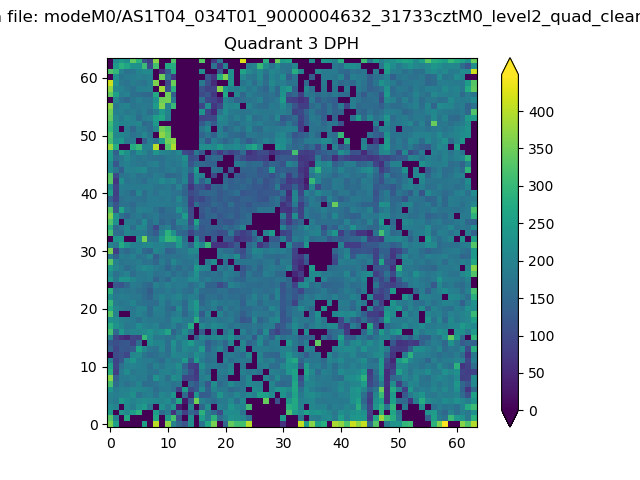 |
 |
Quadrant C |
| Plot type | Count rate plots | Images |
|---|---|---|
| Comparison with Poisson distribution Blue bars denote a histogram of data divided into 1 sec bins. Red curve is a Poisson curve with rate = median count rate of data. |
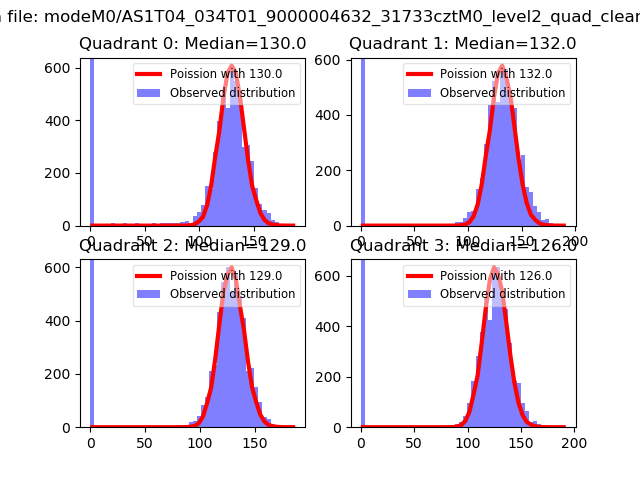 |
 |
| Quadrant-wise count rates Data is divided into 100 sec bins |
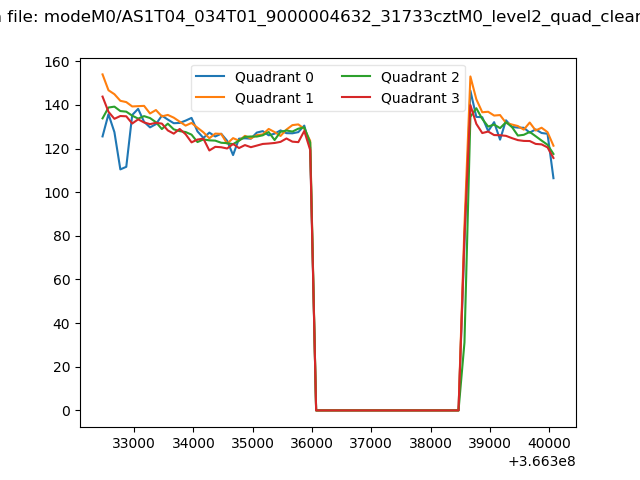 |
|
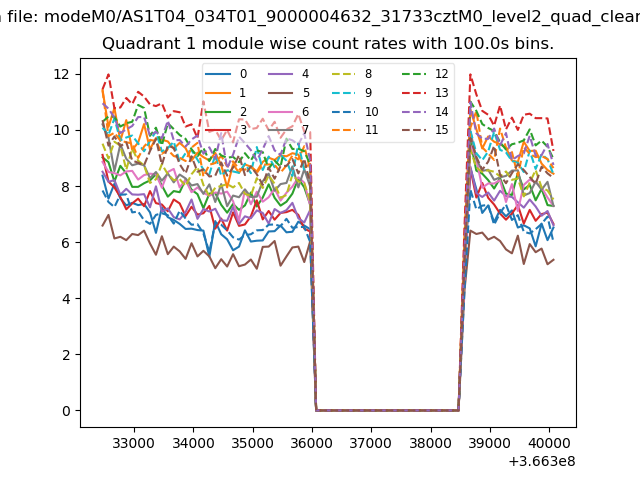
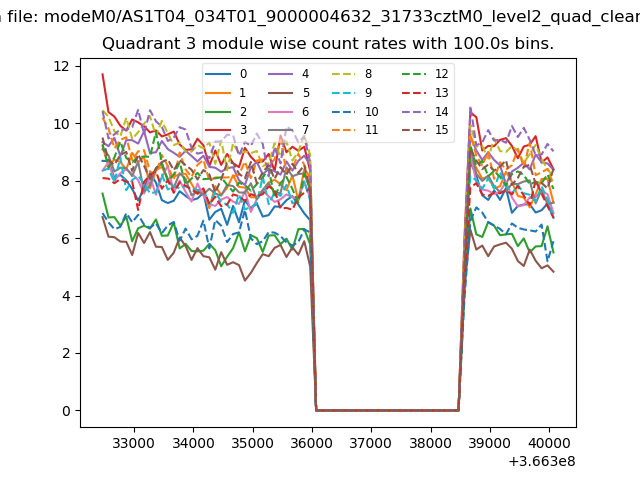
| Module-wise count rates for Quadrant A Data is divided into 100 sec bins |
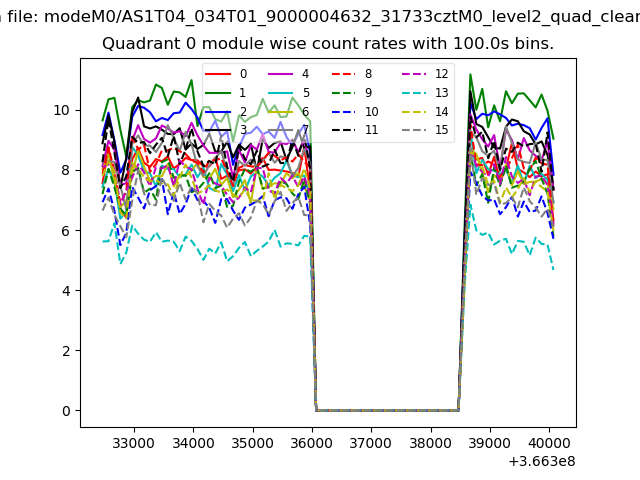 |
 |
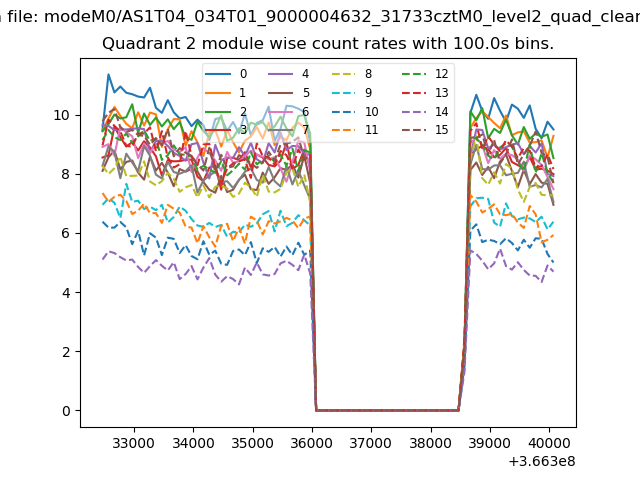
| Module-wise count rates for Quadrant B Data is divided into 100 sec bins |
 |
 |
| Module-wise count rates for Quadrant C Data is divided into 100 sec bins |
 |
 |
| Module-wise count rates for Quadrant D Data is divided into 100 sec bins |
 |
 |
| Parameter | Plot |
|---|---|
| CZT HV Monitor |  |
| D_VDD | 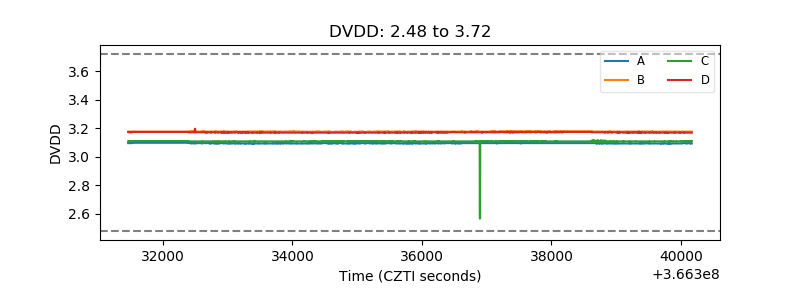 |
| Temperature 1 | 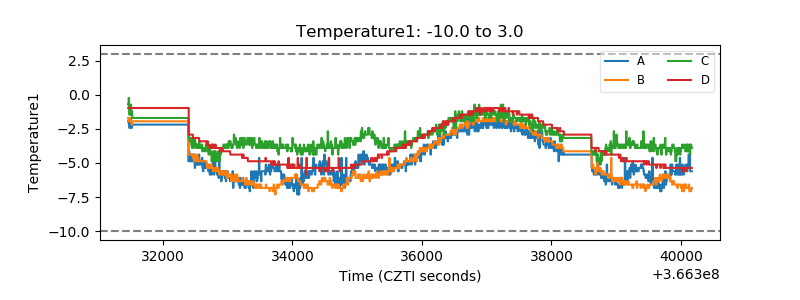 |
| Veto HV Monitor | 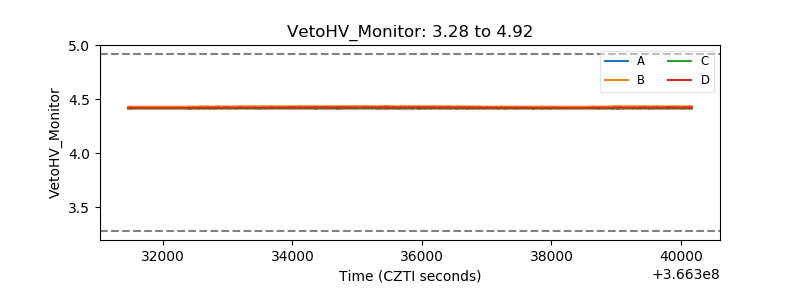 |
| Veto LLD | 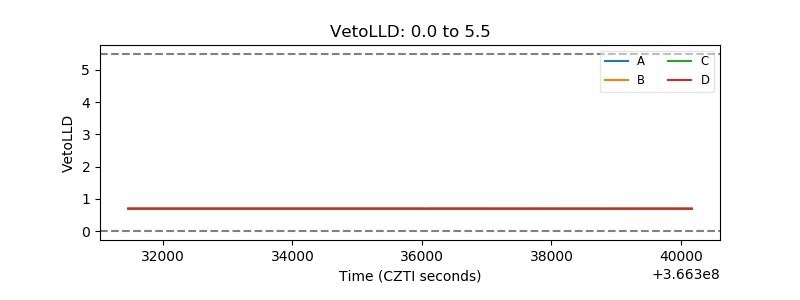 |
| Alpha Counter | 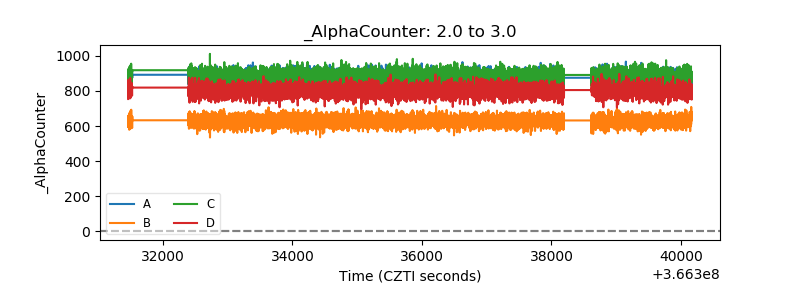 |
| _CPM_Rate | 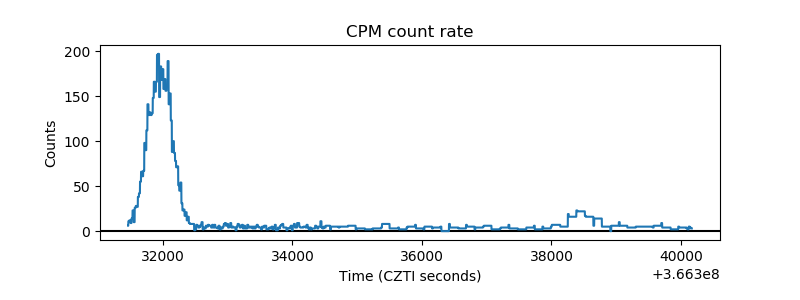 |
| CZT Counter | 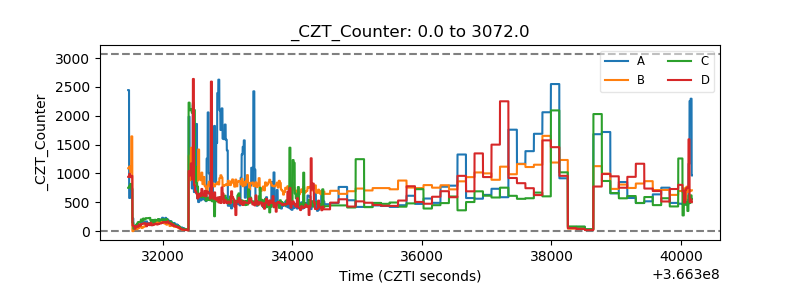 |
| +2.5 Volts monitor | 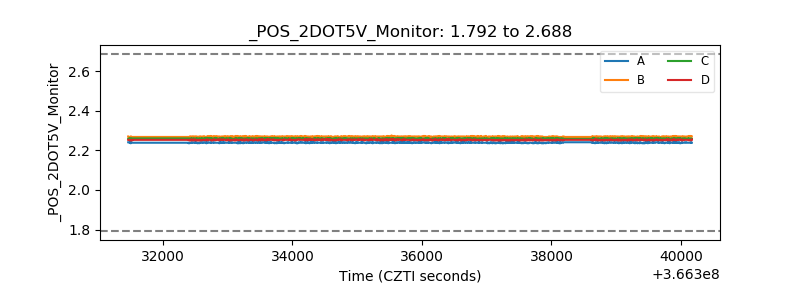 |
| +5 Volts monitor | 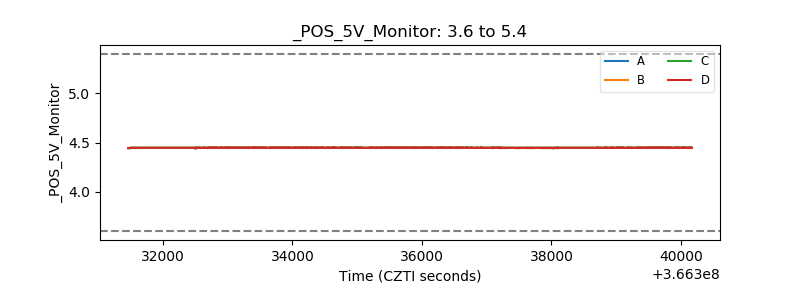 |
| _ROLL_ROT | 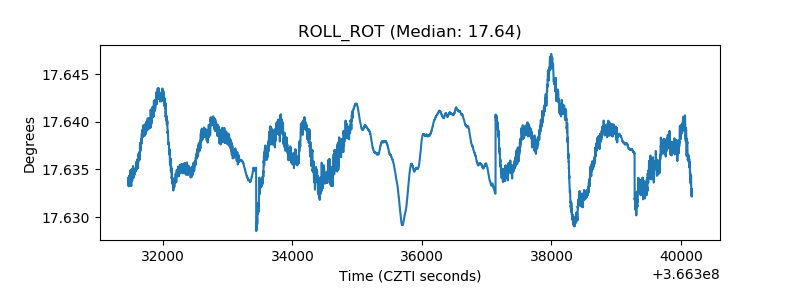 |
| _Roll_DEC | 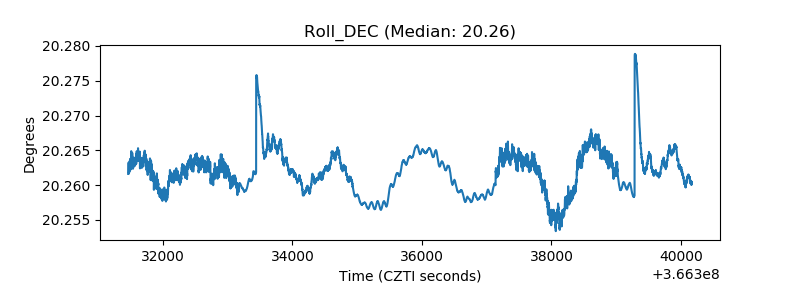 |
| _Roll_RA | 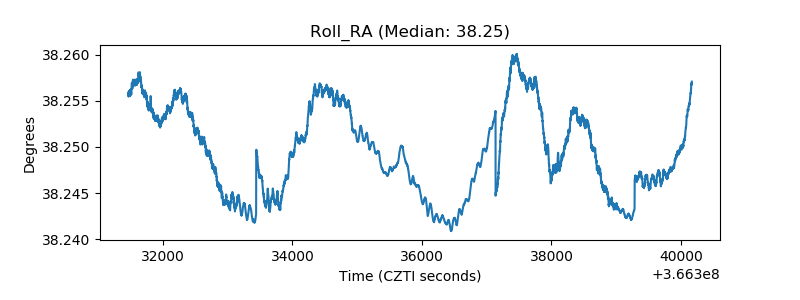 |
| Veto Counter | 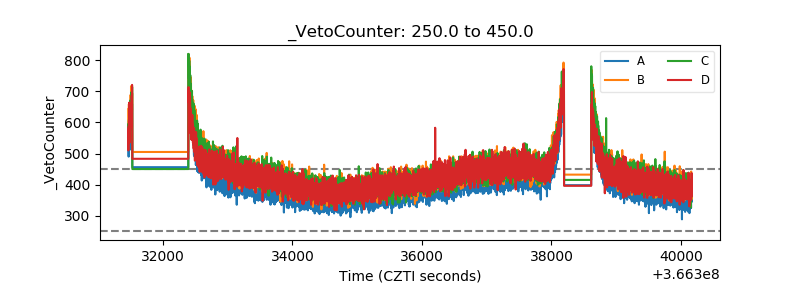 |