| Param | Original file | Final file |
|---|---|---|
| Filename | modeM0/AS1T04_034T01_9000004632_31734cztM0_level2.evt | modeM0/AS1T04_034T01_9000004632_31734cztM0_level2_quad_clean.evt |
| Size (bytes) | 758,116,800 | 112,927,680 |
| Size | 723.0 MB | 107.7 MB |
| Events in quadrant A | 6,058,327 | 710,218 |
| Events in quadrant B | 6,465,388 | 736,119 |
| Events in quadrant C | 4,721,843 | 714,855 |
| Events in quadrant D | 5,176,051 | 704,619 |
| Mode M9 | |||
|---|---|---|---|
| Quadrant | BADHDUFLAG | Total packets | Discarded packets |
| A | 0 | 4 | 0 |
| B | 0 | 4 | 0 |
| C | 0 | 4 | 0 |
| D | 0 | 4 | 0 |
| Mode SS | |||
|---|---|---|---|
| Quadrant | BADHDUFLAG | Total packets | Discarded packets |
| A | 0 | 162 | 0 |
| B | 0 | 162 | 0 |
| C | 0 | 162 | 0 |
| D | 0 | 162 | 0 |
| Mode M0 | |||
|---|---|---|---|
| Quadrant | BADHDUFLAG | Total packets | Discarded packets |
| A | 0 | 23276 | 1 |
| B | 0 | 25260 | 1 |
| C | 0 | 19166 | 1 |
| D | 0 | 20539 | 2 |
| Quadrant | Total seconds | Saturated seconds | Saturation percentage |
|---|---|---|---|
| A | 7965 | 653 | 8.198368% |
| B | 7965 | 464 | 5.825487% |
| C | 7966 | 366 | 4.594527% |
| D | 7965 | 155 | 1.946014% |
Noise dominated data is calculated using 1-second bins in cleaned event files. If a bin has >2000 counts, and if more than 50% of those come from <1% of pixels, then it is considered to be noise-dominated and hence unusable.
| Quadrant | # 1 sec bins | Bins with >0 counts | Bins with >2000 counts | High rate bins dominated by noise | Noise dominated (total time) | Noise dominated (detector-on time) | Marked lightcurve |
|---|---|---|---|---|---|---|---|
| A | 8385 | 7966 | 311 | 311 | 3.71% | 3.90% | 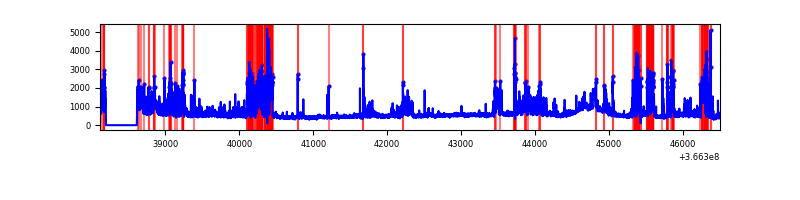 |
| B | 8385 | 7966 | 3 | 3 | 0.04% | 0.04% | 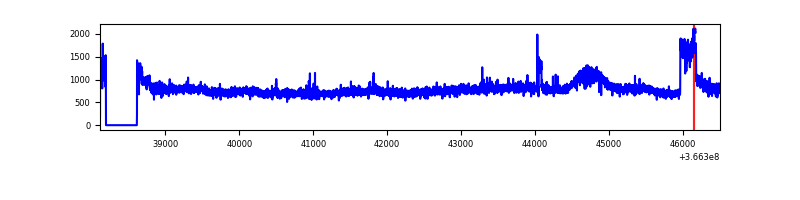 |
| C | 8386 | 7967 | 33 | 33 | 0.39% | 0.41% | 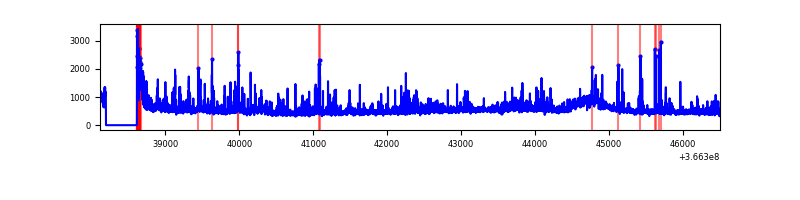 |
| D | 8385 | 7966 | 82 | 82 | 0.98% | 1.03% | 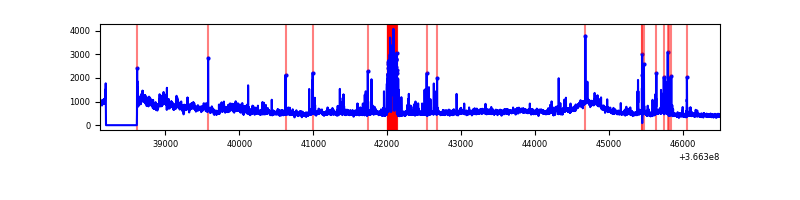 |
Top three noisy pixels from each quadrant. If the there are fewer than three noisy pixels in the level2.evt file, extra rows are filled as -1
| Pixel properties | Quadrant properties | ||||||
|---|---|---|---|---|---|---|---|
| Quadrant | DetID | PixID | Counts | Sigma | Mean | Median | Sigma |
| A | 0 | 13 | 2234102 | 11053.49 | 990 | 970 | 202.0 |
| A | 13 | 254 | 14583 | 67.38 | 990 | 970 | 202.0 |
| A | 3 | 137 | 10533 | 47.33 | 990 | 970 | 202.0 |
| B | 6 | 159 | 2163020 | 10956.49 | 1003 | 976 | 197.3 |
| B | 4 | 80 | 326702 | 1650.67 | 1003 | 976 | 197.3 |
| B | 12 | 111 | 24934 | 121.41 | 1003 | 976 | 197.3 |
| C | 0 | 10 | 716310 | 3096.99 | 970 | 977 | 231.0 |
| C | 14 | 238 | 155030 | 666.96 | 970 | 977 | 231.0 |
| C | 10 | 22 | 25253 | 105.1 | 970 | 977 | 231.0 |
| D | 8 | 195 | 975354 | 4107.47 | 985 | 959 | 237.2 |
| D | 12 | 233 | 427834 | 1799.45 | 985 | 959 | 237.2 |
| D | 2 | 250 | 43781 | 180.51 | 985 | 959 | 237.2 |
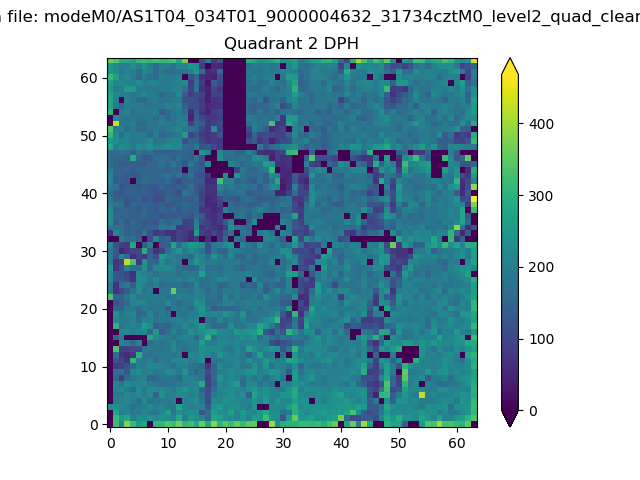
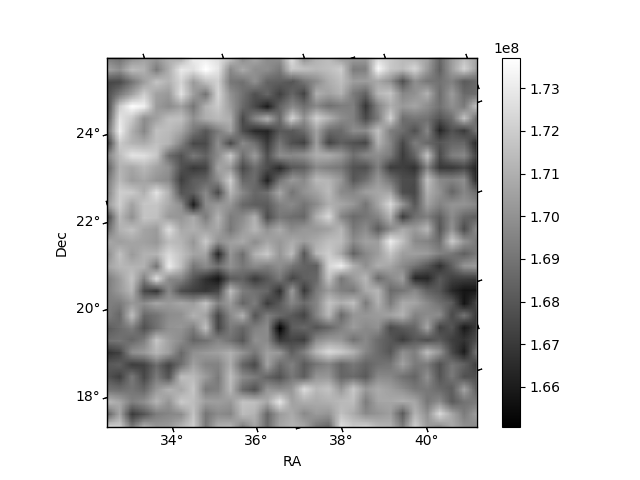
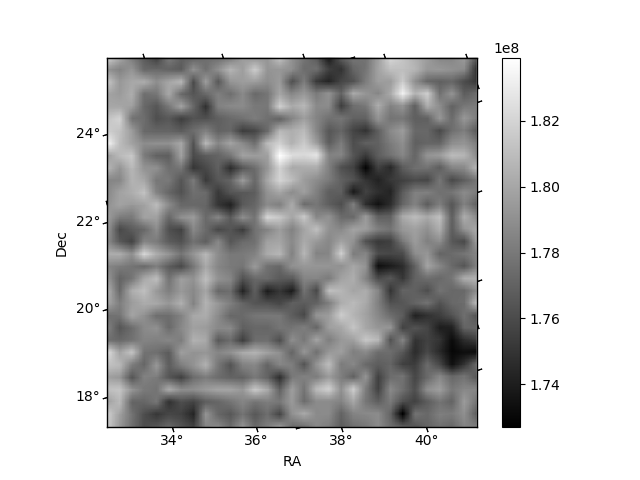
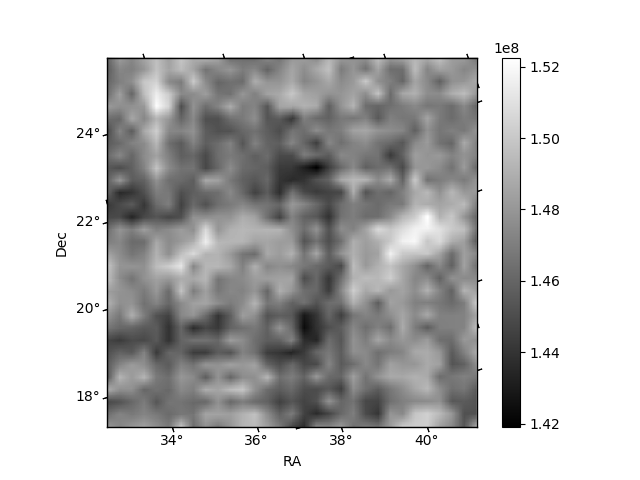
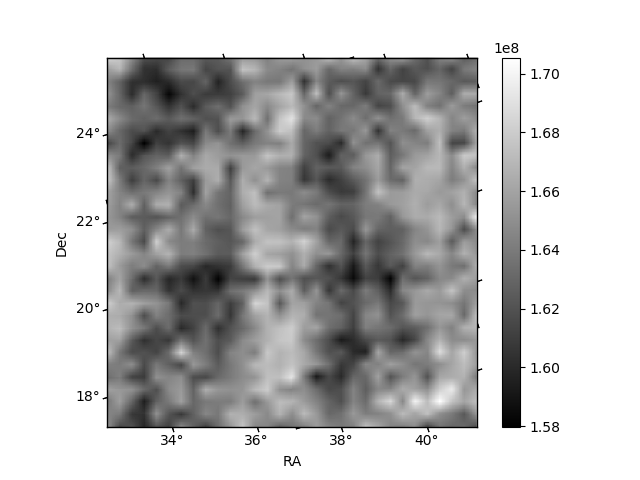
Histogram calculated using DETX and DETY for each event in the final _common_clean file
| Quadrant A | 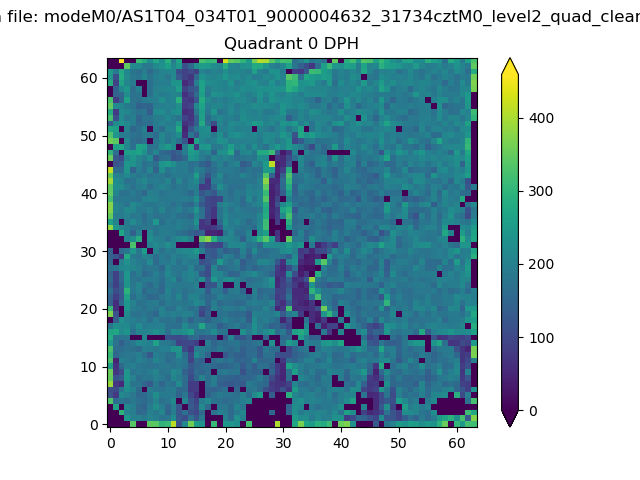 |
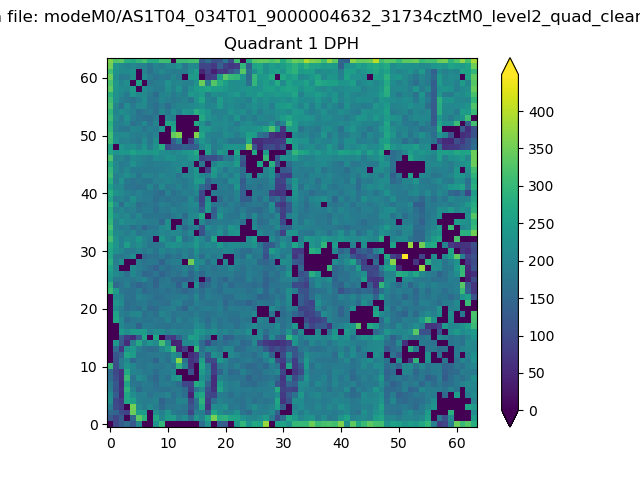 |
Quadrant B |
|---|---|---|---|
| Quadrant D | 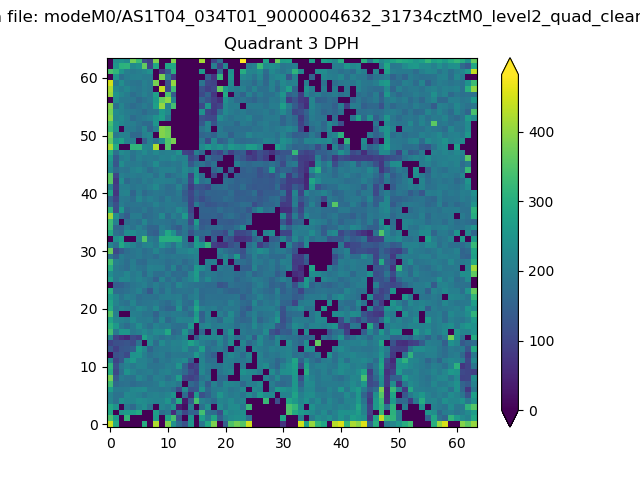 |
 |
Quadrant C |
| Plot type | Count rate plots | Images |
|---|---|---|
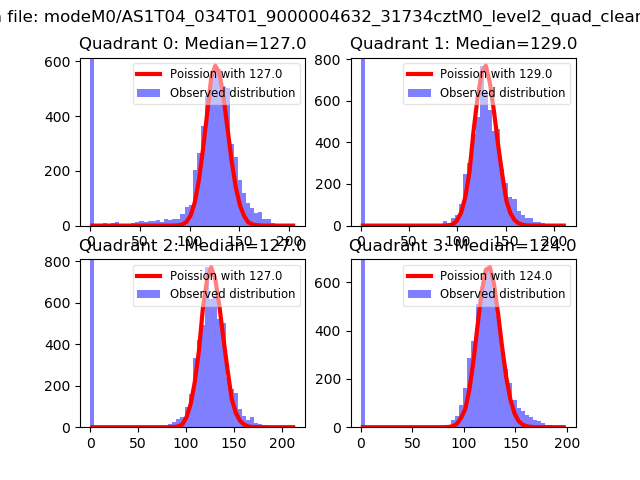
| Comparison with Poisson distribution Blue bars denote a histogram of data divided into 1 sec bins. Red curve is a Poisson curve with rate = median count rate of data. |
 |
 |
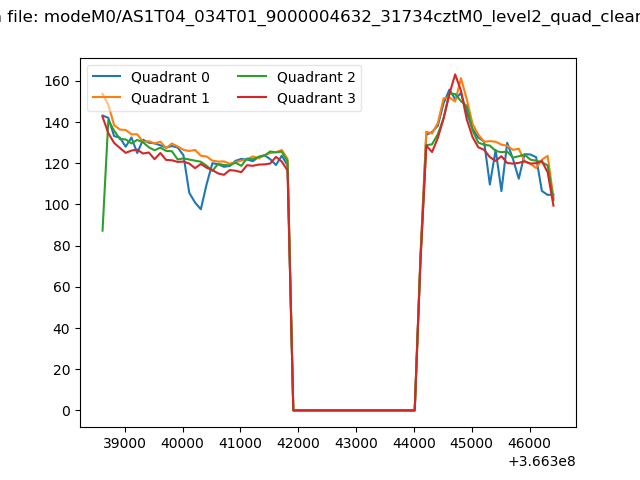
| Quadrant-wise count rates Data is divided into 100 sec bins |
 |
|
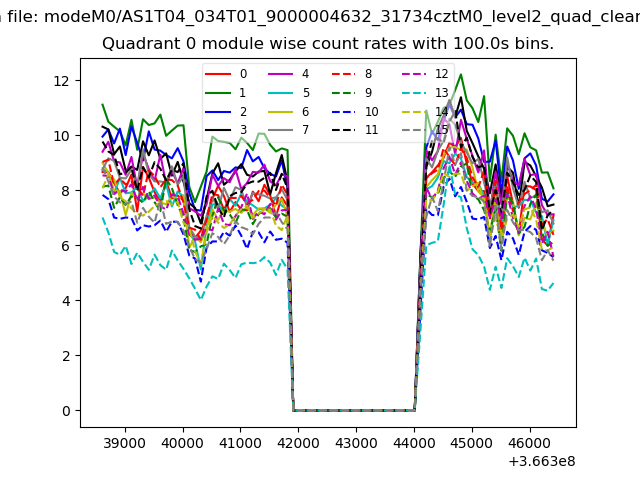
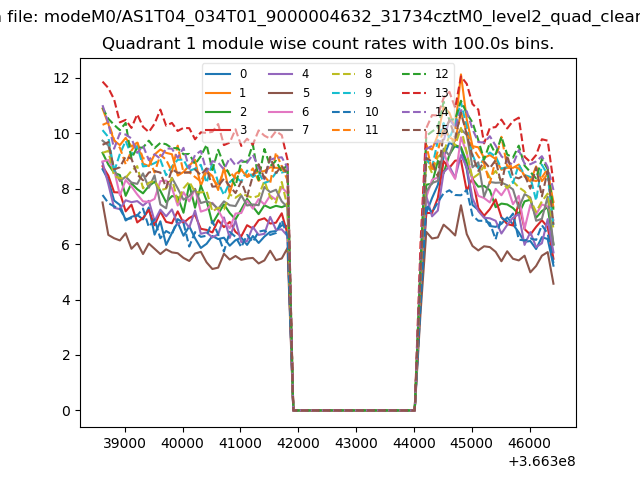
| Module-wise count rates for Quadrant A Data is divided into 100 sec bins |
 |
 |
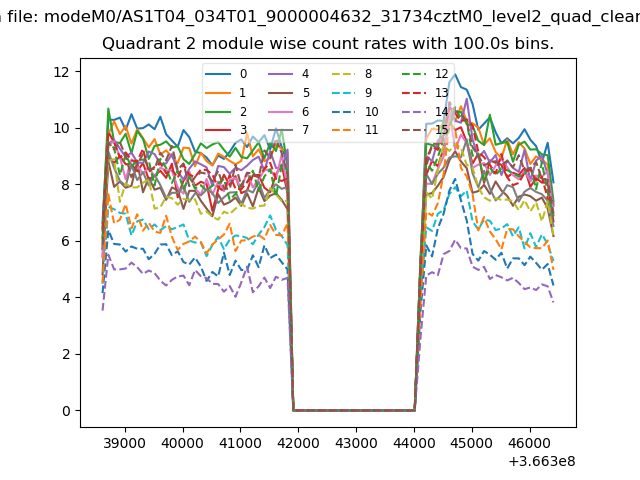
| Module-wise count rates for Quadrant B Data is divided into 100 sec bins |
 |
 |
| Module-wise count rates for Quadrant C Data is divided into 100 sec bins |
 |
 |
| Module-wise count rates for Quadrant D Data is divided into 100 sec bins |
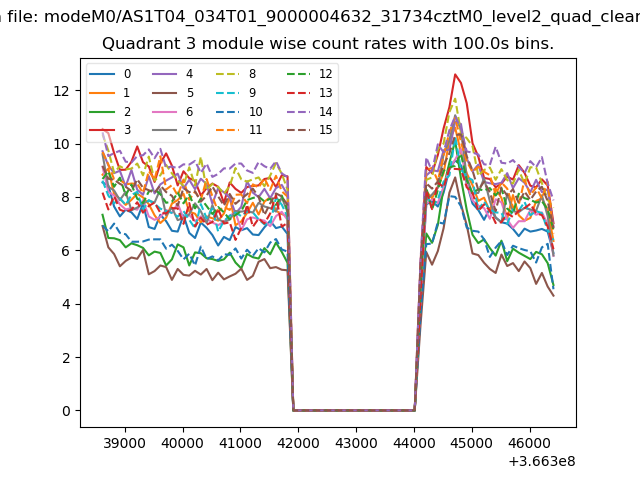 |
 |
| Parameter | Plot |
|---|---|
| CZT HV Monitor | 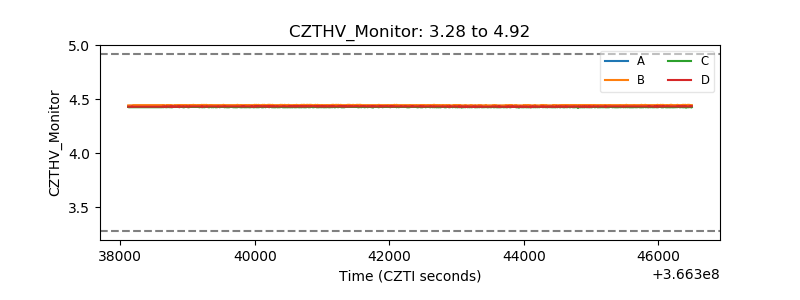 |
| D_VDD |  |
| Temperature 1 | 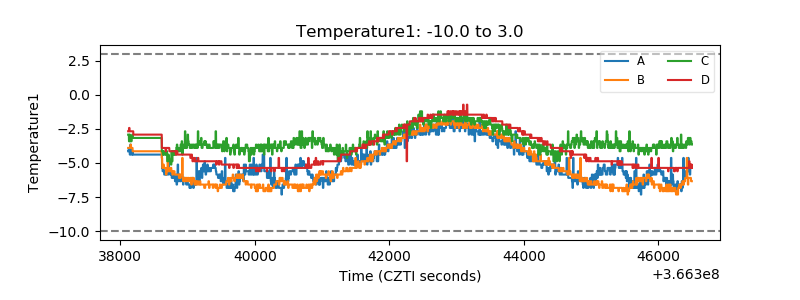 |
| Veto HV Monitor | 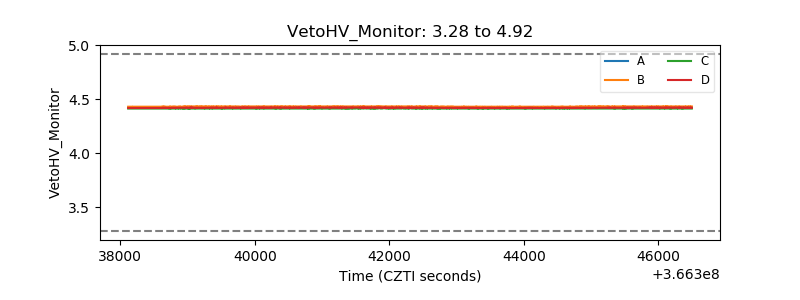 |
| Veto LLD | 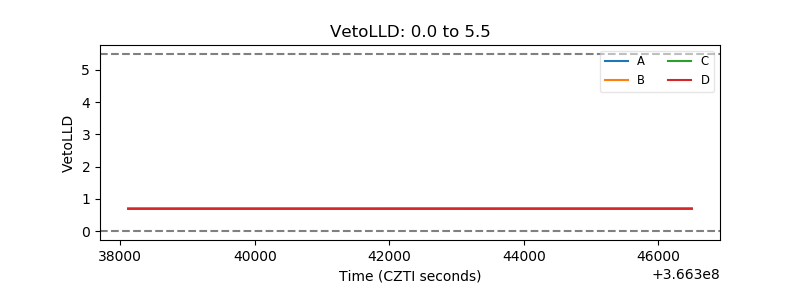 |
| Alpha Counter | 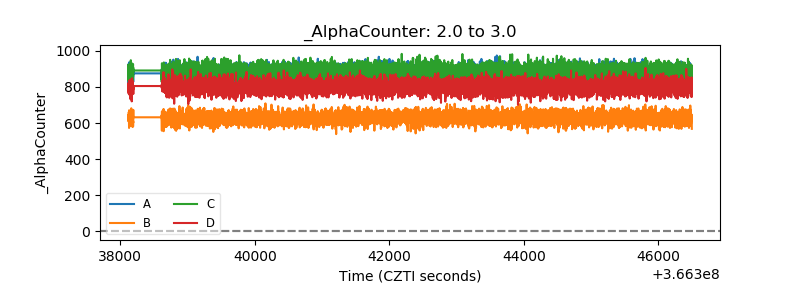 |
| _CPM_Rate | 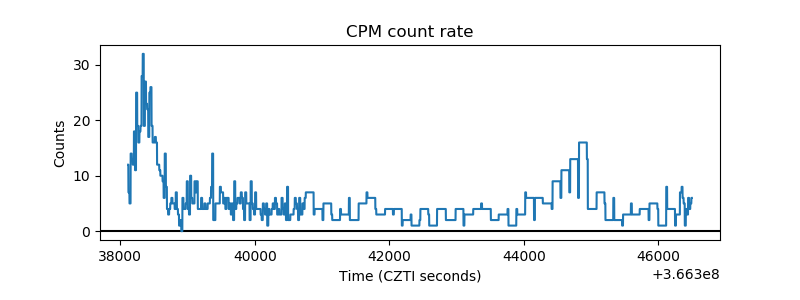 |
| CZT Counter | 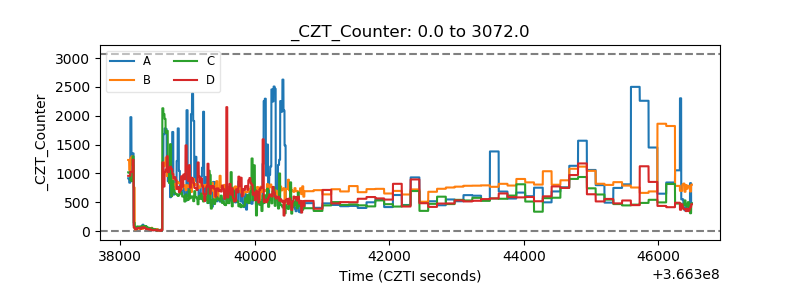 |
| +2.5 Volts monitor |  |
| +5 Volts monitor |  |
| _ROLL_ROT | 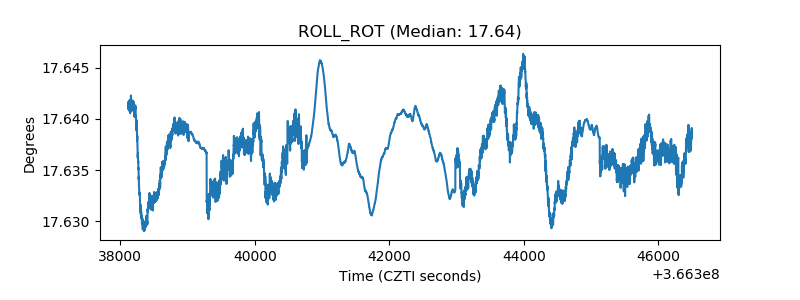 |
| _Roll_DEC | 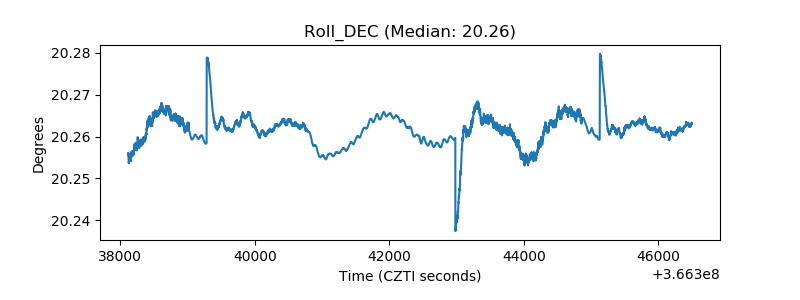 |
| _Roll_RA | 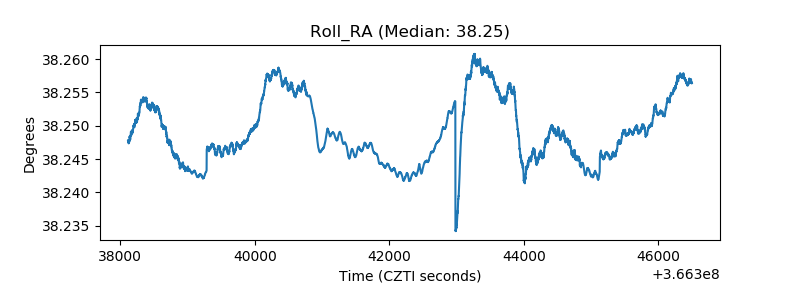 |
| Veto Counter | 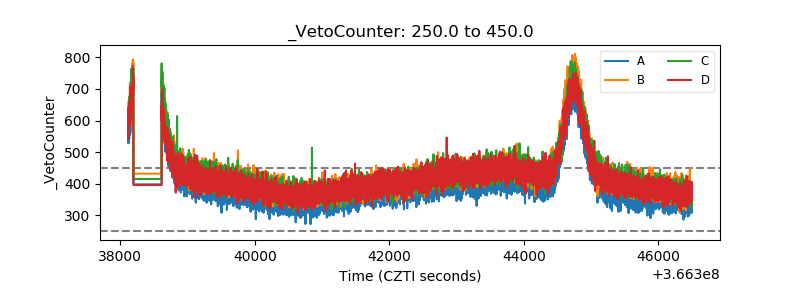 |