| Param | Original file | Final file |
|---|---|---|
| Filename | modeM0/AS1T04_034T01_9000004632_31735cztM0_level2.evt | modeM0/AS1T04_034T01_9000004632_31735cztM0_level2_quad_clean.evt |
| Size (bytes) | 294,094,080 | 55,218,240 |
| Size | 280.5 MB | 52.7 MB |
| Events in quadrant A | 3,023,032 | 337,020 |
| Events in quadrant B | 2,338,217 | 376,102 |
| Events in quadrant C | 1,714,391 | 371,881 |
| Events in quadrant D | 1,623,390 | 370,526 |
| Mode M9 | |||
|---|---|---|---|
| Quadrant | BADHDUFLAG | Total packets | Discarded packets |
| A | 0 | 3 | 0 |
| B | 0 | 4 | 1 |
| C | 0 | 3 | 0 |
| D | 0 | 3 | 0 |
| Mode SS | |||
|---|---|---|---|
| Quadrant | BADHDUFLAG | Total packets | Discarded packets |
| A | 0 | 90 | 24 |
| B | 0 | 89 | 25 |
| C | 0 | 88 | 24 |
| D | 0 | 88 | 22 |
| Mode M0 | |||
|---|---|---|---|
| Quadrant | BADHDUFLAG | Total packets | Discarded packets |
| A | 0 | 15428 | 4373 |
| B | 0 | 14533 | 5301 |
| C | 0 | 10366 | 3208 |
| D | 0 | 10099 | 3217 |
| Quadrant | Total seconds | Saturated seconds | Saturation percentage |
|---|---|---|---|
| A | 3023 | 667 | 22.064175% |
| B | 2961 | 130 | 4.390409% |
| C | 3066 | 144 | 4.696673% |
| D | 3066 | 46 | 1.500326% |
Noise dominated data is calculated using 1-second bins in cleaned event files. If a bin has >2000 counts, and if more than 50% of those come from <1% of pixels, then it is considered to be noise-dominated and hence unusable.
| Quadrant | # 1 sec bins | Bins with >0 counts | Bins with >2000 counts | High rate bins dominated by noise | Noise dominated (total time) | Noise dominated (detector-on time) | Marked lightcurve |
|---|---|---|---|---|---|---|---|
| A | 6526 | 3269 | 558 | 558 | 8.55% | 17.07% | 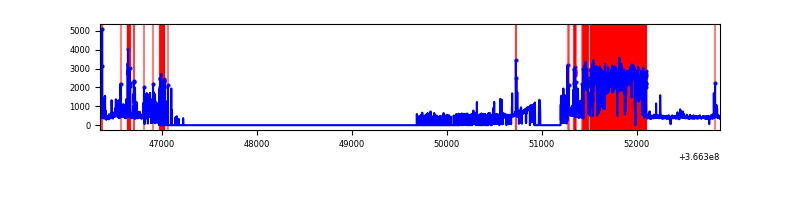 |
| B | 6526 | 3164 | 0 | 0 | 0.00% | 0.00% |  |
| C | 6526 | 3271 | 7 | 7 | 0.11% | 0.21% | 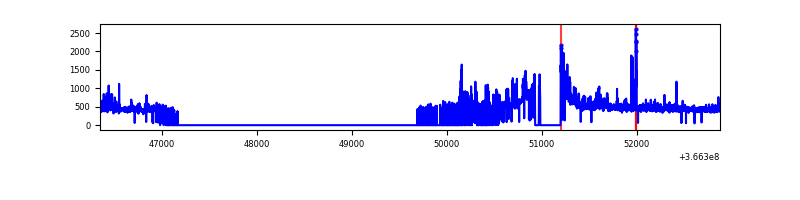 |
| D | 6526 | 3282 | 1 | 1 | 0.02% | 0.03% | 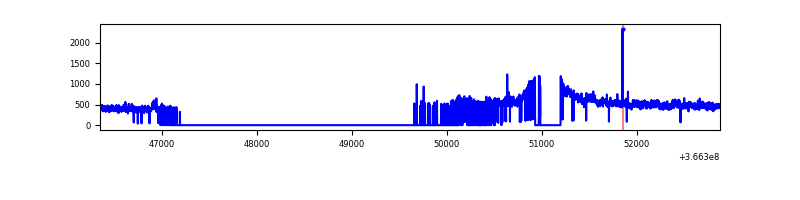 |
Top three noisy pixels from each quadrant. If the there are fewer than three noisy pixels in the level2.evt file, extra rows are filled as -1
| Pixel properties | Quadrant properties | ||||||
|---|---|---|---|---|---|---|---|
| Quadrant | DetID | PixID | Counts | Sigma | Mean | Median | Sigma |
| A | 0 | 13 | 1736462 | 24620.33 | 333 | 326 | 70.5 |
| A | 13 | 254 | 5034 | 66.76 | 333 | 326 | 70.5 |
| A | 3 | 137 | 3532 | 45.46 | 333 | 326 | 70.5 |
| B | 6 | 159 | 802472 | 11416.88 | 352 | 342 | 70.3 |
| B | 4 | 80 | 133431 | 1894.28 | 352 | 342 | 70.3 |
| B | 12 | 111 | 9139 | 125.21 | 352 | 342 | 70.3 |
| C | 0 | 10 | 259183 | 2991.01 | 354 | 356 | 86.5 |
| C | 14 | 238 | 56455 | 648.28 | 354 | 356 | 86.5 |
| C | 3 | 233 | 7447 | 81.94 | 354 | 356 | 86.5 |
| D | 8 | 195 | 269739 | 3137.29 | 355 | 344 | 85.9 |
| D | 2 | 234 | 14447 | 164.24 | 355 | 344 | 85.9 |
| D | 2 | 250 | 5002 | 54.25 | 355 | 344 | 85.9 |
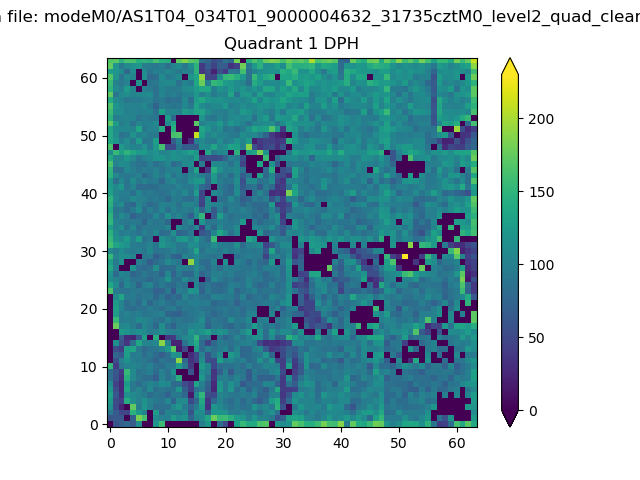
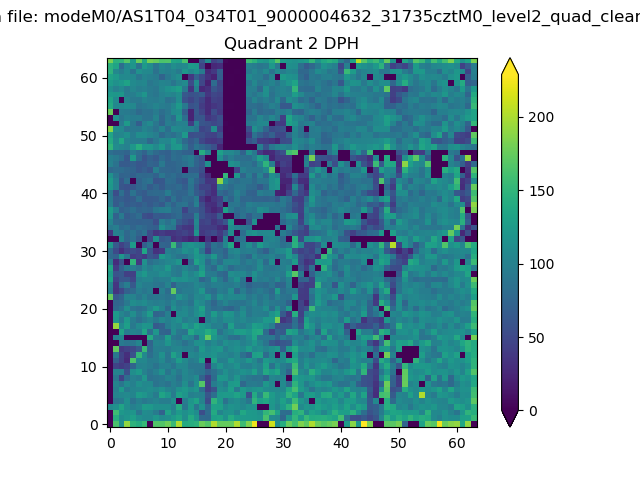
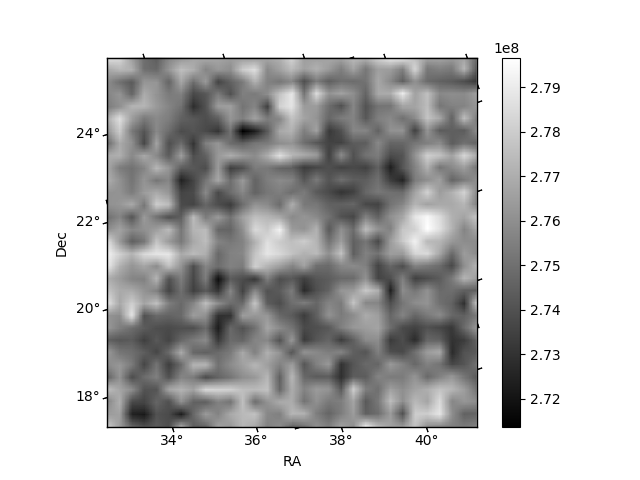
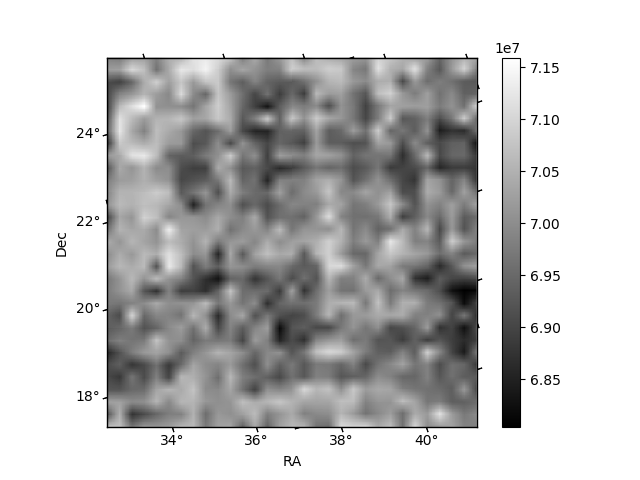
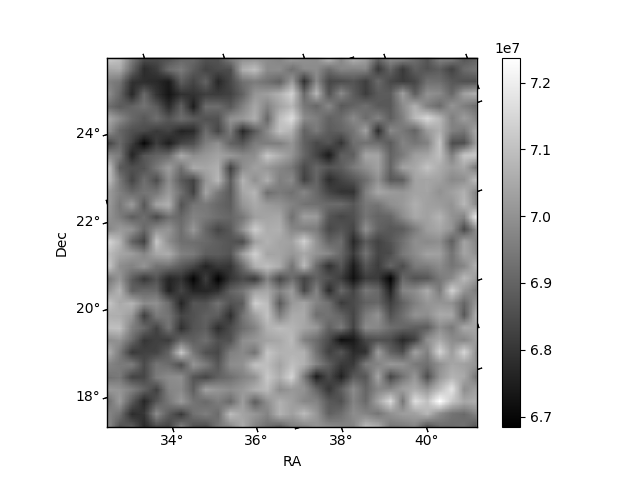
Histogram calculated using DETX and DETY for each event in the final _common_clean file
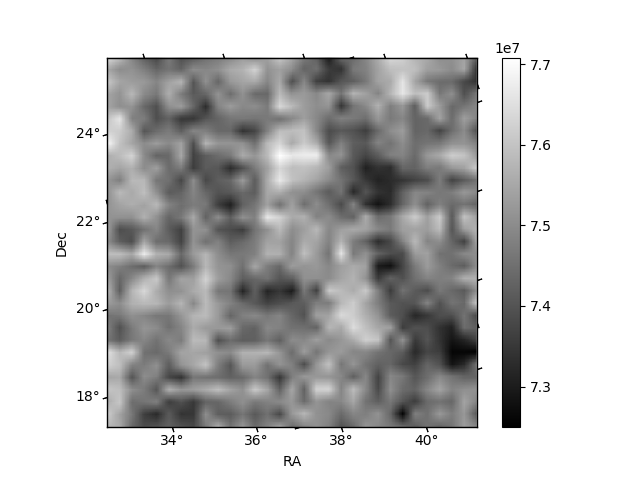
| Quadrant A | 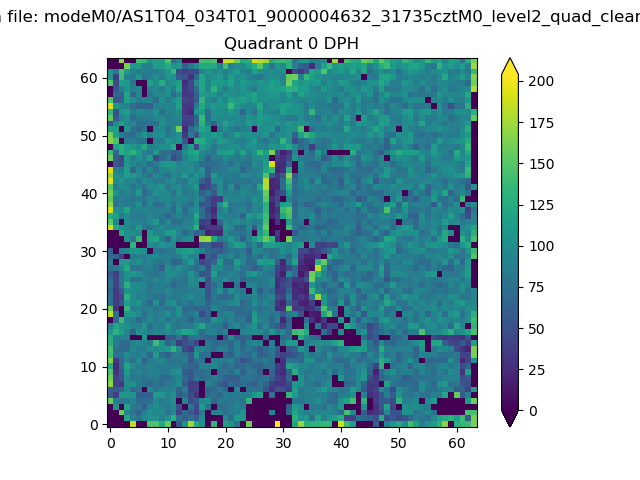 |
 |
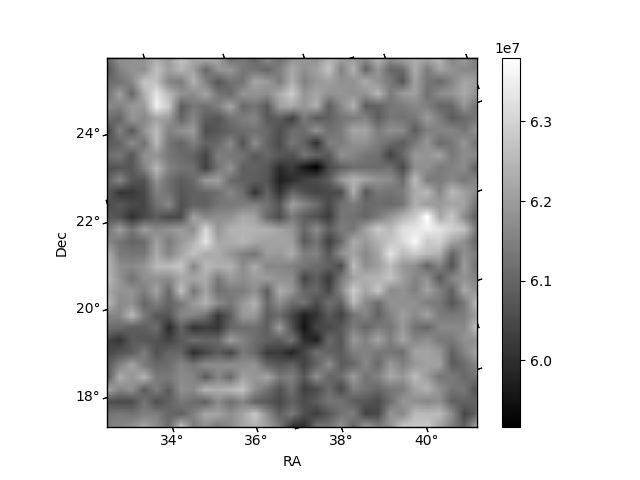
Quadrant B |
|---|---|---|---|
| Quadrant D | 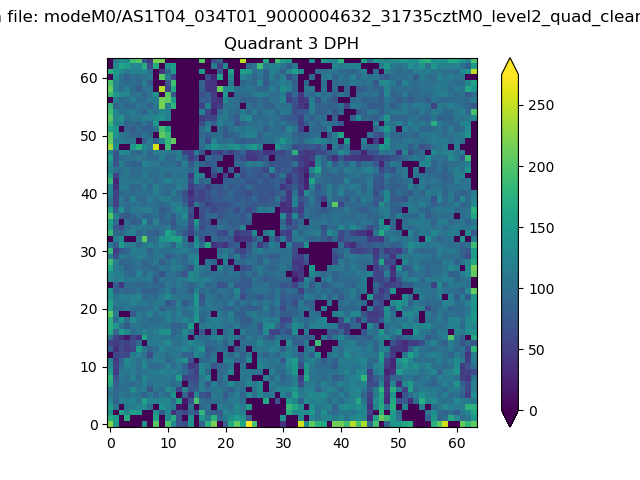 |
 |
Quadrant C |
| Plot type | Count rate plots | Images |
|---|---|---|
| Comparison with Poisson distribution Blue bars denote a histogram of data divided into 1 sec bins. Red curve is a Poisson curve with rate = median count rate of data. |
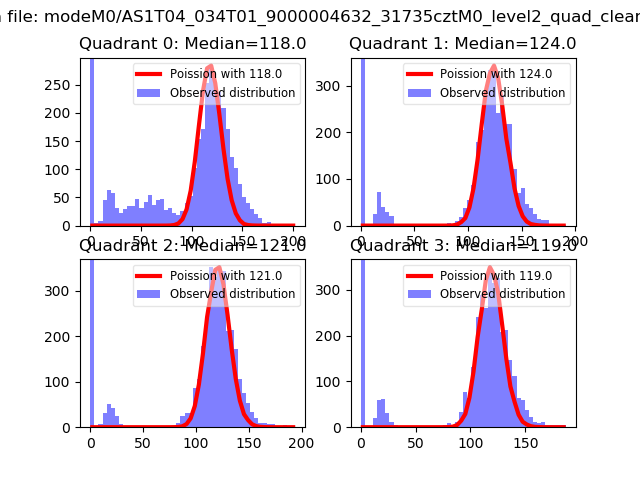 |
 |
| Quadrant-wise count rates Data is divided into 100 sec bins |
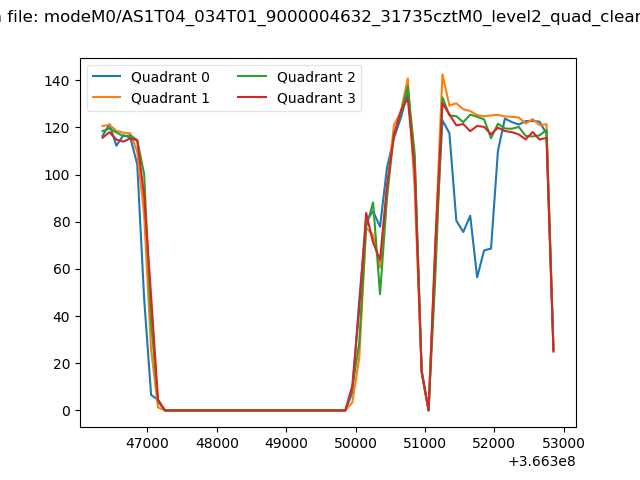 |
|
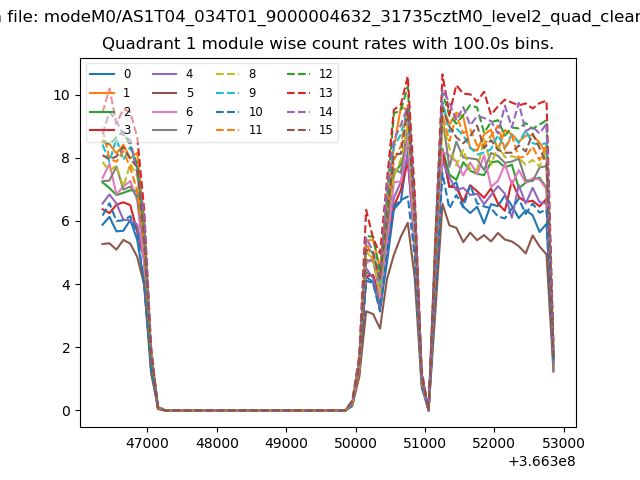
| Module-wise count rates for Quadrant A Data is divided into 100 sec bins |
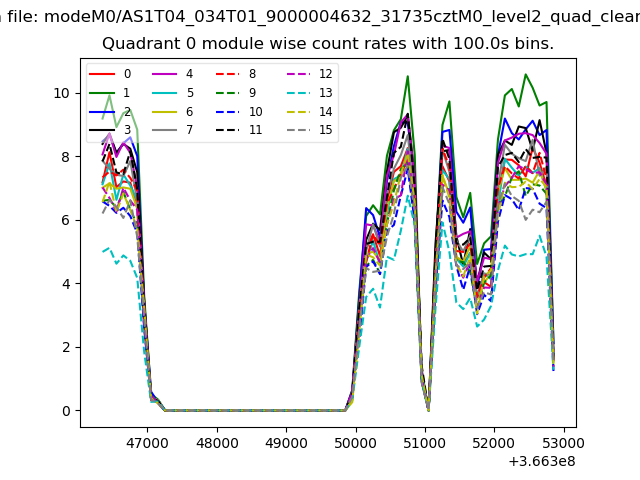 |
 |
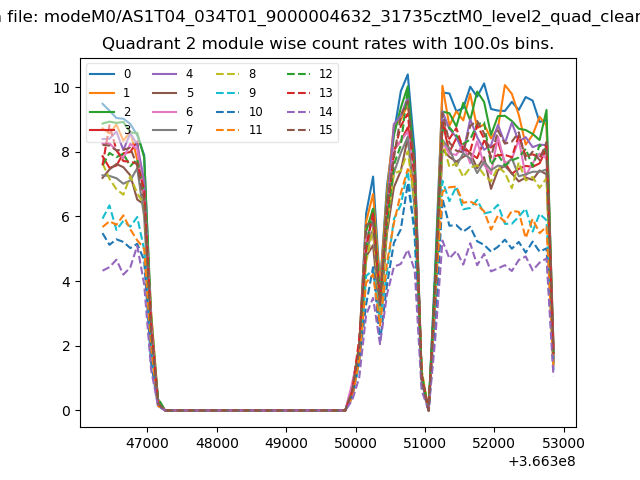
| Module-wise count rates for Quadrant B Data is divided into 100 sec bins |
 |
 |
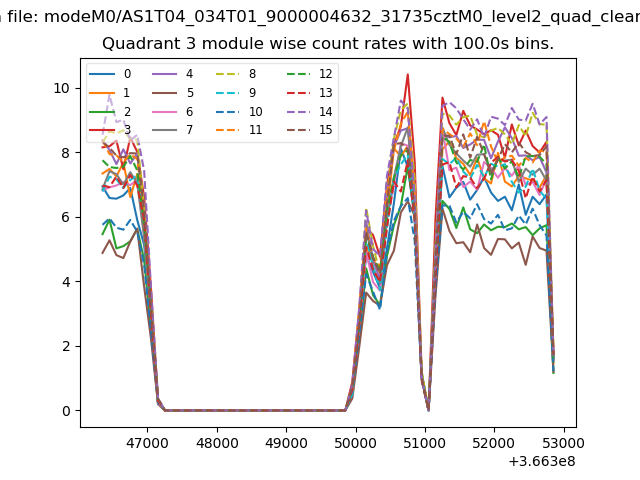
| Module-wise count rates for Quadrant C Data is divided into 100 sec bins |
 |
 |
| Module-wise count rates for Quadrant D Data is divided into 100 sec bins |
 |
 |
| Parameter | Plot |
|---|---|
| CZT HV Monitor | 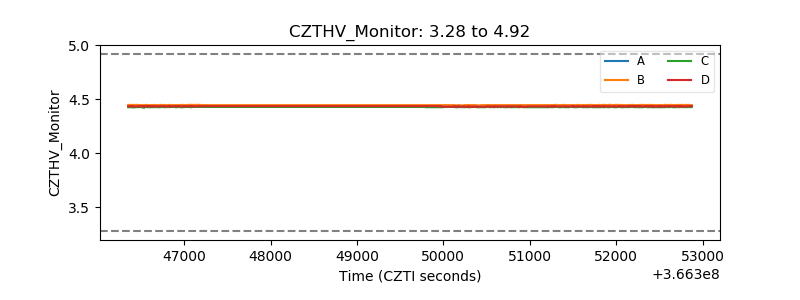 |
| D_VDD |  |
| Temperature 1 | 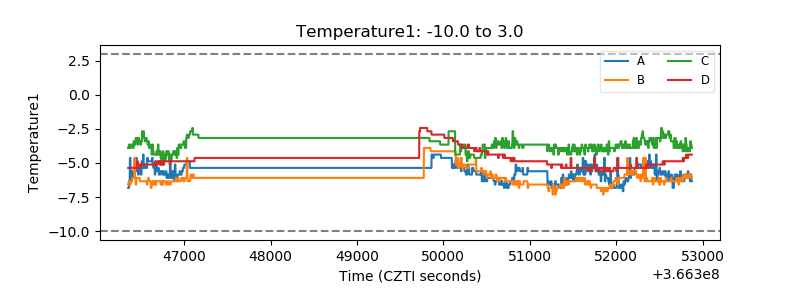 |
| Veto HV Monitor | 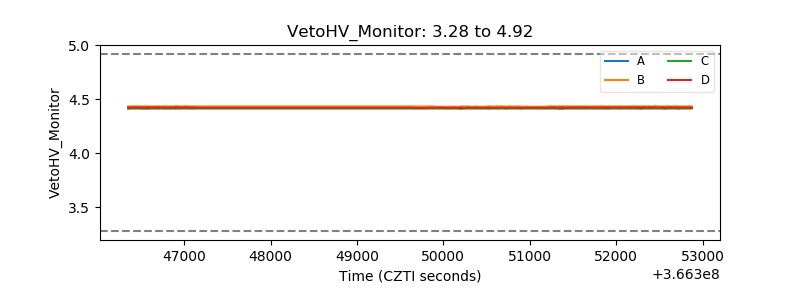 |
| Veto LLD | 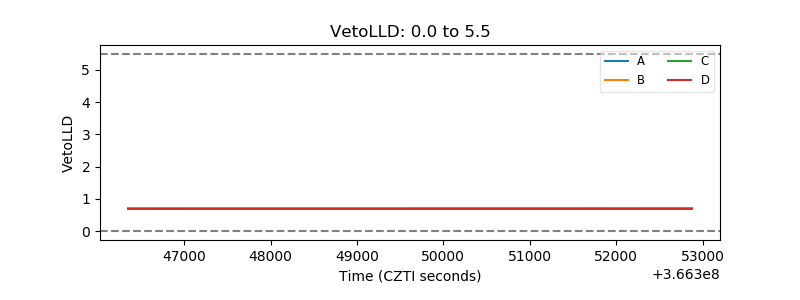 |
| Alpha Counter | 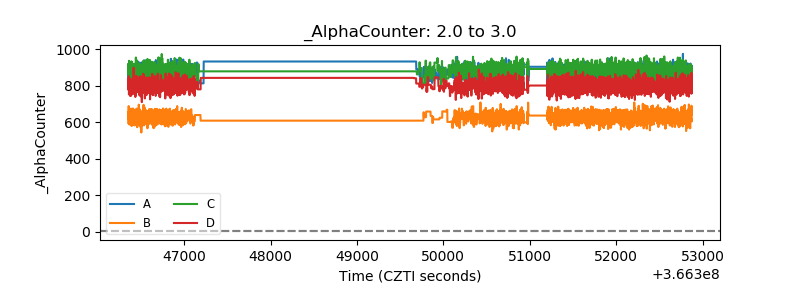 |
| _CPM_Rate | 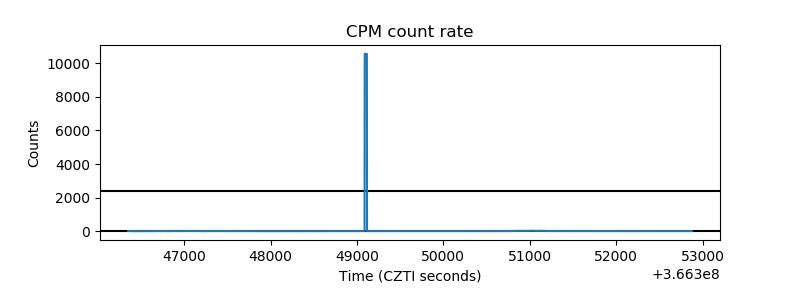 |
| CZT Counter | 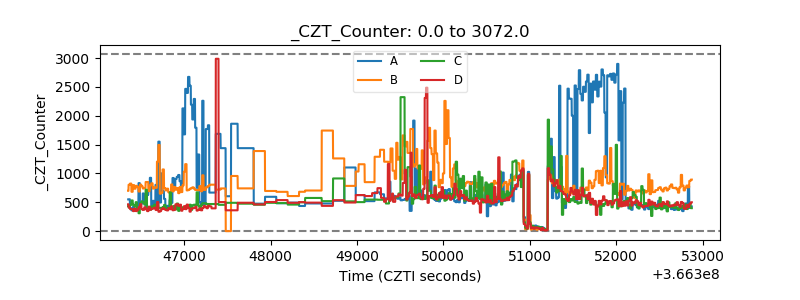 |
| +2.5 Volts monitor |  |
| +5 Volts monitor |  |
| _ROLL_ROT | 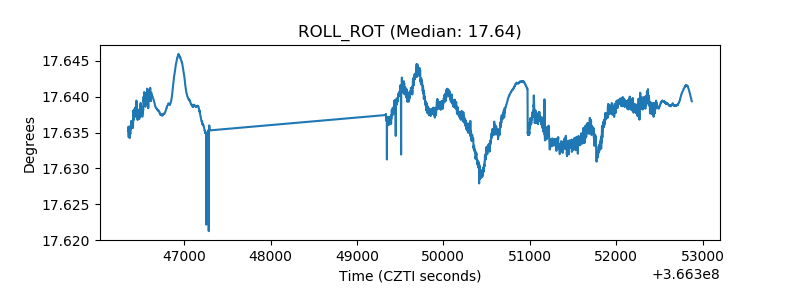 |
| _Roll_DEC | 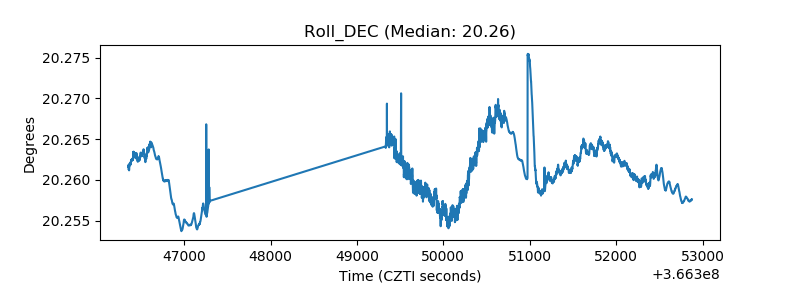 |
| _Roll_RA | 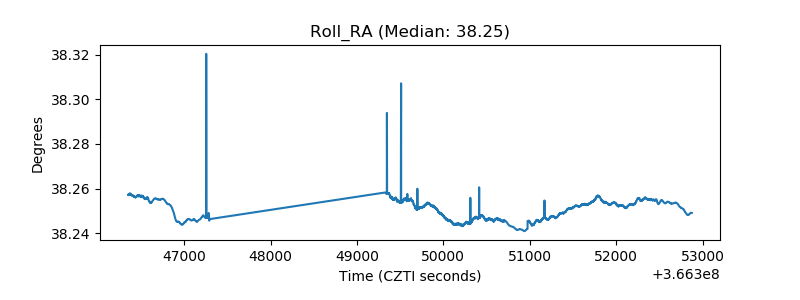 |
| Veto Counter | 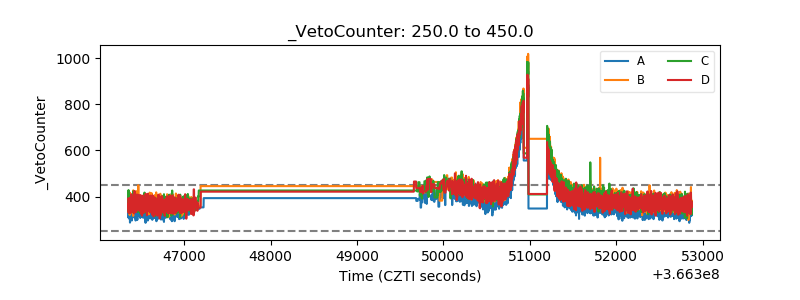 |