| Param | Original file | Final file |
|---|---|---|
| Filename | modeM0/AS1T04_034T01_9000004632_31737cztM0_level2.evt | modeM0/AS1T04_034T01_9000004632_31737cztM0_level2_quad_clean.evt |
| Size (bytes) | 964,595,520 | 111,496,320 |
| Size | 919.9 MB | 106.3 MB |
| Events in quadrant A | 6,976,803 | 655,036 |
| Events in quadrant B | 9,240,433 | 688,843 |
| Events in quadrant C | 5,666,066 | 675,346 |
| Events in quadrant D | 6,656,343 | 664,920 |
| Mode M9 | |||
|---|---|---|---|
| Quadrant | BADHDUFLAG | Total packets | Discarded packets |
| A | 0 | 5 | 0 |
| B | 0 | 5 | 0 |
| C | 0 | 5 | 0 |
| D | 0 | 5 | 0 |
| Mode SS | |||
|---|---|---|---|
| Quadrant | BADHDUFLAG | Total packets | Discarded packets |
| A | 0 | 202 | 0 |
| B | 0 | 202 | 0 |
| C | 0 | 202 | 0 |
| D | 0 | 202 | 0 |
| Mode M0 | |||
|---|---|---|---|
| Quadrant | BADHDUFLAG | Total packets | Discarded packets |
| A | 0 | 27191 | 1 |
| B | 0 | 34916 | 1 |
| C | 0 | 23188 | 1 |
| D | 0 | 26407 | 1 |
| Quadrant | Total seconds | Saturated seconds | Saturation percentage |
|---|---|---|---|
| A | 9983 | 878 | 8.794951% |
| B | 9983 | 713 | 7.142142% |
| C | 9984 | 234 | 2.343750% |
| D | 9984 | 102 | 1.021635% |
Noise dominated data is calculated using 1-second bins in cleaned event files. If a bin has >2000 counts, and if more than 50% of those come from <1% of pixels, then it is considered to be noise-dominated and hence unusable.
| Quadrant | # 1 sec bins | Bins with >0 counts | Bins with >2000 counts | High rate bins dominated by noise | Noise dominated (total time) | Noise dominated (detector-on time) | Marked lightcurve |
|---|---|---|---|---|---|---|---|
| A | 10453 | 9984 | 588 | 588 | 5.63% | 5.89% |  |
| B | 10453 | 9984 | 328 | 328 | 3.14% | 3.29% | 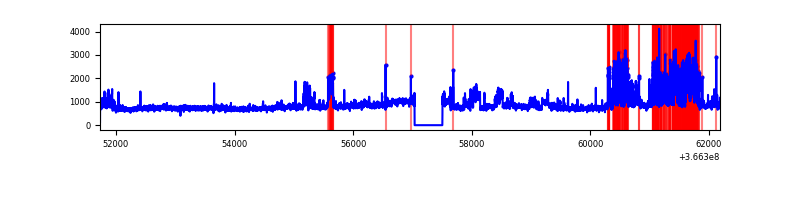 |
| C | 10454 | 9985 | 86 | 86 | 0.82% | 0.86% | 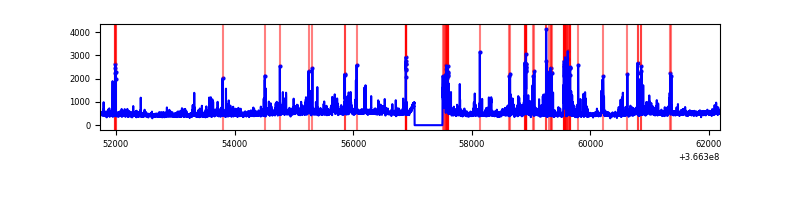 |
| D | 10454 | 9985 | 70 | 70 | 0.67% | 0.70% | 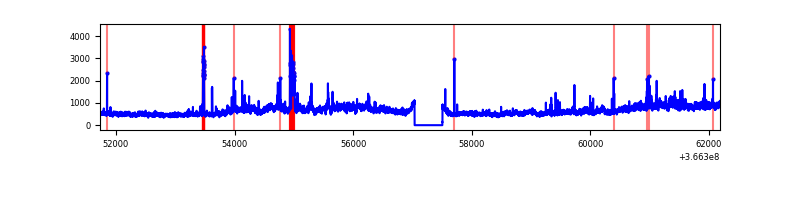 |
Top three noisy pixels from each quadrant. If the there are fewer than three noisy pixels in the level2.evt file, extra rows are filled as -1
| Pixel properties | Quadrant properties | ||||||
|---|---|---|---|---|---|---|---|
| Quadrant | DetID | PixID | Counts | Sigma | Mean | Median | Sigma |
| A | 0 | 13 | 2553609 | 10945.48 | 1144 | 1120 | 233.2 |
| A | 13 | 254 | 16238 | 64.83 | 1144 | 1120 | 233.2 |
| A | 3 | 137 | 11813 | 45.85 | 1144 | 1120 | 233.2 |
| B | 6 | 159 | 2601523 | 11792.33 | 1150 | 1123 | 220.5 |
| B | 5 | 255 | 1188600 | 5384.99 | 1150 | 1123 | 220.5 |
| B | 4 | 80 | 807630 | 3657.36 | 1150 | 1123 | 220.5 |
| C | 0 | 10 | 861945 | 3209.3 | 1138 | 1143 | 268.2 |
| C | 14 | 238 | 183243 | 678.92 | 1138 | 1143 | 268.2 |
| C | 10 | 22 | 88218 | 324.64 | 1138 | 1143 | 268.2 |
| D | 8 | 195 | 1965453 | 7262.98 | 1150 | 1121 | 270.5 |
| D | 12 | 233 | 301521 | 1110.71 | 1150 | 1121 | 270.5 |
| D | 2 | 234 | 43398 | 156.32 | 1150 | 1121 | 270.5 |
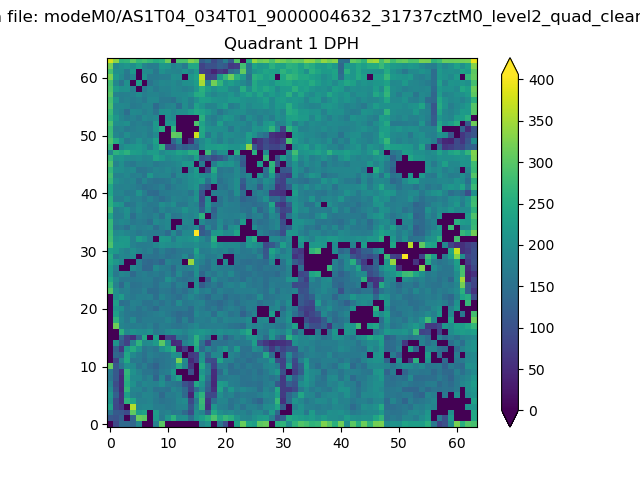
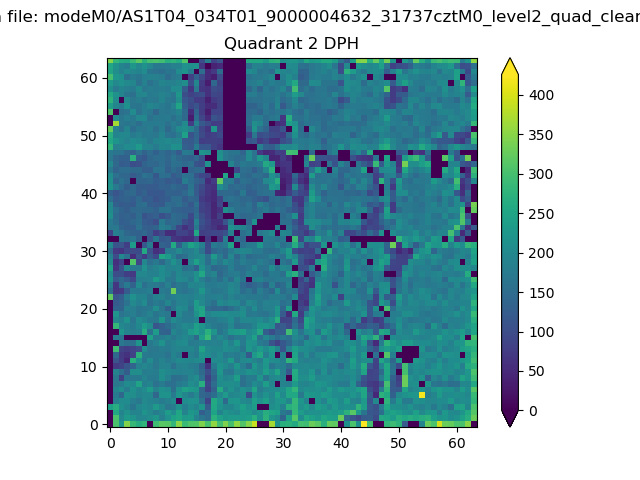
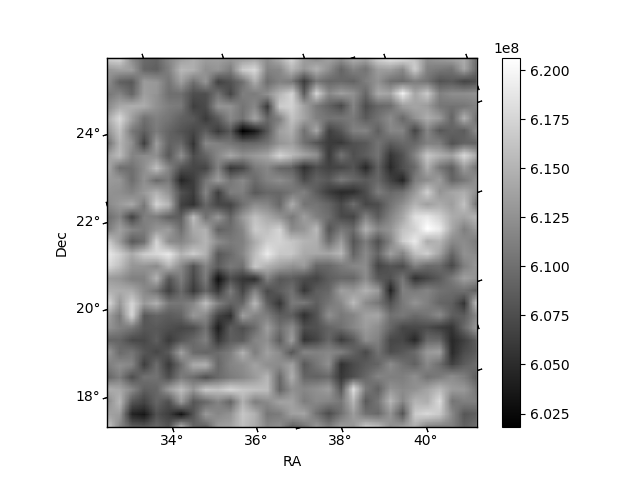
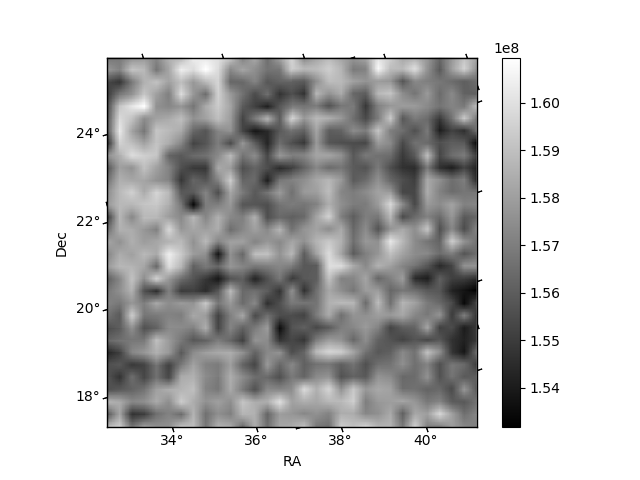
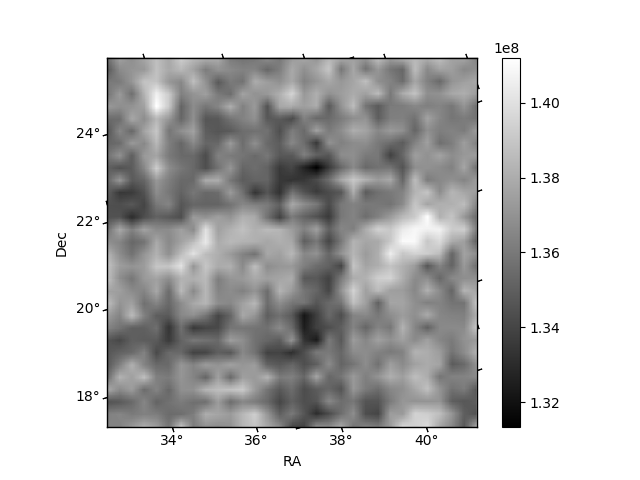
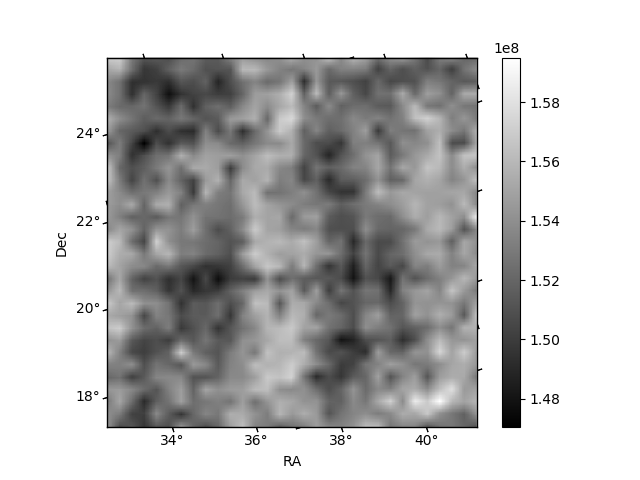
Histogram calculated using DETX and DETY for each event in the final _common_clean file
| Quadrant A | 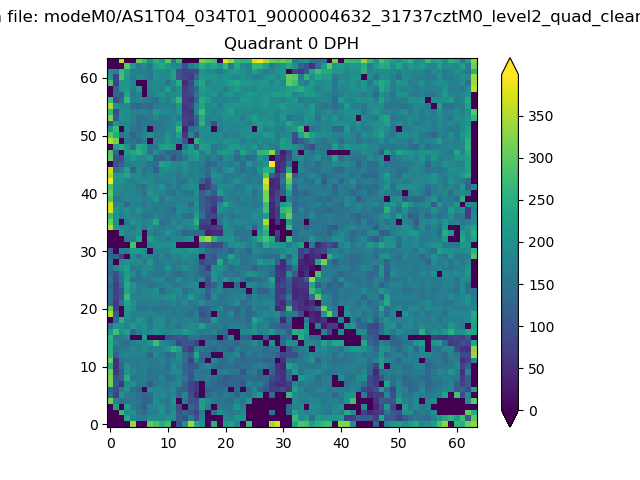 |
 |
Quadrant B |
|---|---|---|---|
| Quadrant D | 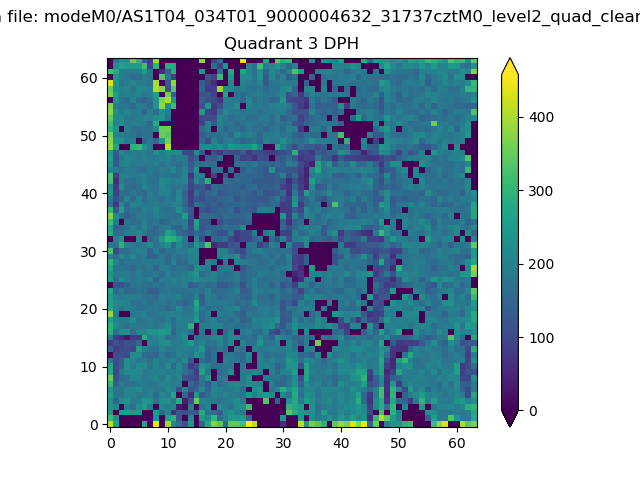 |
 |
Quadrant C |
| Plot type | Count rate plots | Images |
|---|---|---|
| Comparison with Poisson distribution Blue bars denote a histogram of data divided into 1 sec bins. Red curve is a Poisson curve with rate = median count rate of data. |
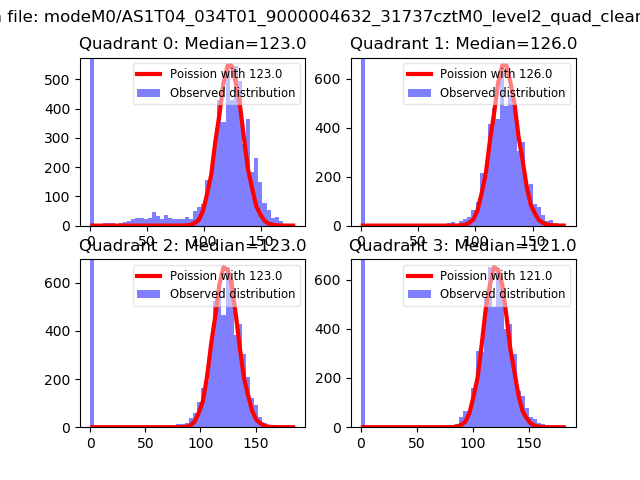 |
 |
| Quadrant-wise count rates Data is divided into 100 sec bins |
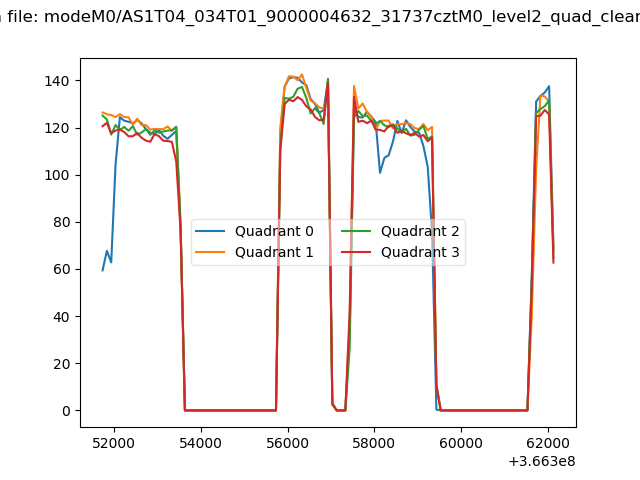 |
|
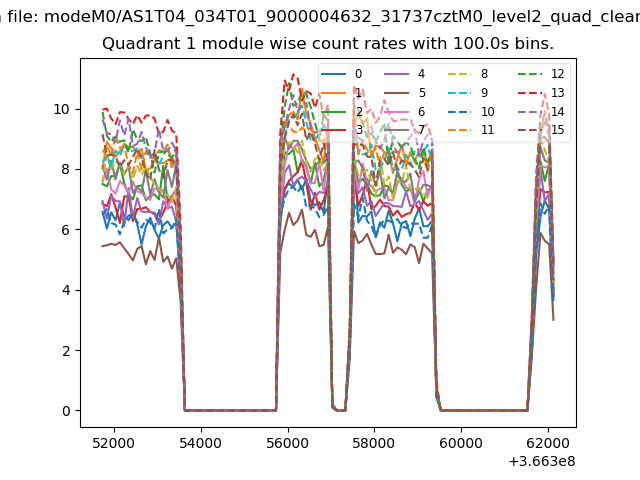
| Module-wise count rates for Quadrant A Data is divided into 100 sec bins |
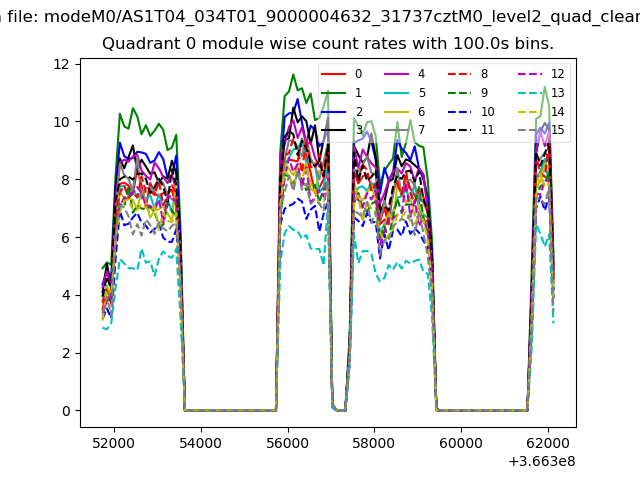 |
 |
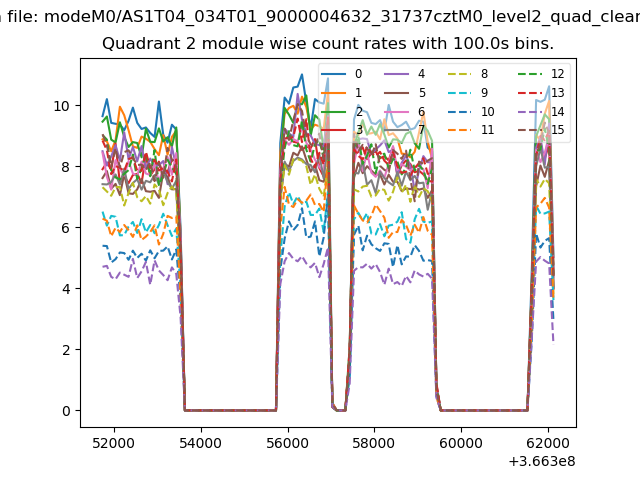
| Module-wise count rates for Quadrant B Data is divided into 100 sec bins |
 |
 |
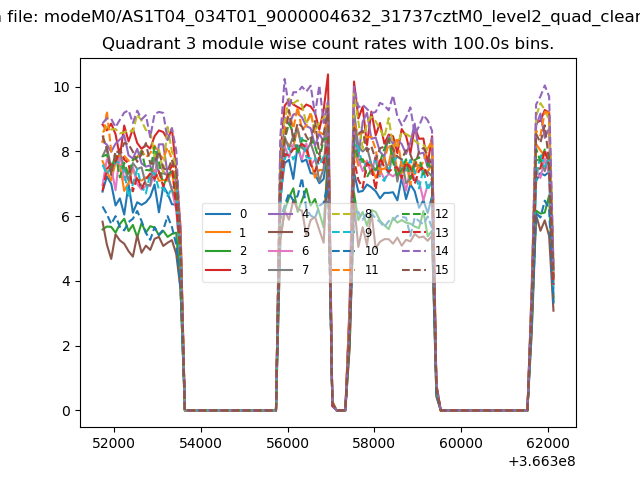
| Module-wise count rates for Quadrant C Data is divided into 100 sec bins |
 |
 |
| Module-wise count rates for Quadrant D Data is divided into 100 sec bins |
 |
 |
| Parameter | Plot |
|---|---|
| CZT HV Monitor | 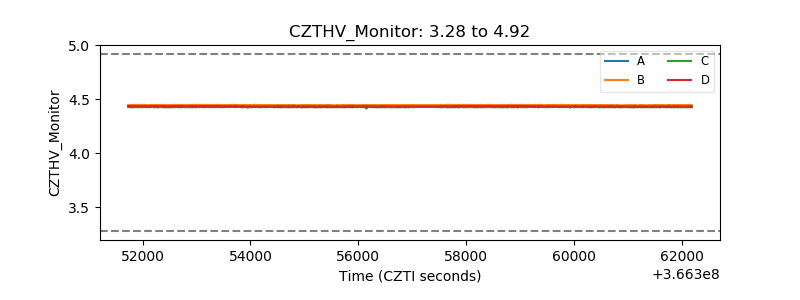 |
| D_VDD |  |
| Temperature 1 | 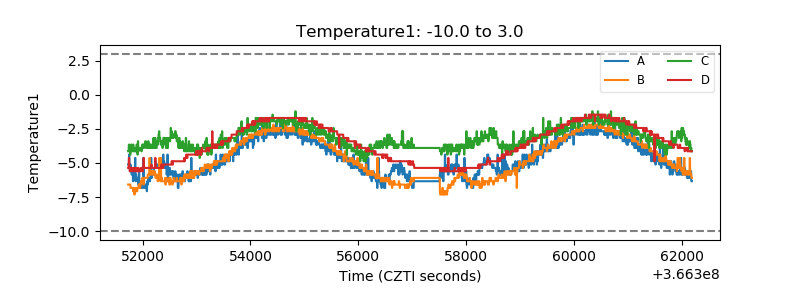 |
| Veto HV Monitor |  |
| Veto LLD | 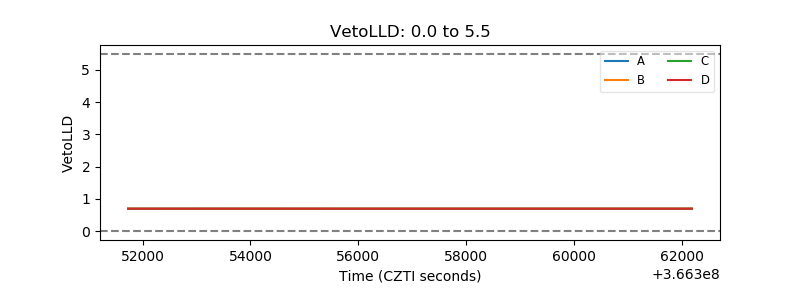 |
| Alpha Counter | 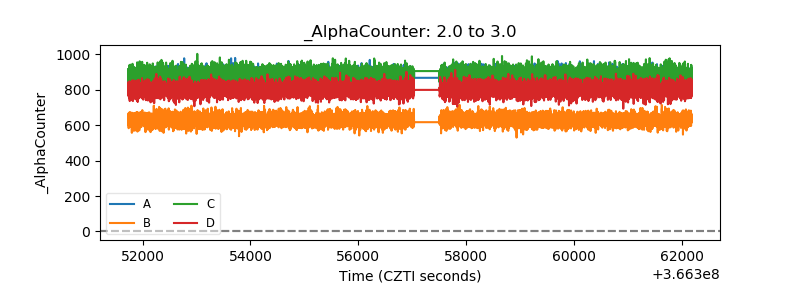 |
| _CPM_Rate | 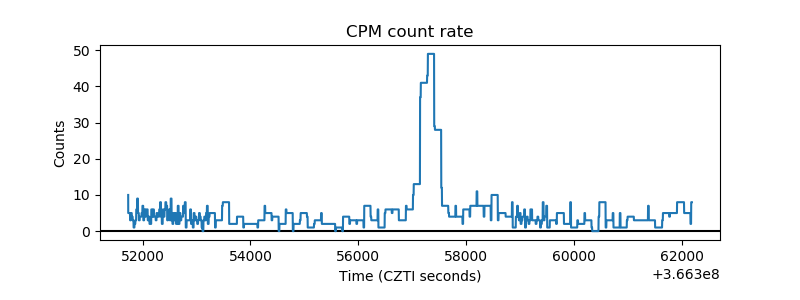 |
| CZT Counter | 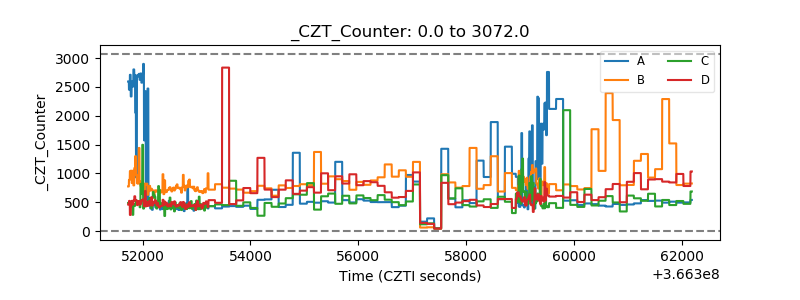 |
| +2.5 Volts monitor |  |
| +5 Volts monitor |  |
| _ROLL_ROT | 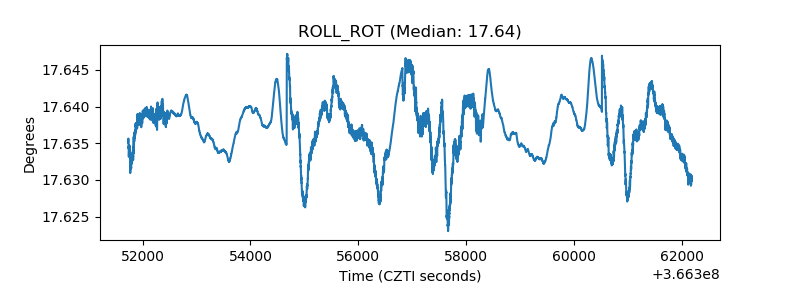 |
| _Roll_DEC | 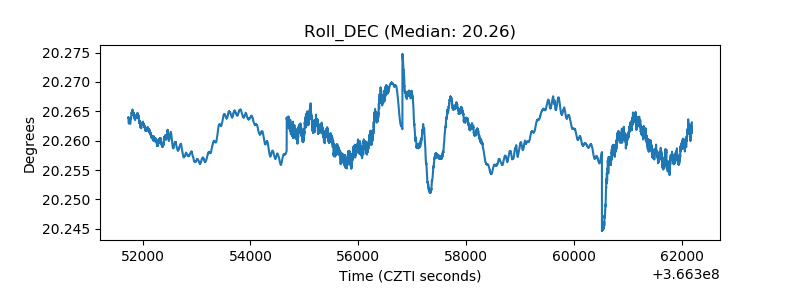 |
| _Roll_RA | 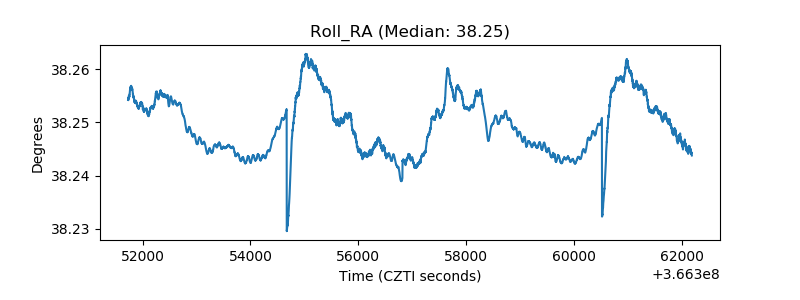 |
| Veto Counter | 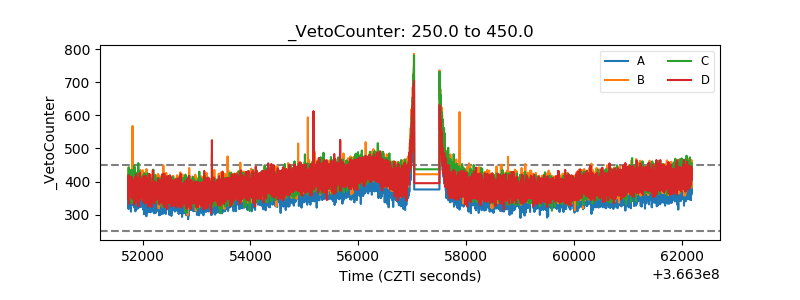 |