| Param | Original file | Final file |
|---|---|---|
| Filename | modeM0/AS1T04_034T01_9000004632_31738cztM0_level2.evt | modeM0/AS1T04_034T01_9000004632_31738cztM0_level2_quad_clean.evt |
| Size (bytes) | 906,099,840 | 117,662,400 |
| Size | 864.1 MB | 112.2 MB |
| Events in quadrant A | 5,806,230 | 744,272 |
| Events in quadrant B | 9,490,875 | 741,942 |
| Events in quadrant C | 5,220,938 | 726,824 |
| Events in quadrant D | 6,309,469 | 718,555 |
| Mode M9 | |||
|---|---|---|---|
| Quadrant | BADHDUFLAG | Total packets | Discarded packets |
| A | 0 | 14 | 0 |
| B | 0 | 14 | 0 |
| C | 0 | 14 | 0 |
| D | 0 | 14 | 0 |
| Mode SS | |||
|---|---|---|---|
| Quadrant | BADHDUFLAG | Total packets | Discarded packets |
| A | 0 | 188 | 0 |
| B | 0 | 188 | 0 |
| C | 0 | 188 | 0 |
| D | 0 | 188 | 0 |
| Mode M0 | |||
|---|---|---|---|
| Quadrant | BADHDUFLAG | Total packets | Discarded packets |
| A | 0 | 22757 | 2 |
| B | 0 | 34471 | 4 |
| C | 0 | 20927 | 2 |
| D | 0 | 24846 | 2 |
| Quadrant | Total seconds | Saturated seconds | Saturation percentage |
|---|---|---|---|
| A | 9094 | 495 | 5.443149% |
| B | 9093 | 1317 | 14.483669% |
| C | 9094 | 307 | 3.375852% |
| D | 9094 | 110 | 1.209589% |
Noise dominated data is calculated using 1-second bins in cleaned event files. If a bin has >2000 counts, and if more than 50% of those come from <1% of pixels, then it is considered to be noise-dominated and hence unusable.
| Quadrant | # 1 sec bins | Bins with >0 counts | Bins with >2000 counts | High rate bins dominated by noise | Noise dominated (total time) | Noise dominated (detector-on time) | Marked lightcurve |
|---|---|---|---|---|---|---|---|
| A | 10594 | 9095 | 310 | 310 | 2.93% | 3.41% | 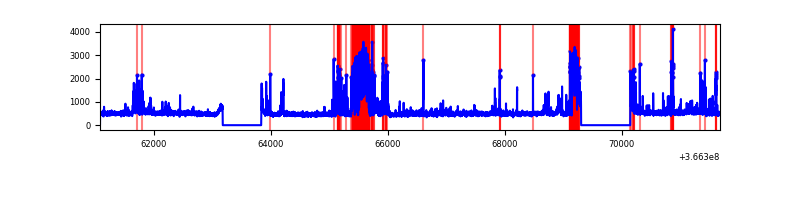 |
| B | 10593 | 9094 | 749 | 749 | 7.07% | 8.24% | 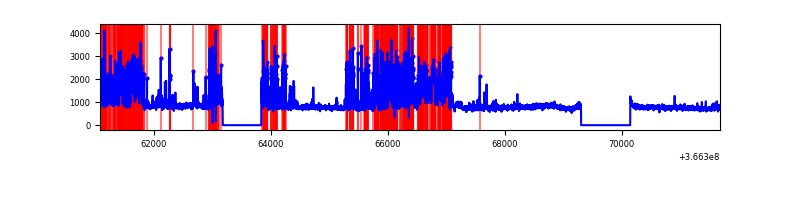 |
| C | 10594 | 9095 | 104 | 104 | 0.98% | 1.14% | 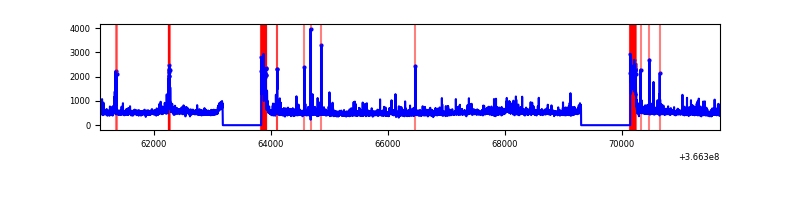 |
| D | 10594 | 9095 | 33 | 33 | 0.31% | 0.36% | 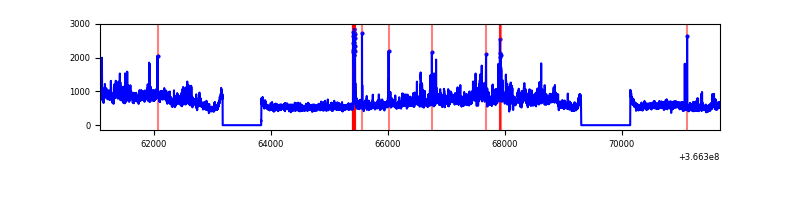 |
Top three noisy pixels from each quadrant. If the there are fewer than three noisy pixels in the level2.evt file, extra rows are filled as -1
| Pixel properties | Quadrant properties | ||||||
|---|---|---|---|---|---|---|---|
| Quadrant | DetID | PixID | Counts | Sigma | Mean | Median | Sigma |
| A | 0 | 13 | 1518333 | 6779.14 | 1110 | 1086 | 223.8 |
| A | 13 | 254 | 15807 | 65.77 | 1110 | 1086 | 223.8 |
| A | 3 | 137 | 11579 | 46.88 | 1110 | 1086 | 223.8 |
| B | 5 | 255 | 2477667 | 11975.86 | 1065 | 1036 | 206.8 |
| B | 6 | 159 | 2326536 | 11245.06 | 1065 | 1036 | 206.8 |
| B | 4 | 80 | 371992 | 1793.77 | 1065 | 1036 | 206.8 |
| C | 0 | 10 | 692744 | 2742.1 | 1074 | 1082 | 252.2 |
| C | 14 | 238 | 172720 | 680.46 | 1074 | 1082 | 252.2 |
| C | 3 | 233 | 53798 | 208.99 | 1074 | 1082 | 252.2 |
| D | 8 | 195 | 1927711 | 7322.41 | 1095 | 1064 | 263.1 |
| D | 12 | 233 | 205085 | 775.4 | 1095 | 1064 | 263.1 |
| D | 2 | 234 | 38901 | 143.8 | 1095 | 1064 | 263.1 |
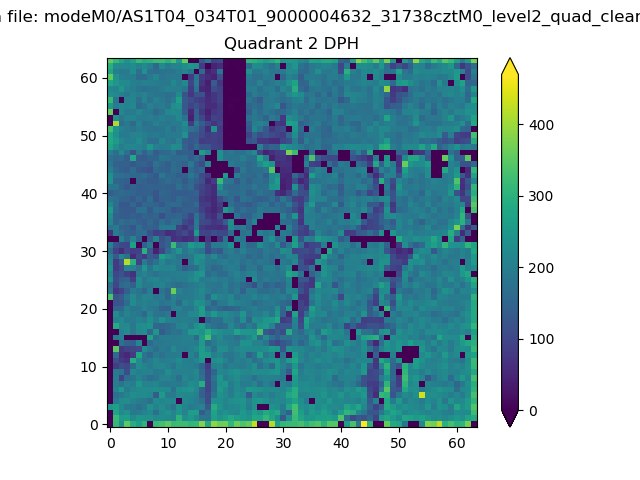
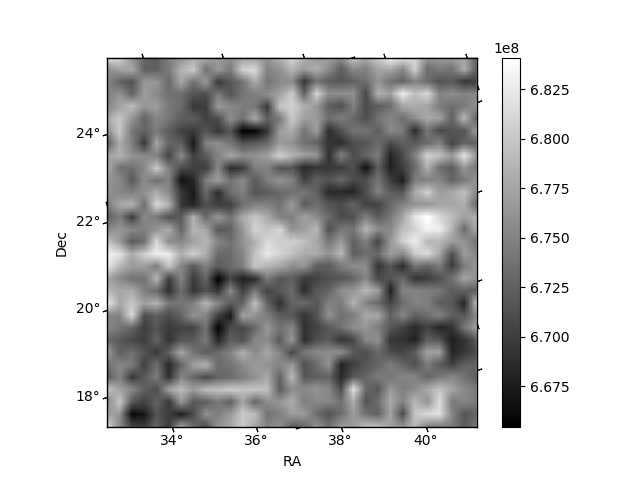
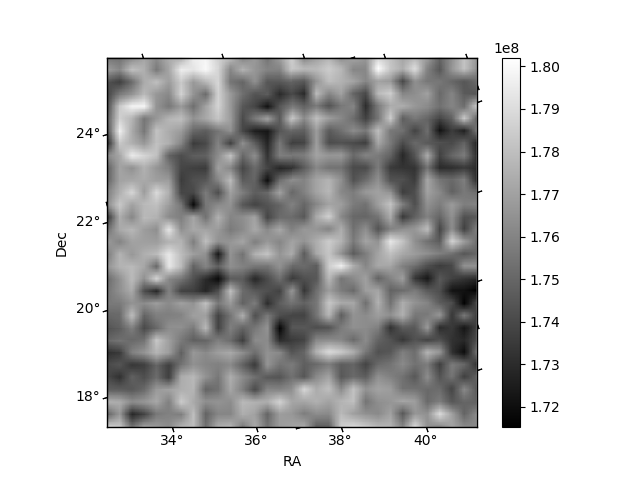
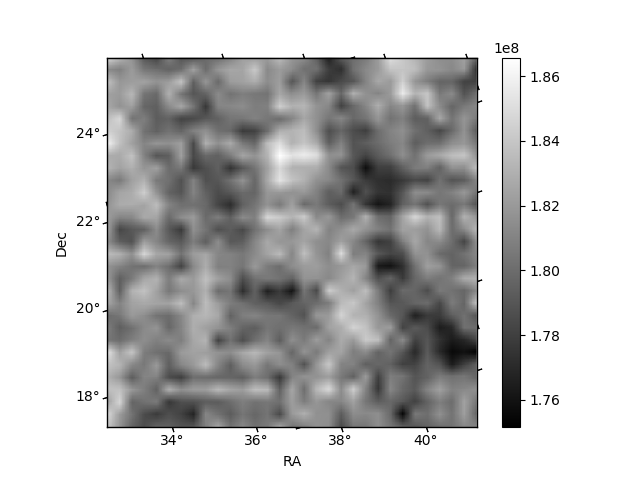
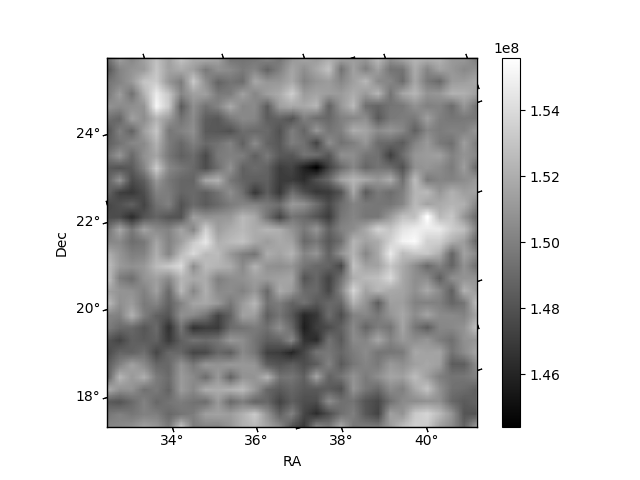
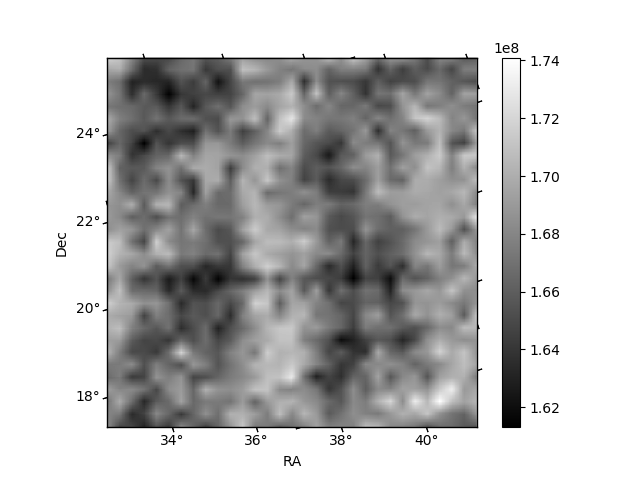
Histogram calculated using DETX and DETY for each event in the final _common_clean file
| Quadrant A | 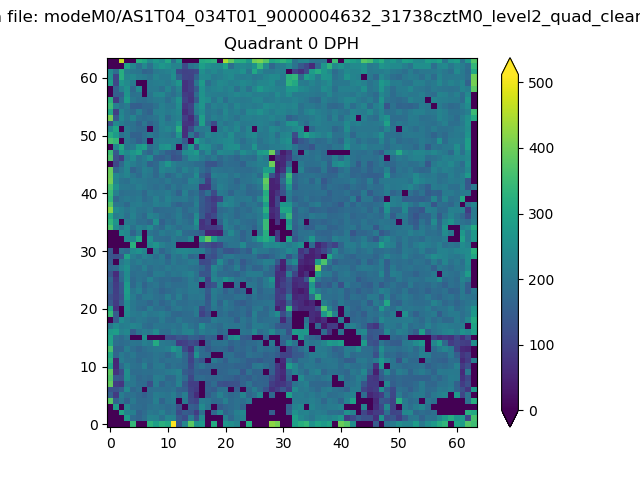 |
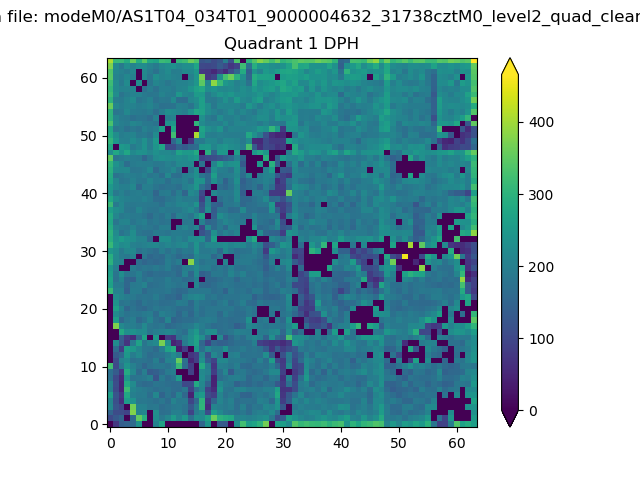 |
Quadrant B |
|---|---|---|---|
| Quadrant D | 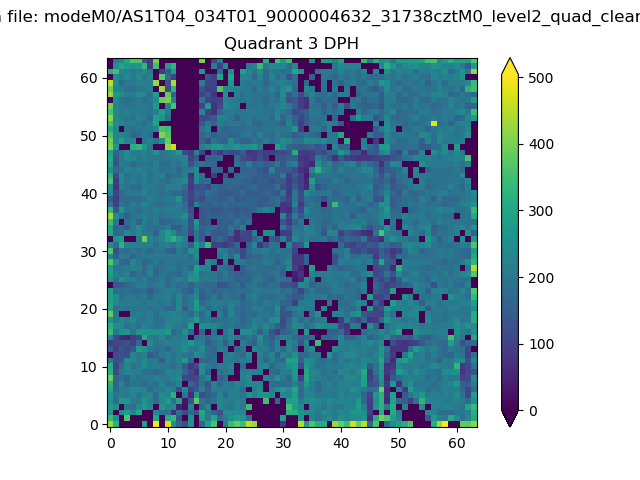 |
 |
Quadrant C |
| Plot type | Count rate plots | Images |
|---|---|---|
| Comparison with Poisson distribution Blue bars denote a histogram of data divided into 1 sec bins. Red curve is a Poisson curve with rate = median count rate of data. |
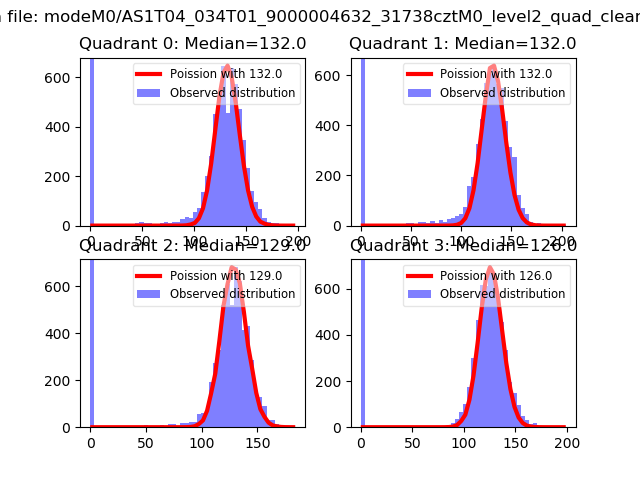 |
 |
| Quadrant-wise count rates Data is divided into 100 sec bins |
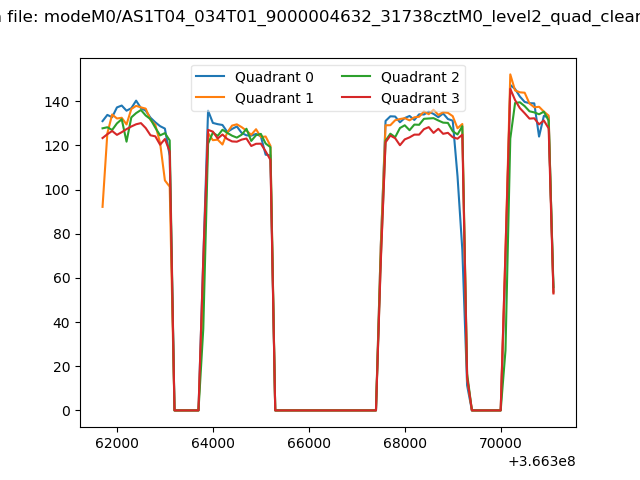 |
|
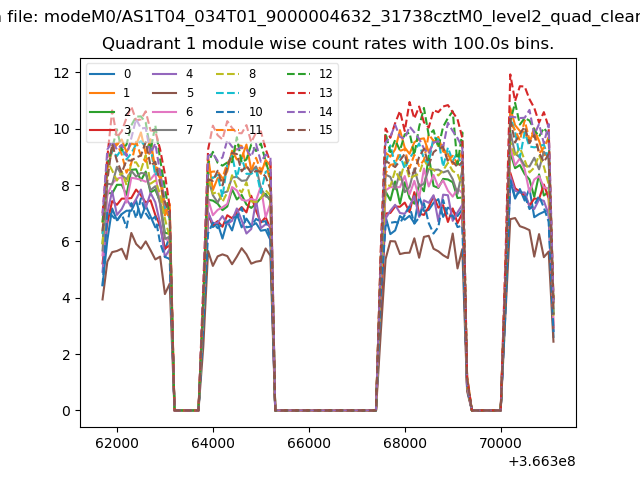
| Module-wise count rates for Quadrant A Data is divided into 100 sec bins |
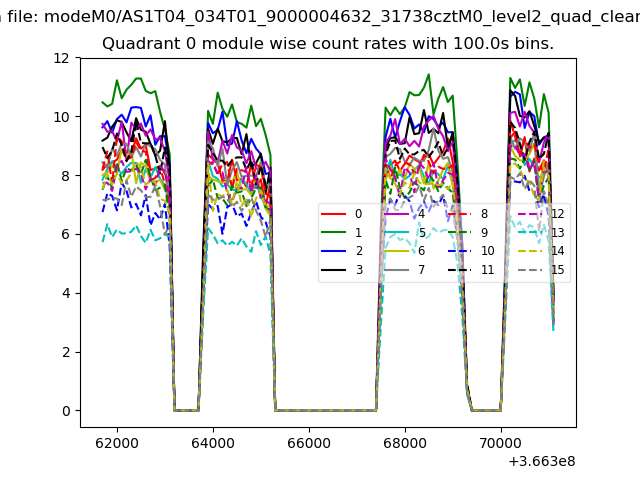 |
 |
| Module-wise count rates for Quadrant B Data is divided into 100 sec bins |
 |
 |
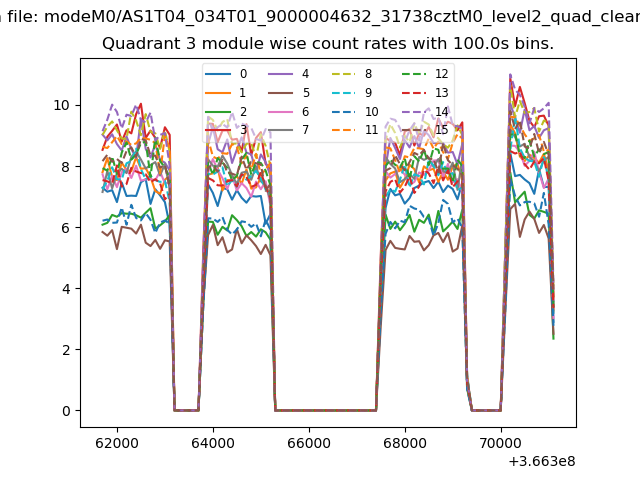
| Module-wise count rates for Quadrant C Data is divided into 100 sec bins |
 |
 |
| Module-wise count rates for Quadrant D Data is divided into 100 sec bins |
 |
 |
| Parameter | Plot |
|---|---|
| CZT HV Monitor | 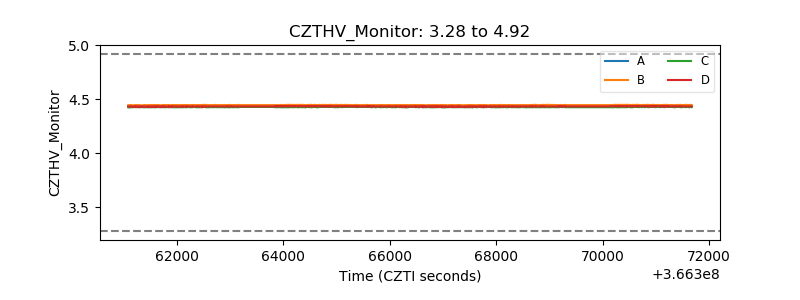 |
| D_VDD | 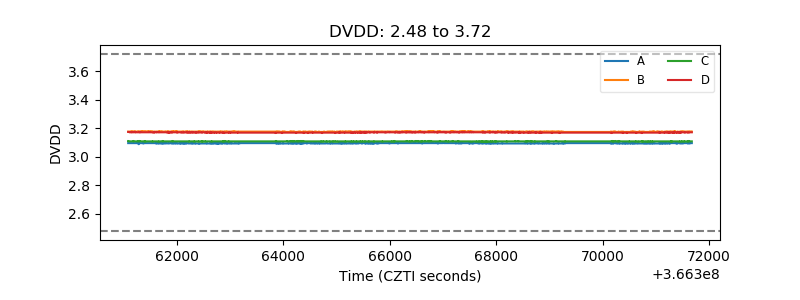 |
| Temperature 1 | 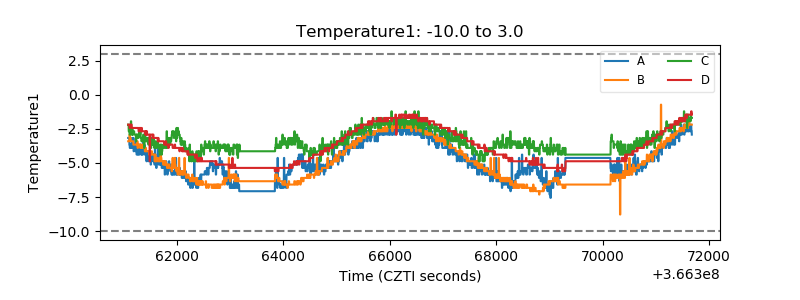 |
| Veto HV Monitor | 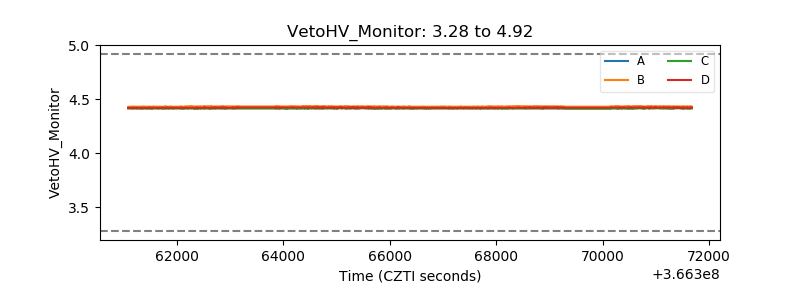 |
| Veto LLD | 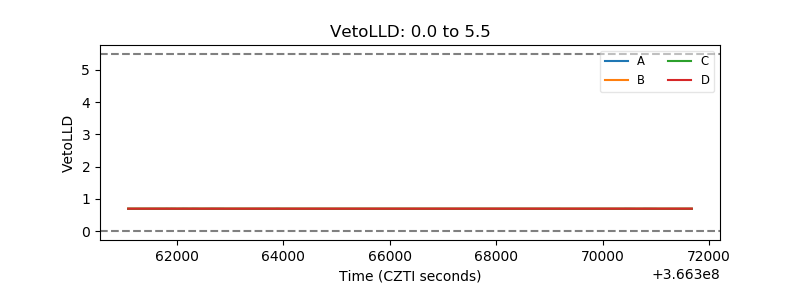 |
| Alpha Counter | 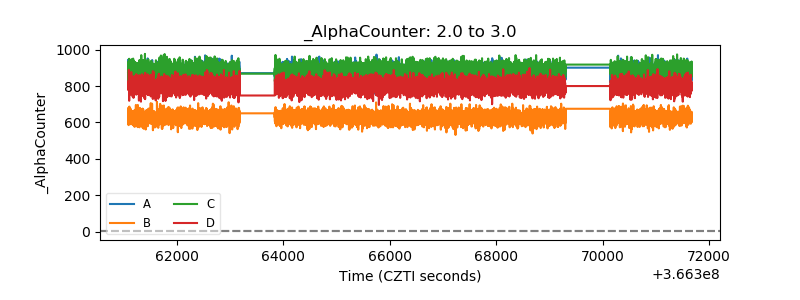 |
| _CPM_Rate | 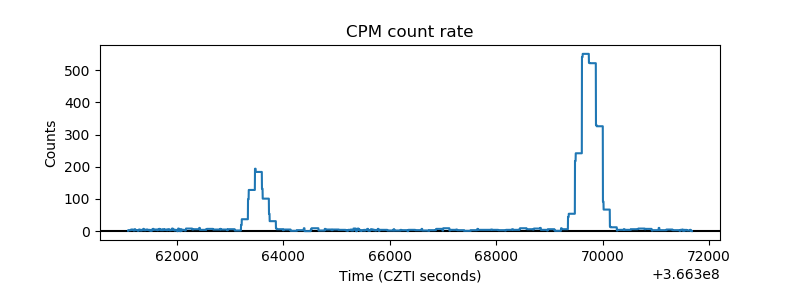 |
| CZT Counter | 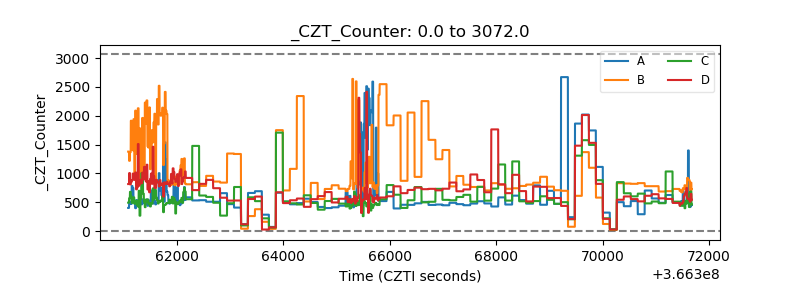 |
| +2.5 Volts monitor |  |
| +5 Volts monitor | 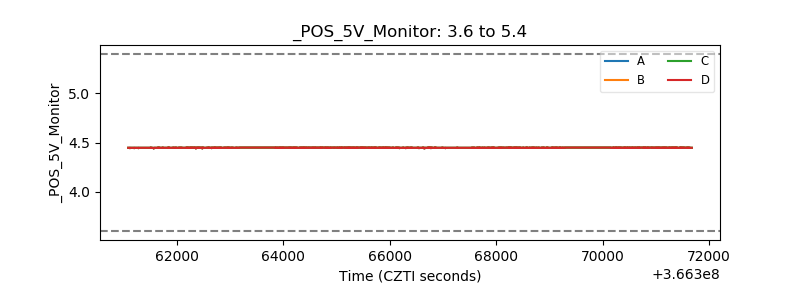 |
| _ROLL_ROT | 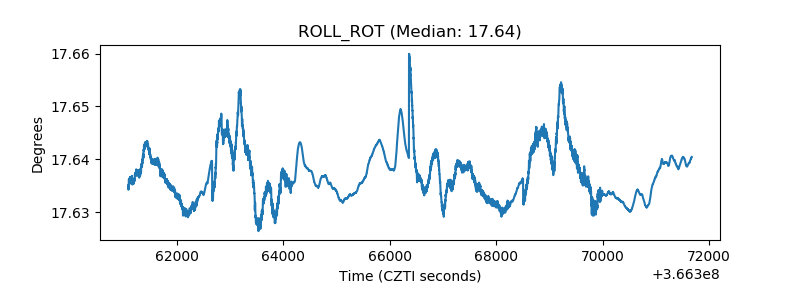 |
| _Roll_DEC | 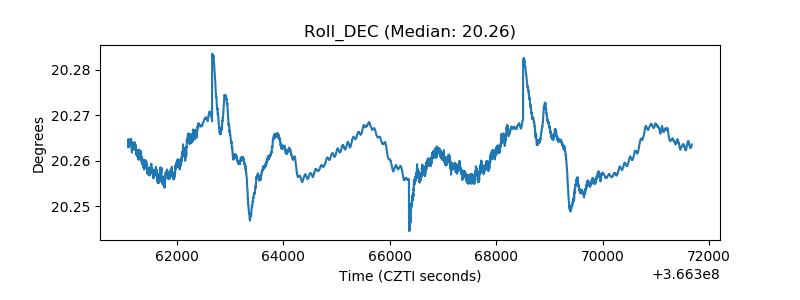 |
| _Roll_RA | 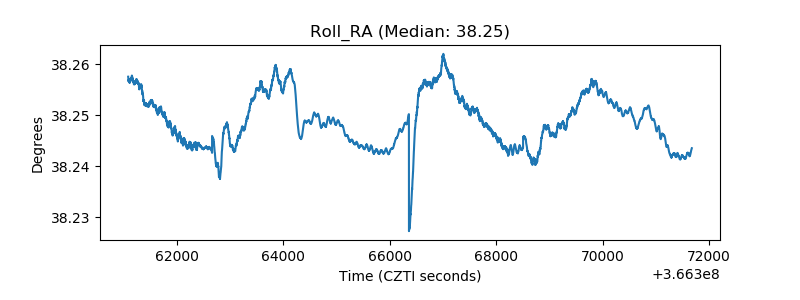 |
| Veto Counter | 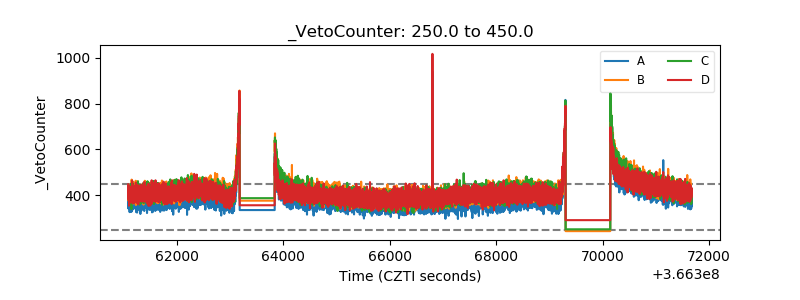 |