| Param | Original file | Final file |
|---|---|---|
| Filename | modeM0/AS1T04_034T01_9000004632_31739cztM0_level2.evt | modeM0/AS1T04_034T01_9000004632_31739cztM0_level2_quad_clean.evt |
| Size (bytes) | 2,945,321,280 | 358,441,920 |
| Size | 2.7 GB | 341.8 MB |
| Events in quadrant A | 22,614,017 | 2,187,558 |
| Events in quadrant B | 28,090,009 | 2,249,639 |
| Events in quadrant C | 17,634,270 | 2,193,019 |
| Events in quadrant D | 18,871,180 | 2,187,868 |
| Mode M9 | |||
|---|---|---|---|
| Quadrant | BADHDUFLAG | Total packets | Discarded packets |
| A | 0 | 32 | 0 |
| B | 0 | 32 | 0 |
| C | 0 | 32 | 0 |
| D | 0 | 32 | 0 |
| Mode SS | |||
|---|---|---|---|
| Quadrant | BADHDUFLAG | Total packets | Discarded packets |
| A | 0 | 606 | 0 |
| B | 0 | 606 | 0 |
| C | 0 | 606 | 0 |
| D | 0 | 606 | 0 |
| Mode M0 | |||
|---|---|---|---|
| Quadrant | BADHDUFLAG | Total packets | Discarded packets |
| A | 0 | 86171 | 5 |
| B | 0 | 104925 | 5 |
| C | 0 | 70947 | 5 |
| D | 0 | 75990 | 5 |
| Quadrant | Total seconds | Saturated seconds | Saturation percentage |
|---|---|---|---|
| A | 29626 | 2873 | 9.697563% |
| B | 29627 | 2488 | 8.397745% |
| C | 29627 | 1110 | 3.746583% |
| D | 29627 | 342 | 1.154352% |
Noise dominated data is calculated using 1-second bins in cleaned event files. If a bin has >2000 counts, and if more than 50% of those come from <1% of pixels, then it is considered to be noise-dominated and hence unusable.
| Quadrant | # 1 sec bins | Bins with >0 counts | Bins with >2000 counts | High rate bins dominated by noise | Noise dominated (total time) | Noise dominated (detector-on time) | Marked lightcurve |
|---|---|---|---|---|---|---|---|
| A | 32856 | 29631 | 2001 | 2001 | 6.09% | 6.75% | 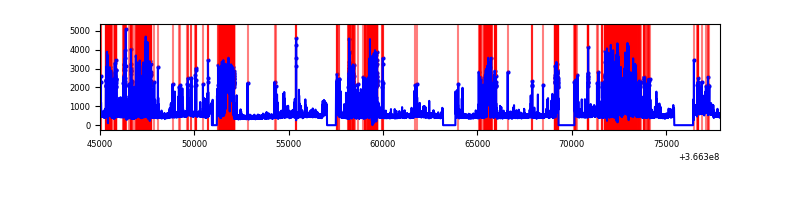 |
| B | 32857 | 29632 | 1083 | 1083 | 3.30% | 3.65% | 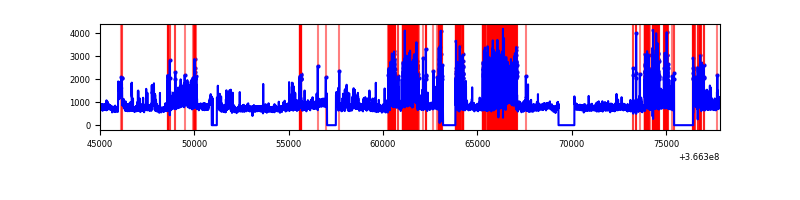 |
| C | 32857 | 29632 | 413 | 413 | 1.26% | 1.39% | 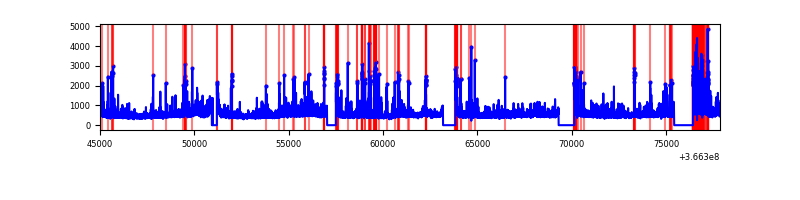 |
| D | 32857 | 29632 | 144 | 144 | 0.44% | 0.49% | 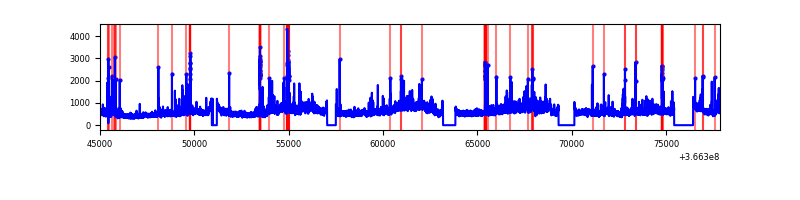 |
Top three noisy pixels from each quadrant. If the there are fewer than three noisy pixels in the level2.evt file, extra rows are filled as -1
| Pixel properties | Quadrant properties | ||||||
|---|---|---|---|---|---|---|---|
| Quadrant | DetID | PixID | Counts | Sigma | Mean | Median | Sigma |
| A | 0 | 13 | 9042710 | 12886.12 | 3513 | 3443 | 701.5 |
| A | 13 | 254 | 49691 | 65.93 | 3513 | 3443 | 701.5 |
| A | 3 | 137 | 36340 | 46.9 | 3513 | 3443 | 701.5 |
| B | 6 | 159 | 7748948 | 11463.11 | 3513 | 3418 | 675.7 |
| B | 5 | 255 | 3894829 | 5759.15 | 3513 | 3418 | 675.7 |
| B | 4 | 80 | 2194393 | 3242.57 | 3513 | 3418 | 675.7 |
| C | 0 | 10 | 3054272 | 3757.4 | 3457 | 3474 | 811.9 |
| C | 14 | 238 | 558105 | 683.09 | 3457 | 3474 | 811.9 |
| C | 14 | 225 | 209742 | 254.04 | 3457 | 3474 | 811.9 |
| D | 8 | 195 | 4595500 | 5521.97 | 3528 | 3439 | 831.6 |
| D | 12 | 233 | 682891 | 817.04 | 3528 | 3439 | 831.6 |
| D | 2 | 250 | 160967 | 189.43 | 3528 | 3439 | 831.6 |
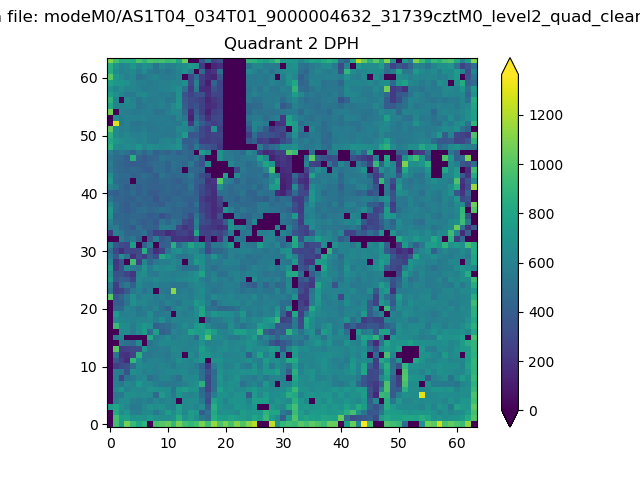
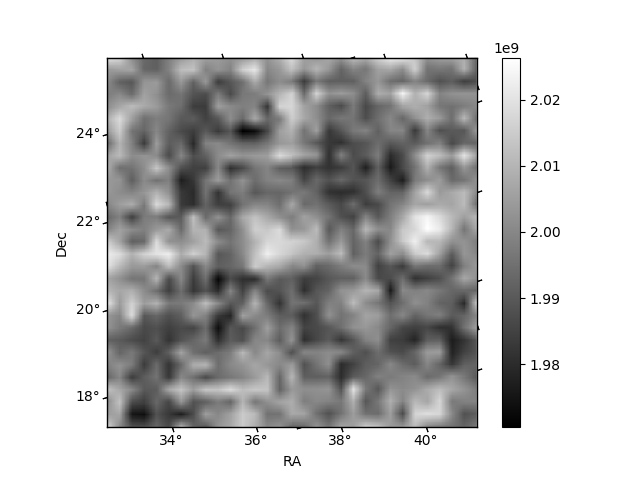
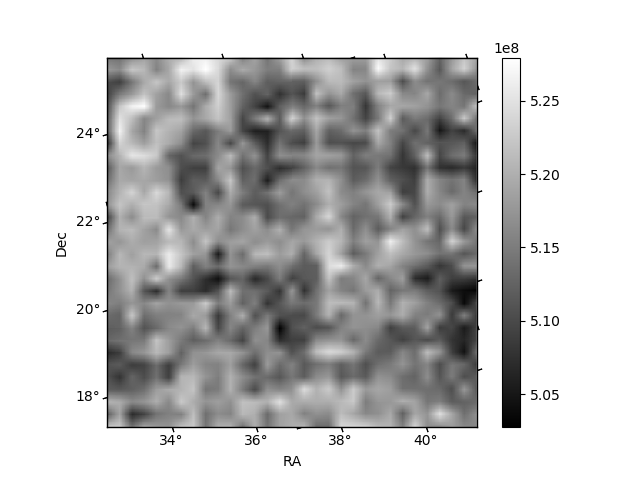
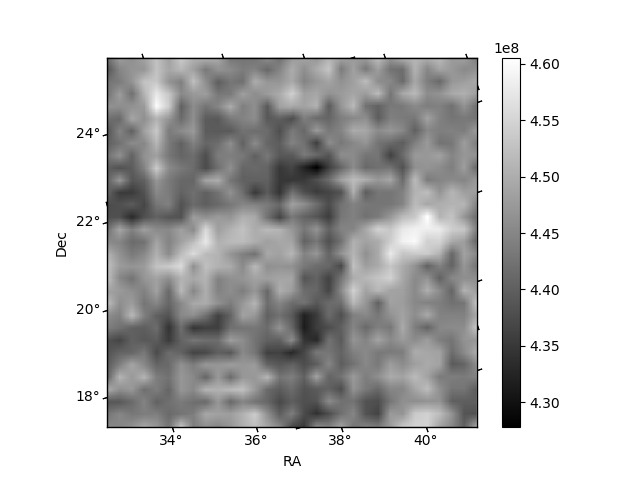
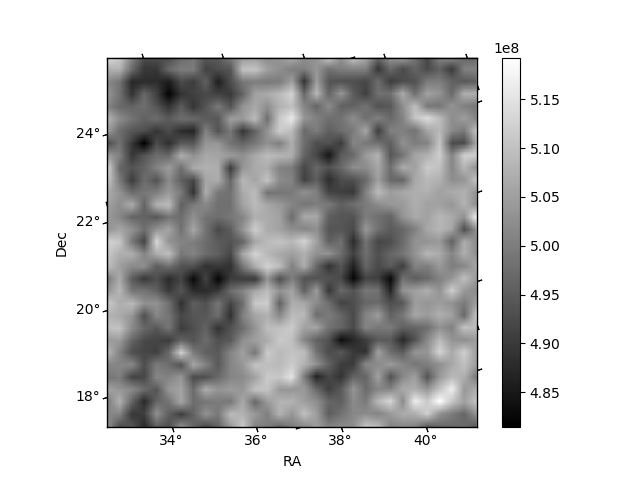
Histogram calculated using DETX and DETY for each event in the final _common_clean file
| Quadrant A | 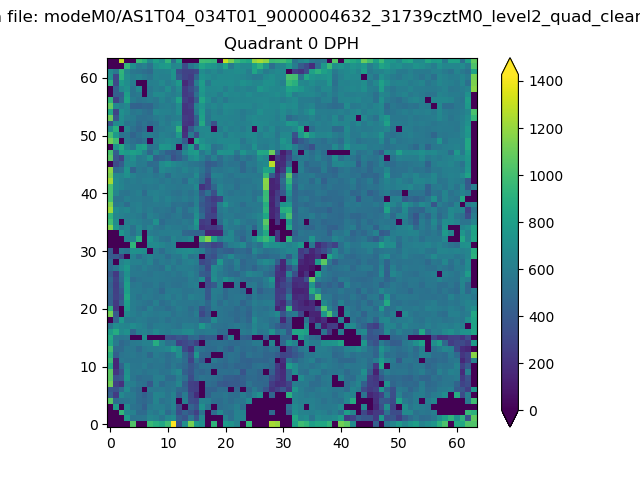 |
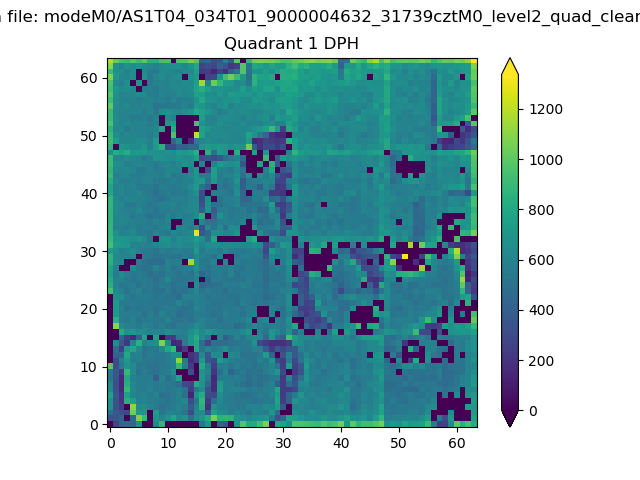 |
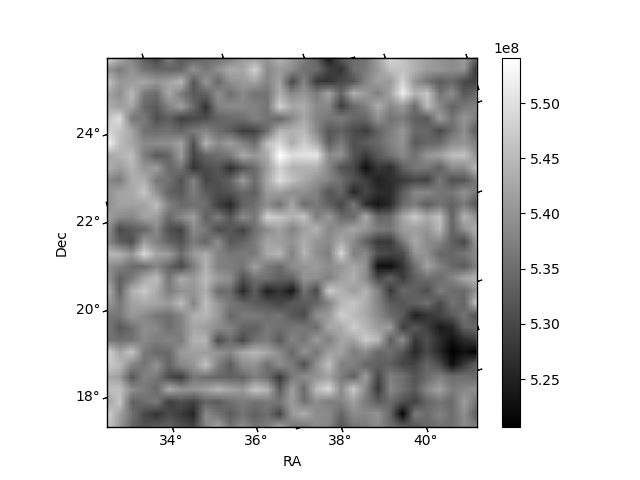
Quadrant B |
|---|---|---|---|
| Quadrant D | 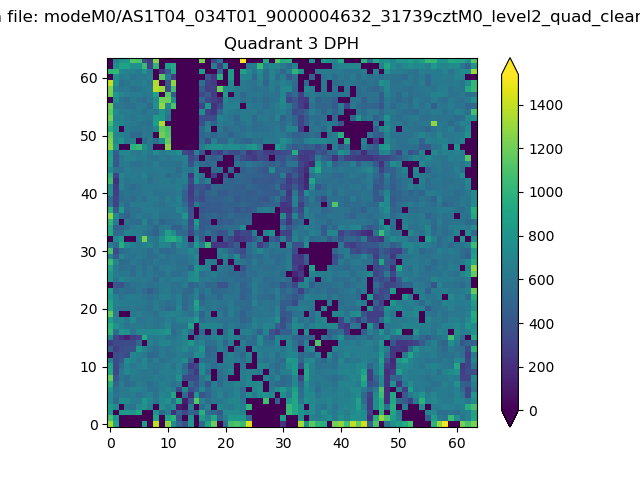 |
 |
Quadrant C |
| Plot type | Count rate plots | Images |
|---|---|---|
| Comparison with Poisson distribution Blue bars denote a histogram of data divided into 1 sec bins. Red curve is a Poisson curve with rate = median count rate of data. |
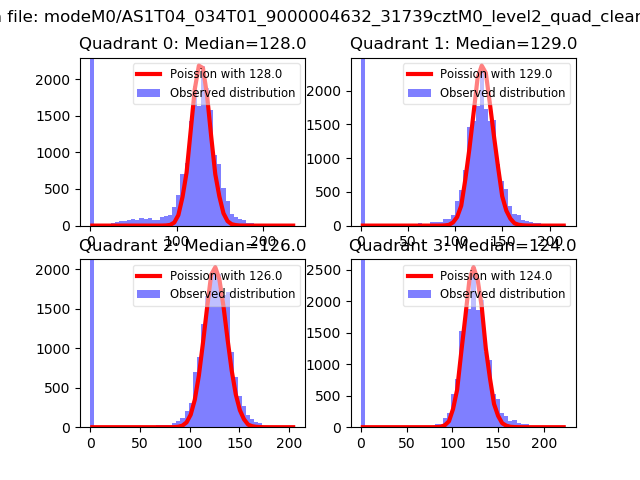 |
 |
| Quadrant-wise count rates Data is divided into 100 sec bins |
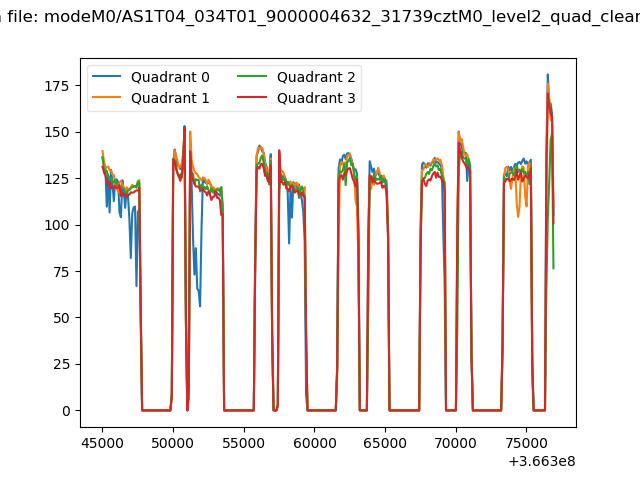 |
|
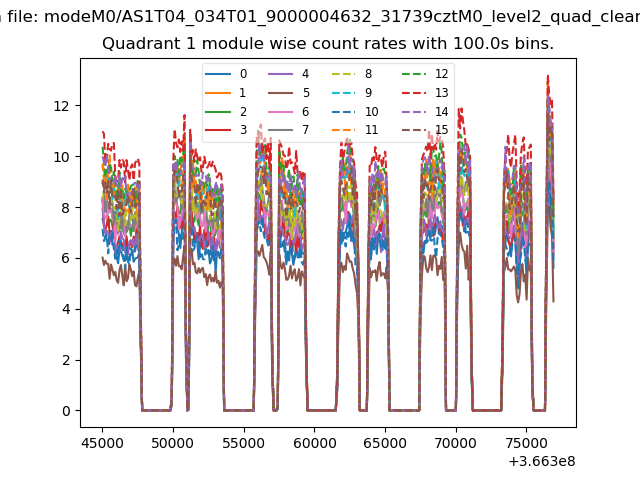
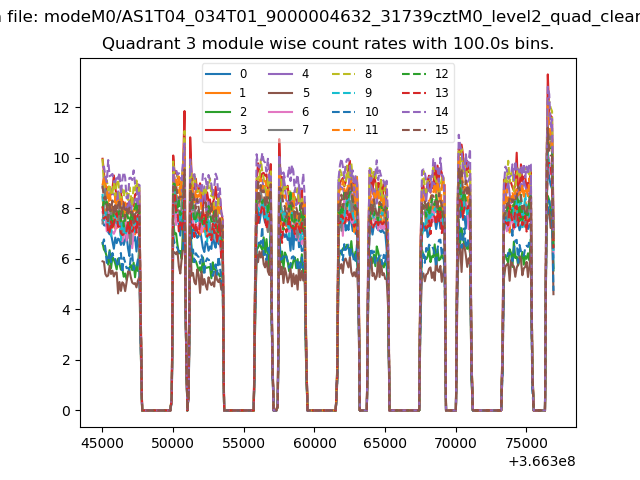
| Module-wise count rates for Quadrant A Data is divided into 100 sec bins |
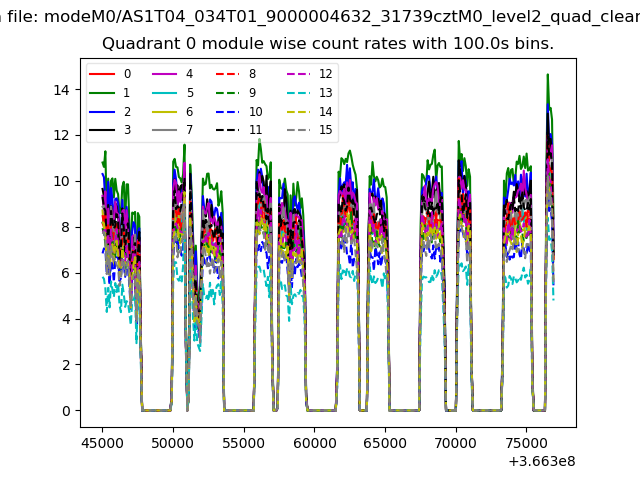 |
 |
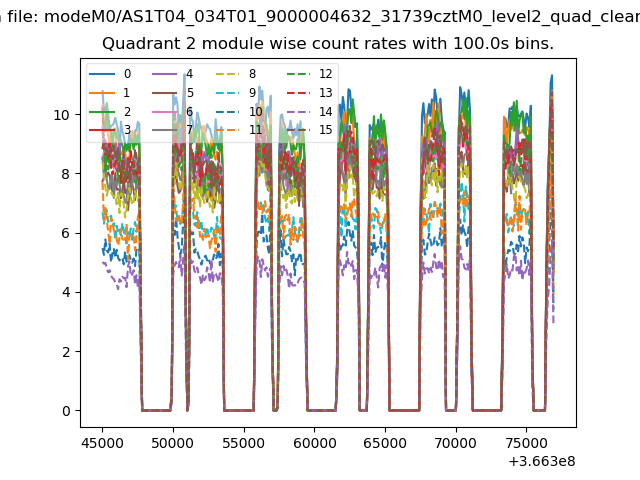
| Module-wise count rates for Quadrant B Data is divided into 100 sec bins |
 |
 |
| Module-wise count rates for Quadrant C Data is divided into 100 sec bins |
 |
 |
| Module-wise count rates for Quadrant D Data is divided into 100 sec bins |
 |
 |
| Parameter | Plot |
|---|---|
| CZT HV Monitor | 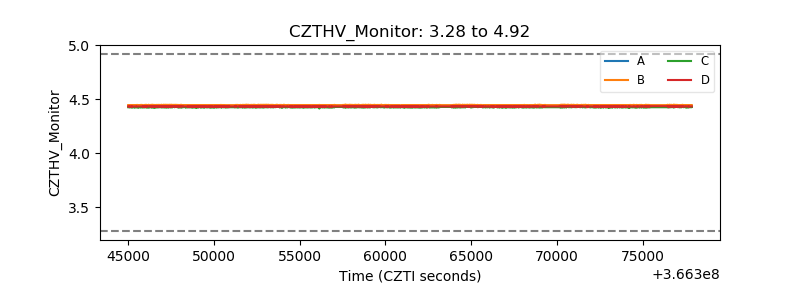 |
| D_VDD | 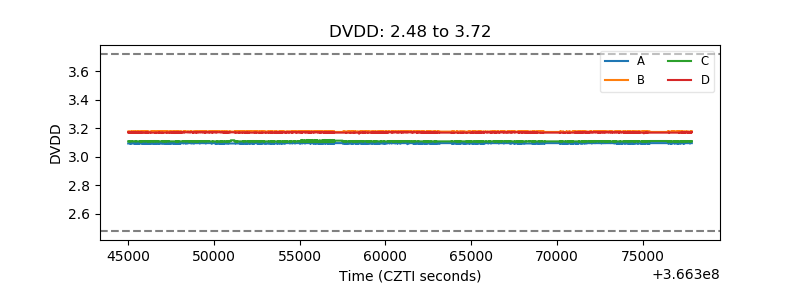 |
| Temperature 1 | 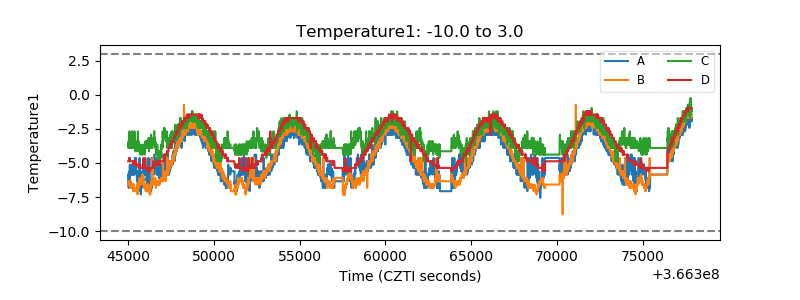 |
| Veto HV Monitor | 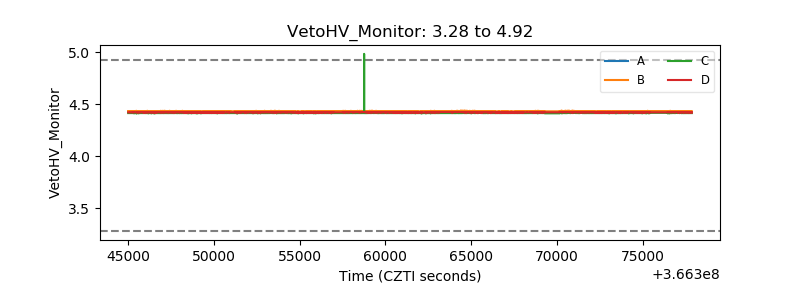 |
| Veto LLD | 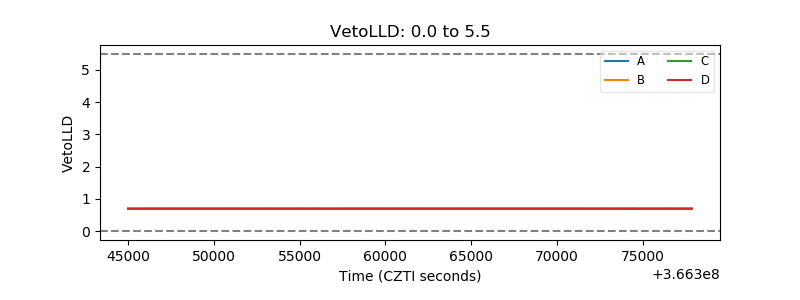 |
| Alpha Counter | 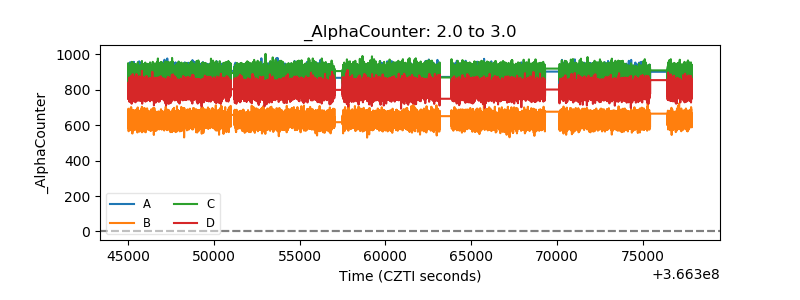 |
| _CPM_Rate | 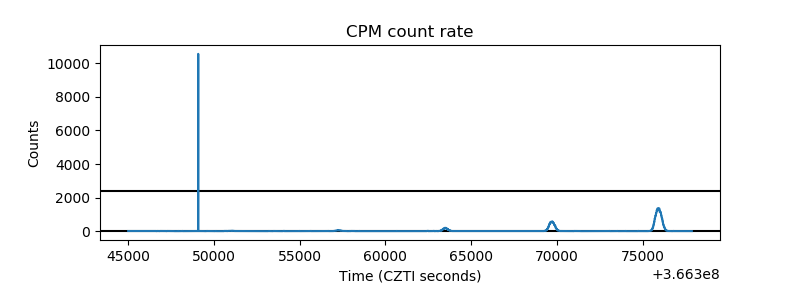 |
| CZT Counter | 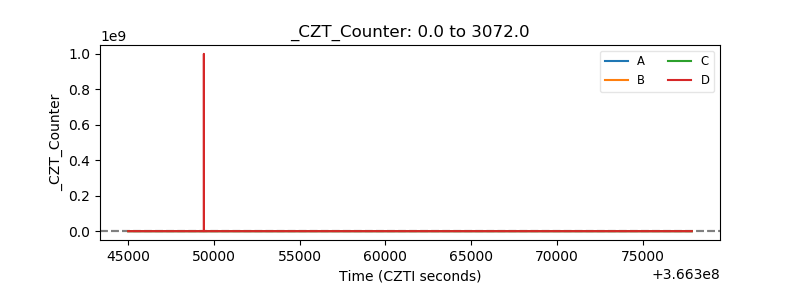 |
| +2.5 Volts monitor |  |
| +5 Volts monitor |  |
| _ROLL_ROT | 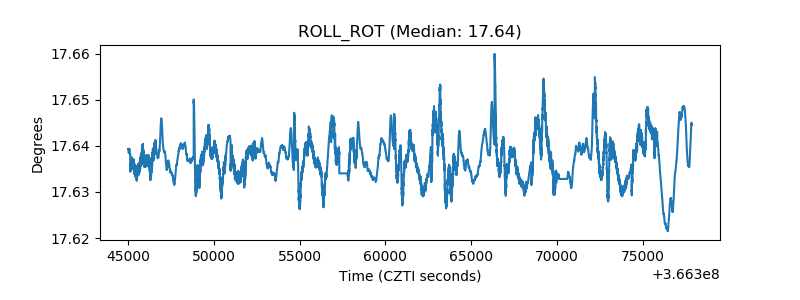 |
| _Roll_DEC | 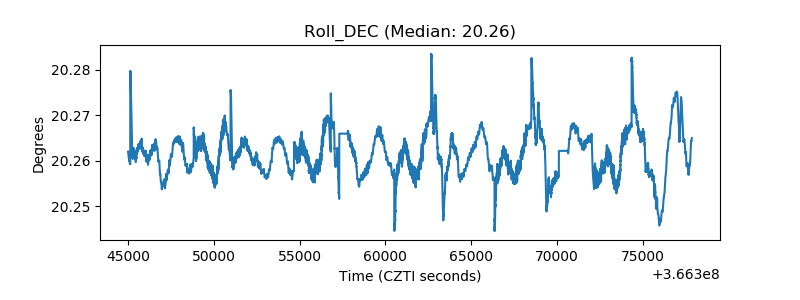 |
| _Roll_RA | 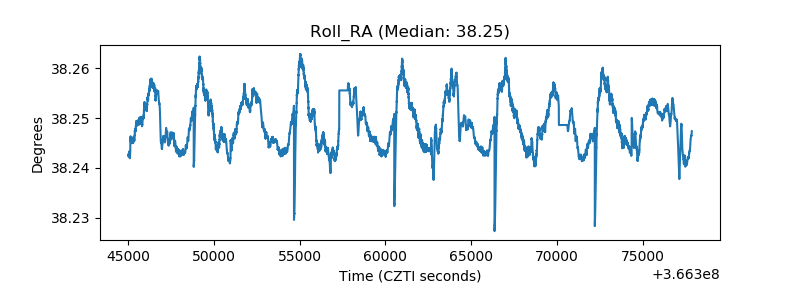 |
| Veto Counter | 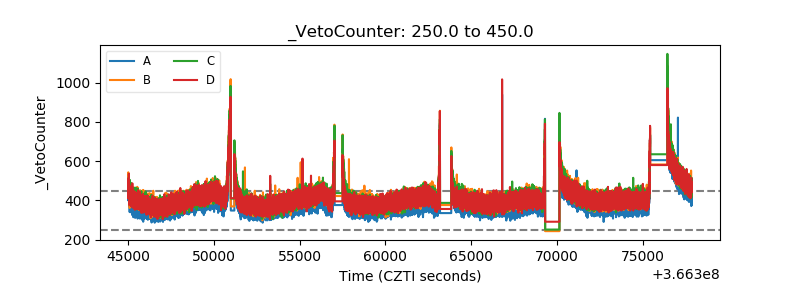 |