| Param | Original file | Final file |
|---|---|---|
| Filename | modeM0/AS1T04_034T01_9000004632_31742cztM0_level2.evt | modeM0/AS1T04_034T01_9000004632_31742cztM0_level2_quad_clean.evt |
| Size (bytes) | 673,545,600 | 63,849,600 |
| Size | 642.3 MB | 60.9 MB |
| Events in quadrant A | 5,045,089 | 380,829 |
| Events in quadrant B | 5,840,237 | 381,611 |
| Events in quadrant C | 4,377,683 | 370,486 |
| Events in quadrant D | 4,717,128 | 367,122 |
| Mode M9 | |||
|---|---|---|---|
| Quadrant | BADHDUFLAG | Total packets | Discarded packets |
| A | 0 | 13 | 0 |
| B | 0 | 13 | 0 |
| C | 0 | 13 | 0 |
| D | 0 | 13 | 0 |
| Mode SS | |||
|---|---|---|---|
| Quadrant | BADHDUFLAG | Total packets | Discarded packets |
| A | 0 | 126 | 0 |
| B | 0 | 126 | 0 |
| C | 0 | 126 | 0 |
| D | 0 | 126 | 0 |
| Mode M0 | |||
|---|---|---|---|
| Quadrant | BADHDUFLAG | Total packets | Discarded packets |
| A | 0 | 19373 | 1 |
| B | 0 | 21553 | 1 |
| C | 0 | 17243 | 1 |
| D | 0 | 18484 | 1 |
| Quadrant | Total seconds | Saturated seconds | Saturation percentage |
|---|---|---|---|
| A | 6204 | 440 | 7.092199% |
| B | 6205 | 312 | 5.028203% |
| C | 6205 | 277 | 4.464142% |
| D | 6205 | 134 | 2.159549% |
Noise dominated data is calculated using 1-second bins in cleaned event files. If a bin has >2000 counts, and if more than 50% of those come from <1% of pixels, then it is considered to be noise-dominated and hence unusable.
| Quadrant | # 1 sec bins | Bins with >0 counts | Bins with >2000 counts | High rate bins dominated by noise | Noise dominated (total time) | Noise dominated (detector-on time) | Marked lightcurve |
|---|---|---|---|---|---|---|---|
| A | 7469 | 6205 | 260 | 260 | 3.48% | 4.19% |  |
| B | 7469 | 6205 | 109 | 109 | 1.46% | 1.76% | 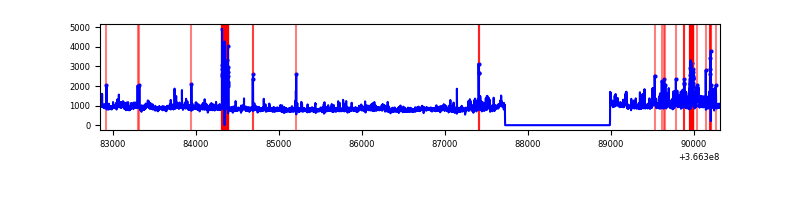 |
| C | 7469 | 6205 | 87 | 87 | 1.16% | 1.40% | 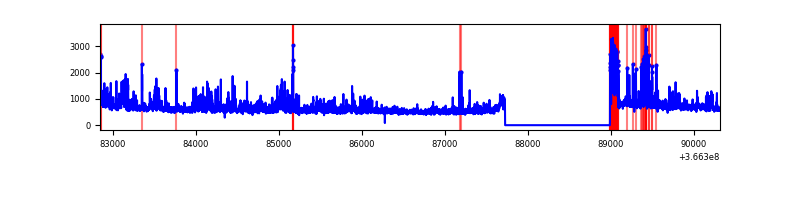 |
| D | 7470 | 6206 | 67 | 67 | 0.90% | 1.08% | 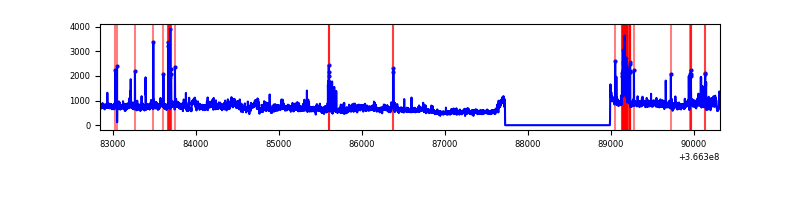 |
Top three noisy pixels from each quadrant. If the there are fewer than three noisy pixels in the level2.evt file, extra rows are filled as -1
| Pixel properties | Quadrant properties | ||||||
|---|---|---|---|---|---|---|---|
| Quadrant | DetID | PixID | Counts | Sigma | Mean | Median | Sigma |
| A | 0 | 13 | 1648040 | 9513.16 | 880 | 866 | 173.1 |
| A | 13 | 254 | 11153 | 59.41 | 880 | 866 | 173.1 |
| A | 3 | 137 | 7971 | 41.03 | 880 | 866 | 173.1 |
| B | 6 | 159 | 1652610 | 10227.79 | 867 | 847 | 161.5 |
| B | 5 | 255 | 267091 | 1648.59 | 867 | 847 | 161.5 |
| B | 4 | 80 | 228581 | 1410.14 | 867 | 847 | 161.5 |
| C | 0 | 10 | 882825 | 4593.1 | 839 | 849 | 192.0 |
| C | 14 | 238 | 138530 | 717.01 | 839 | 849 | 192.0 |
| C | 10 | 22 | 38932 | 198.33 | 839 | 849 | 192.0 |
| D | 8 | 195 | 1129106 | 5558.59 | 868 | 849 | 203.0 |
| D | 12 | 233 | 182368 | 894.29 | 868 | 849 | 203.0 |
| D | 1 | 52 | 85995 | 419.49 | 868 | 849 | 203.0 |
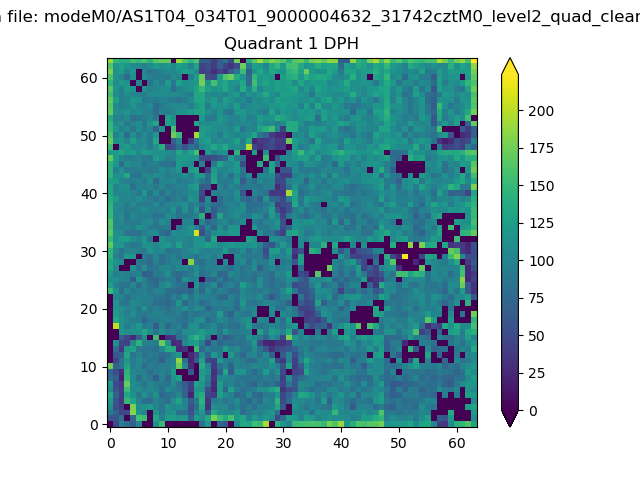
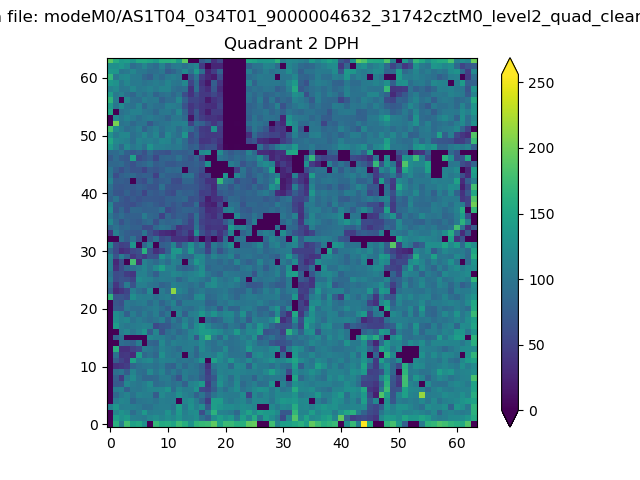
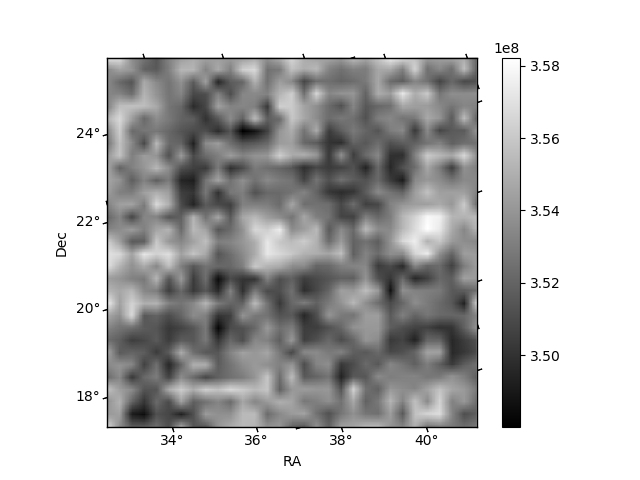
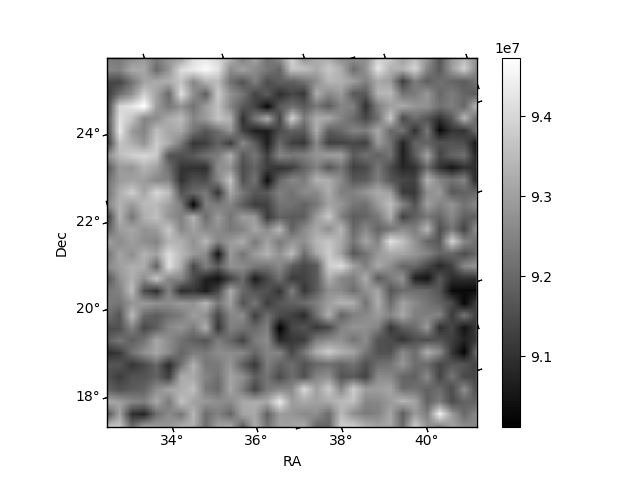
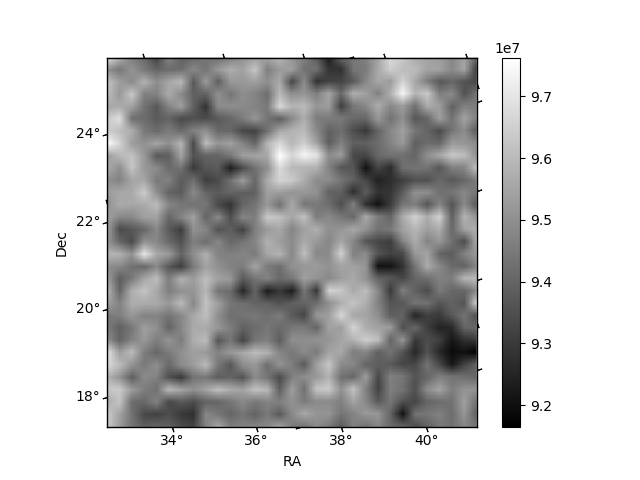
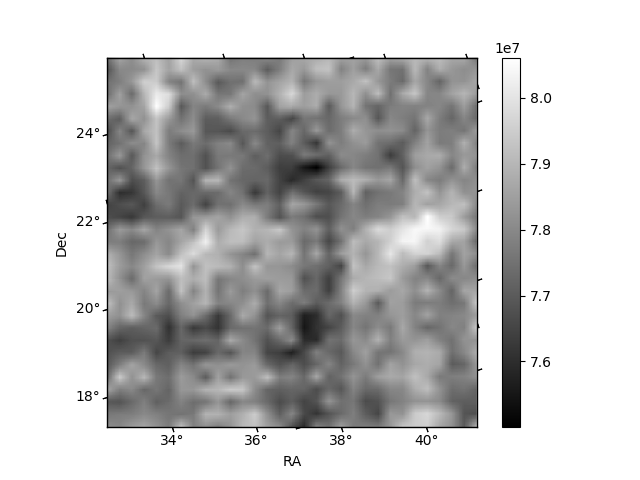
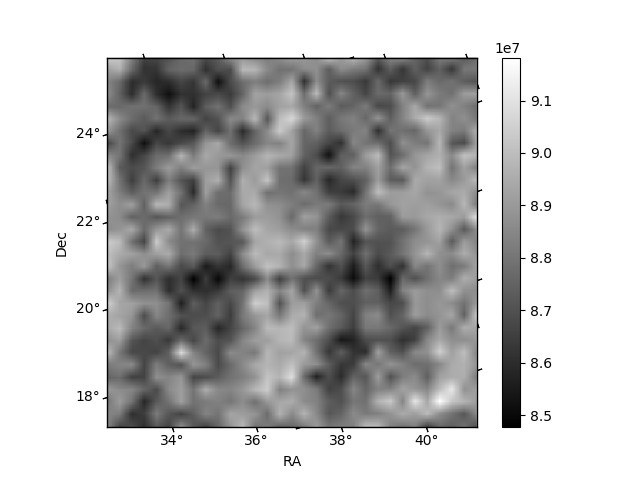
Histogram calculated using DETX and DETY for each event in the final _common_clean file
| Quadrant A | 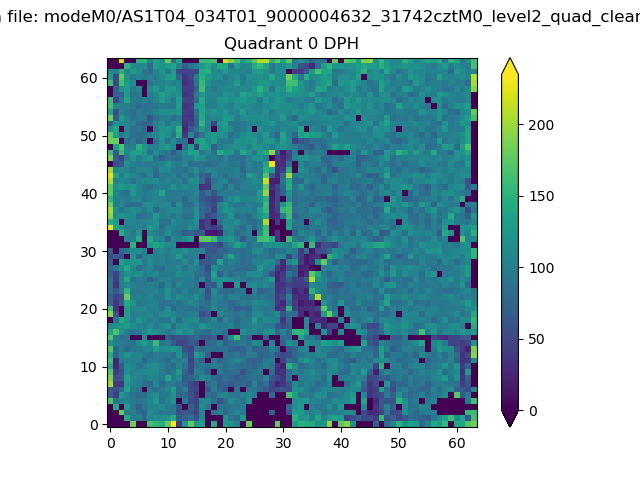 |
 |
Quadrant B |
|---|---|---|---|
| Quadrant D | 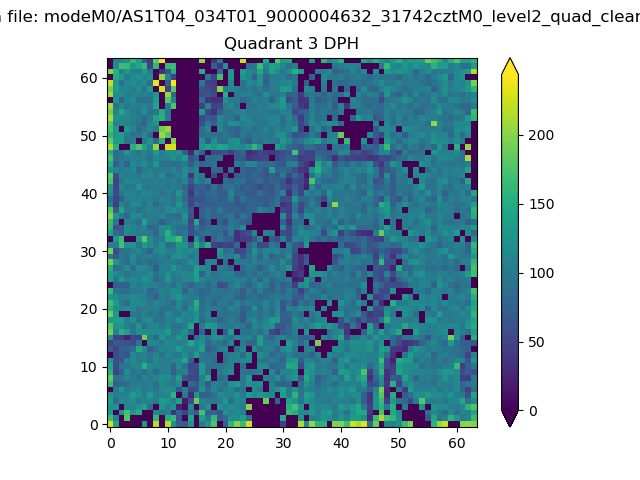 |
 |
Quadrant C |
| Plot type | Count rate plots | Images |
|---|---|---|
| Comparison with Poisson distribution Blue bars denote a histogram of data divided into 1 sec bins. Red curve is a Poisson curve with rate = median count rate of data. |
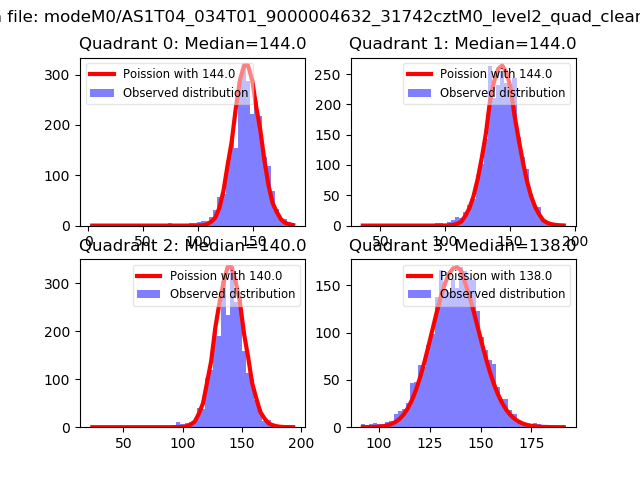 |
 |
| Quadrant-wise count rates Data is divided into 100 sec bins |
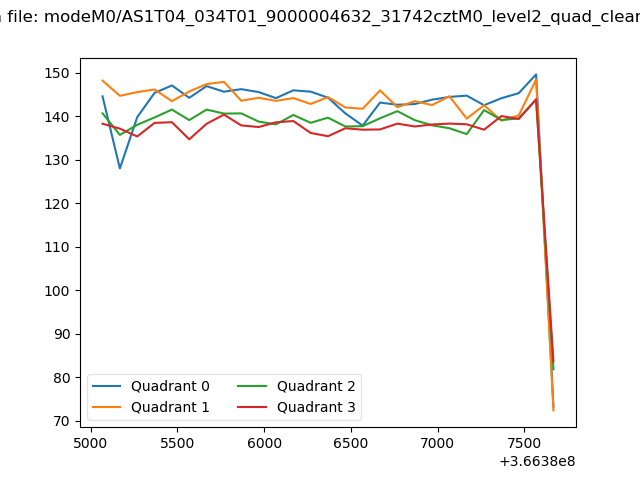 |
|
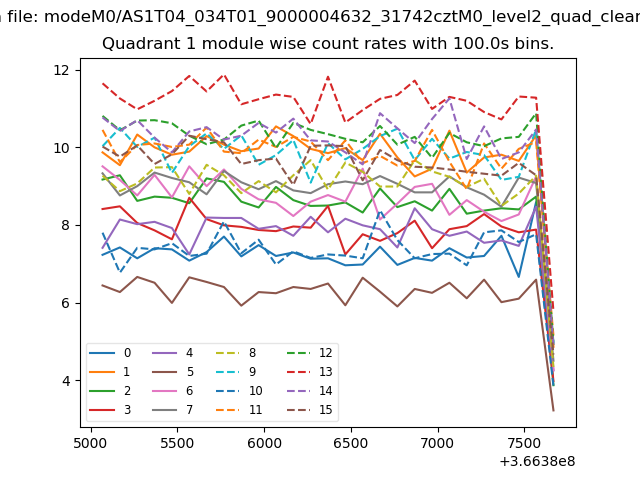
| Module-wise count rates for Quadrant A Data is divided into 100 sec bins |
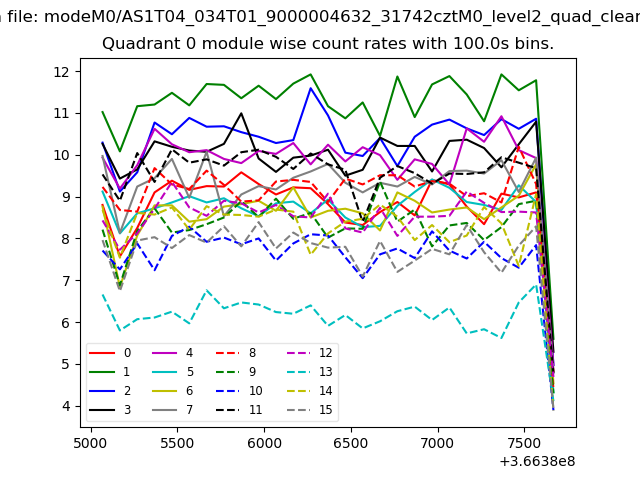 |
 |
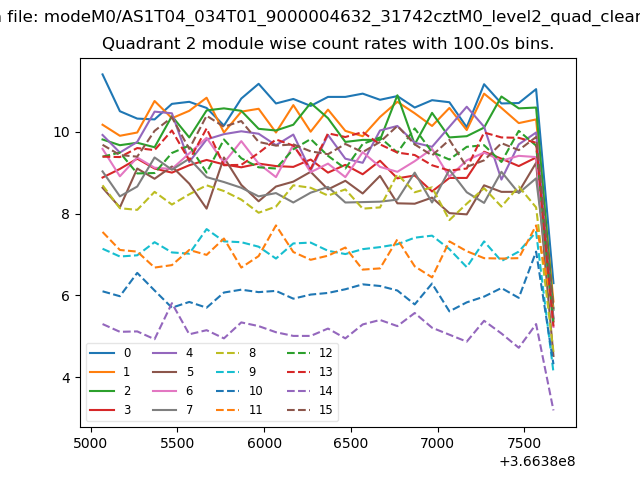
| Module-wise count rates for Quadrant B Data is divided into 100 sec bins |
 |
 |
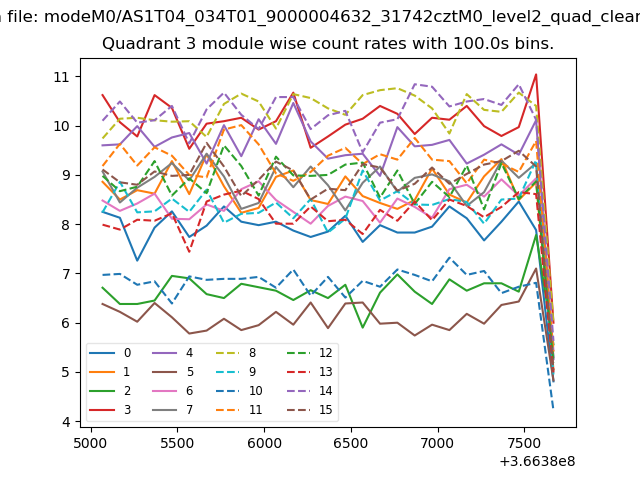
| Module-wise count rates for Quadrant C Data is divided into 100 sec bins |
 |
 |
| Module-wise count rates for Quadrant D Data is divided into 100 sec bins |
 |
 |
| Parameter | Plot |
|---|---|
| CZT HV Monitor |  |
| D_VDD | 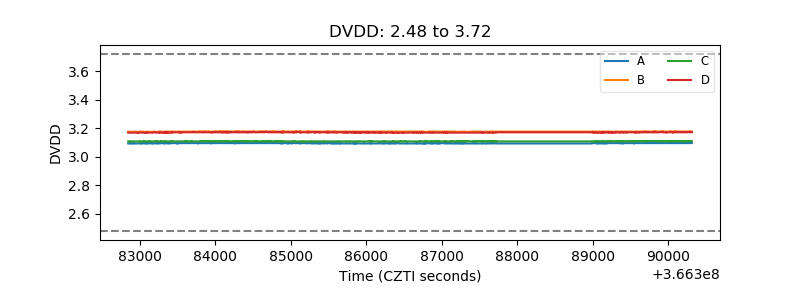 |
| Temperature 1 | 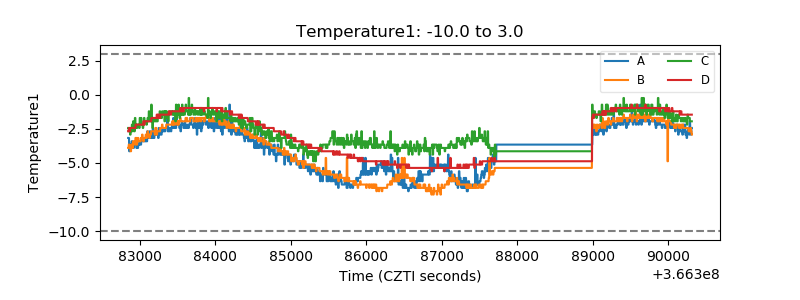 |
| Veto HV Monitor | 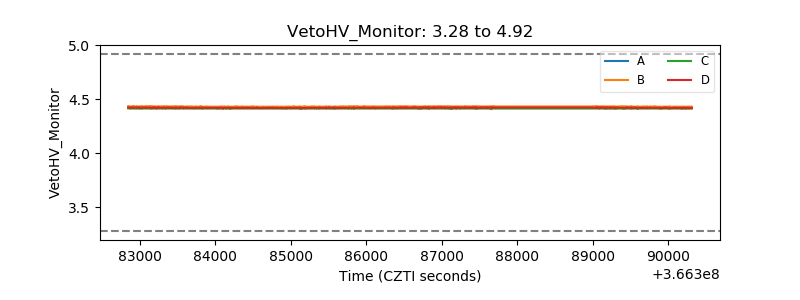 |
| Veto LLD | 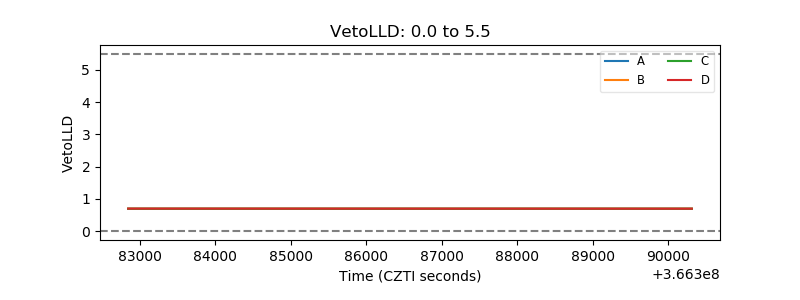 |
| Alpha Counter | 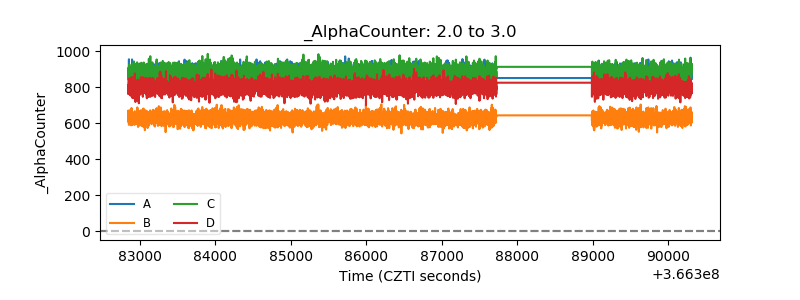 |
| _CPM_Rate | 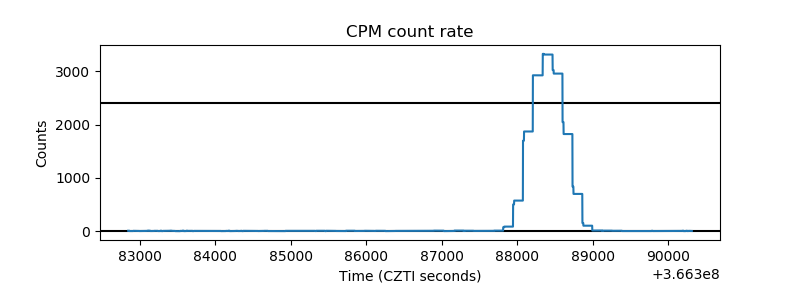 |
| CZT Counter | 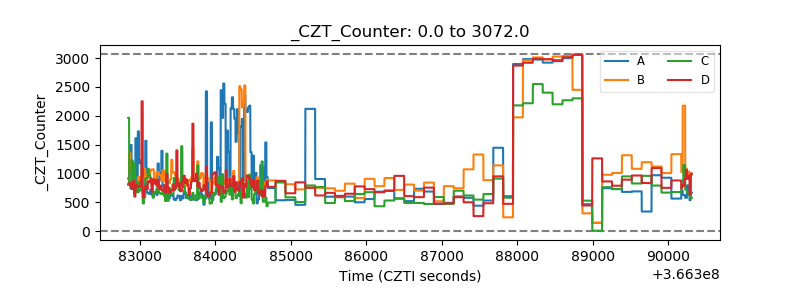 |
| +2.5 Volts monitor |  |
| +5 Volts monitor | 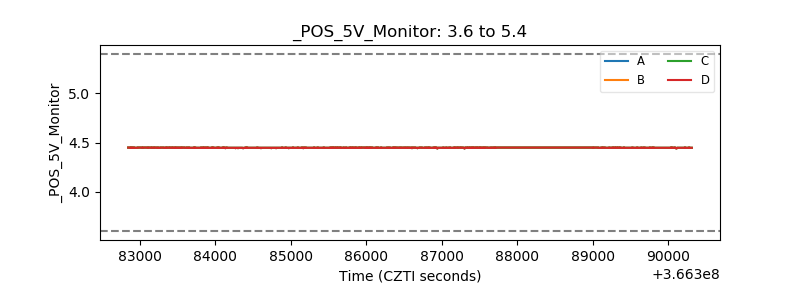 |
| _ROLL_ROT | 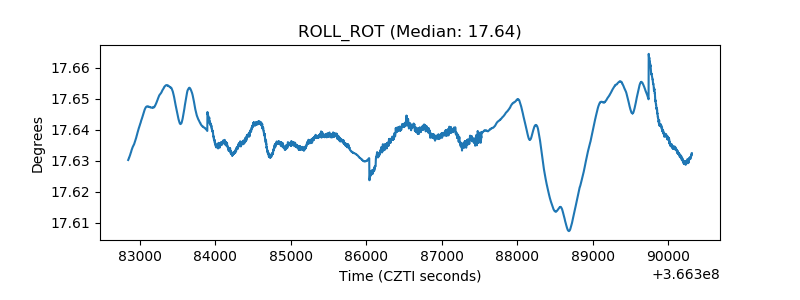 |
| _Roll_DEC |  |
| _Roll_RA | 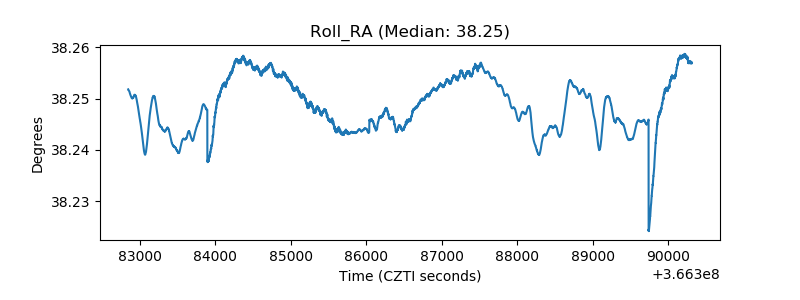 |
| Veto Counter | 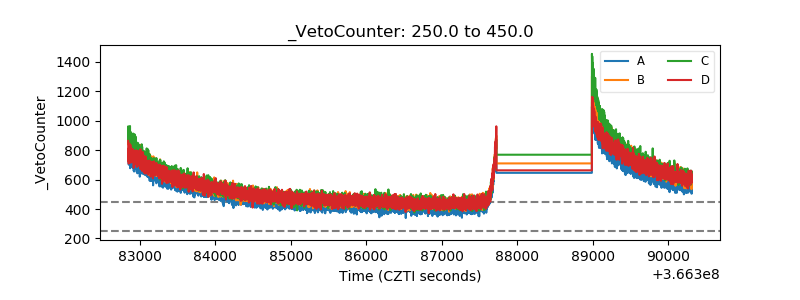 |