| Param | Original file | Final file |
|---|---|---|
| Filename | modeM0/AS1T04_034T01_9000004632_31746cztM0_level2.evt | modeM0/AS1T04_034T01_9000004632_31746cztM0_level2_quad_clean.evt |
| Size (bytes) | 745,646,400 | 98,311,680 |
| Size | 711.1 MB | 93.8 MB |
| Events in quadrant A | 7,060,845 | 594,857 |
| Events in quadrant B | 6,192,973 | 657,099 |
| Events in quadrant C | 4,444,805 | 643,497 |
| Events in quadrant D | 4,446,327 | 629,396 |
| Mode M9 | |||
|---|---|---|---|
| Quadrant | BADHDUFLAG | Total packets | Discarded packets |
| A | 0 | 12 | 0 |
| B | 0 | 13 | 0 |
| C | 0 | 13 | 0 |
| D | 0 | 13 | 0 |
| Mode SS | |||
|---|---|---|---|
| Quadrant | BADHDUFLAG | Total packets | Discarded packets |
| A | 0 | 134 | 0 |
| B | 0 | 134 | 0 |
| C | 0 | 134 | 0 |
| D | 0 | 134 | 0 |
| Mode M0 | |||
|---|---|---|---|
| Quadrant | BADHDUFLAG | Total packets | Discarded packets |
| A | 0 | 25408 | 2 |
| B | 0 | 22660 | 2 |
| C | 0 | 17496 | 2 |
| D | 0 | 17730 | 2 |
| Quadrant | Total seconds | Saturated seconds | Saturation percentage |
|---|---|---|---|
| A | 6474 | 1261 | 19.477912% |
| B | 6474 | 309 | 4.772938% |
| C | 6474 | 365 | 5.637936% |
| D | 6474 | 137 | 2.116157% |
Noise dominated data is calculated using 1-second bins in cleaned event files. If a bin has >2000 counts, and if more than 50% of those come from <1% of pixels, then it is considered to be noise-dominated and hence unusable.
| Quadrant | # 1 sec bins | Bins with >0 counts | Bins with >2000 counts | High rate bins dominated by noise | Noise dominated (total time) | Noise dominated (detector-on time) | Marked lightcurve |
|---|---|---|---|---|---|---|---|
| A | 7559 | 6475 | 802 | 802 | 10.61% | 12.39% | 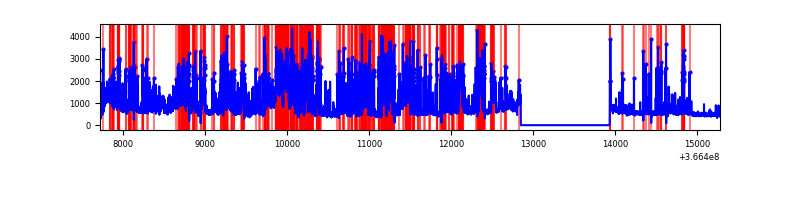 |
| B | 7559 | 6475 | 41 | 41 | 0.54% | 0.63% | 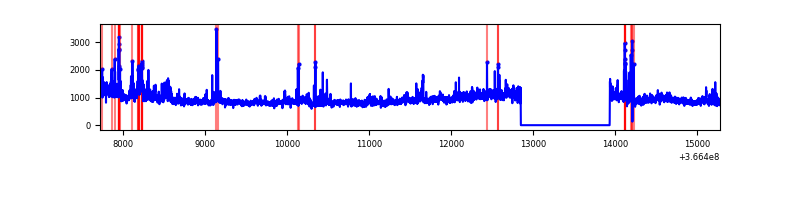 |
| C | 7559 | 6475 | 140 | 140 | 1.85% | 2.16% | 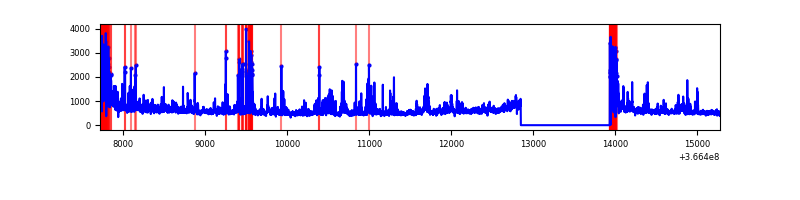 |
| D | 7559 | 6475 | 53 | 53 | 0.70% | 0.82% | 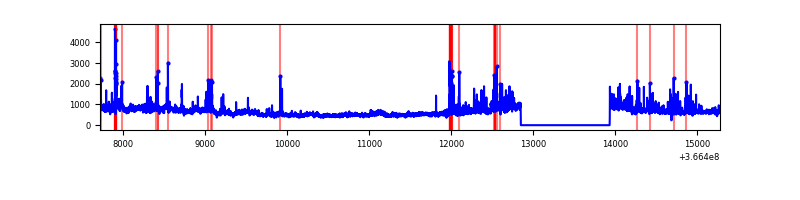 |
Top three noisy pixels from each quadrant. If the there are fewer than three noisy pixels in the level2.evt file, extra rows are filled as -1
| Pixel properties | Quadrant properties | ||||||
|---|---|---|---|---|---|---|---|
| Quadrant | DetID | PixID | Counts | Sigma | Mean | Median | Sigma |
| A | 0 | 13 | 3995637 | 25173.62 | 794 | 779 | 158.7 |
| A | 13 | 254 | 10806 | 63.19 | 794 | 779 | 158.7 |
| A | 3 | 137 | 7881 | 44.75 | 794 | 779 | 158.7 |
| B | 6 | 159 | 1778471 | 11178.39 | 842 | 823 | 159.0 |
| B | 4 | 80 | 897709 | 5639.89 | 842 | 823 | 159.0 |
| B | 5 | 172 | 69348 | 430.91 | 842 | 823 | 159.0 |
| C | 0 | 10 | 1041823 | 5553.05 | 812 | 820 | 187.5 |
| C | 14 | 238 | 131519 | 697.19 | 812 | 820 | 187.5 |
| C | 3 | 233 | 50411 | 264.53 | 812 | 820 | 187.5 |
| D | 8 | 195 | 815987 | 4137.23 | 836 | 817 | 197.0 |
| D | 12 | 233 | 207599 | 1049.48 | 836 | 817 | 197.0 |
| D | 1 | 52 | 151594 | 765.24 | 836 | 817 | 197.0 |
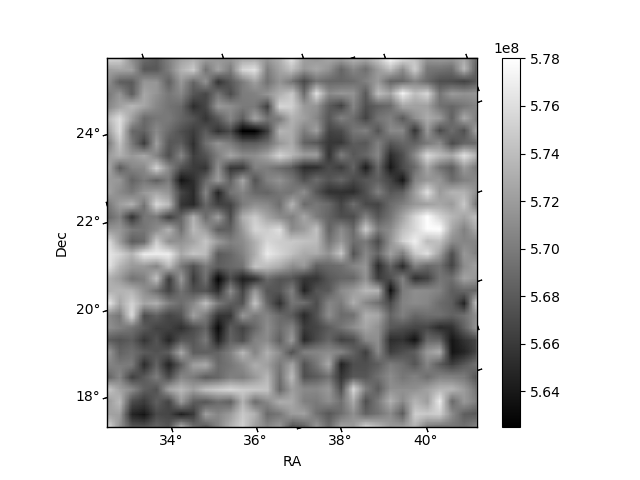
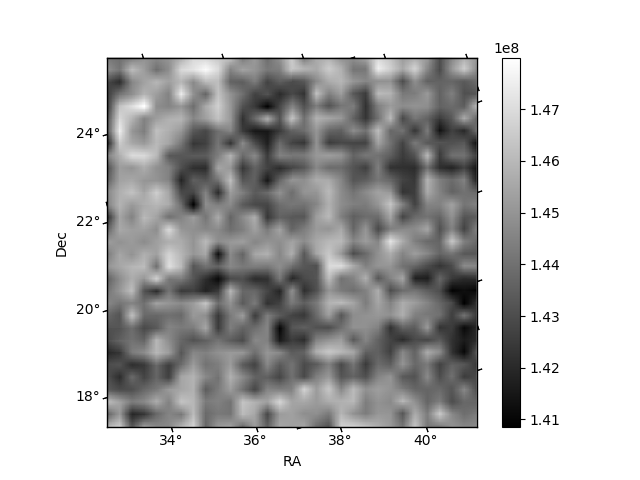
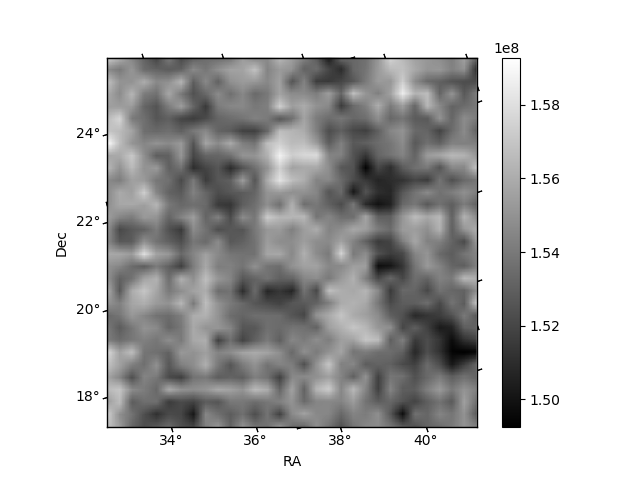
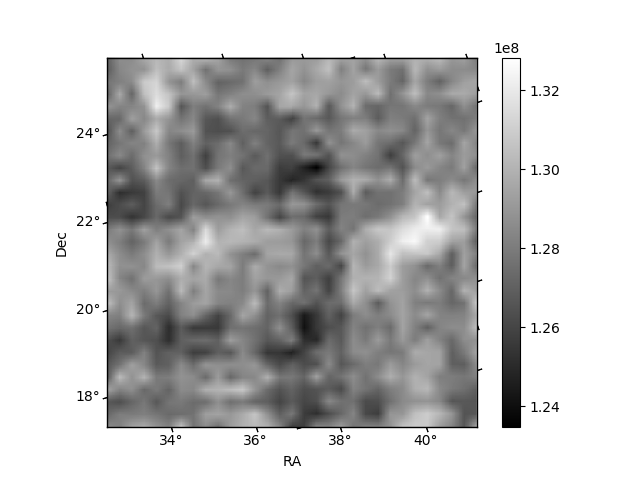
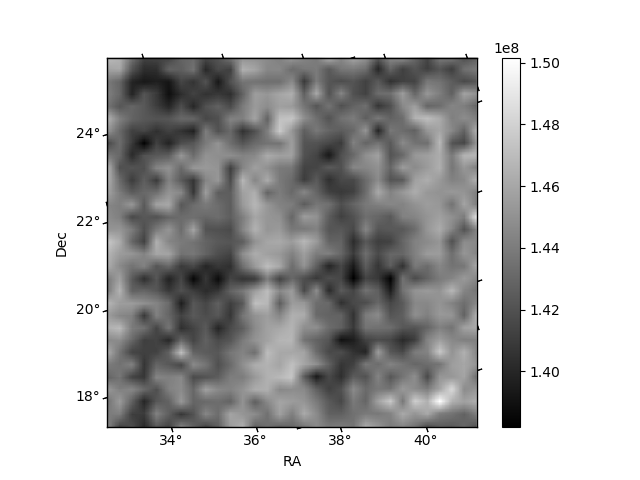
Histogram calculated using DETX and DETY for each event in the final _common_clean file
| Quadrant A | 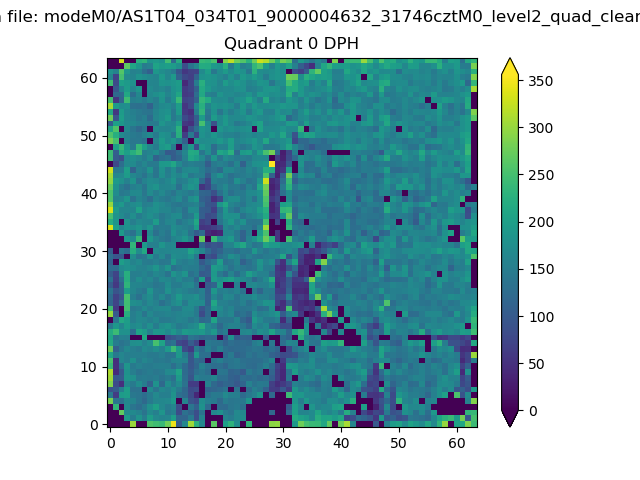 |
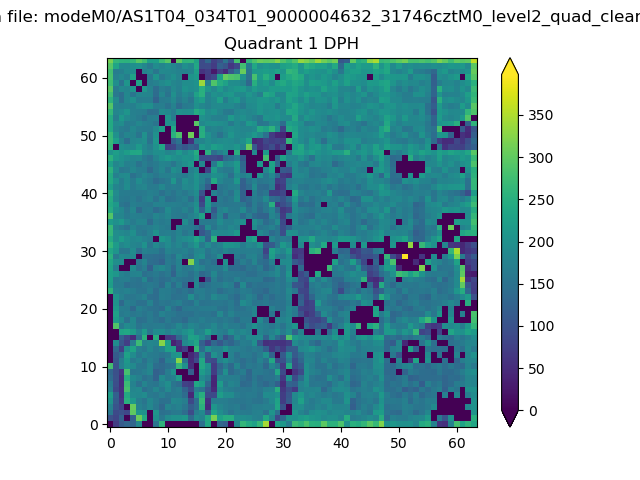 |
Quadrant B |
|---|---|---|---|
| Quadrant D | 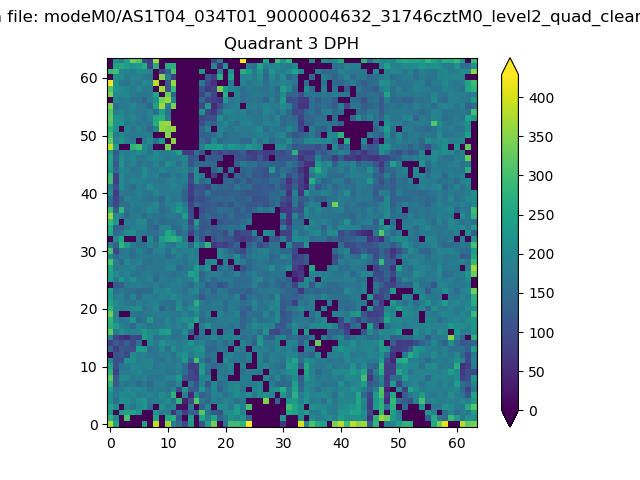 |
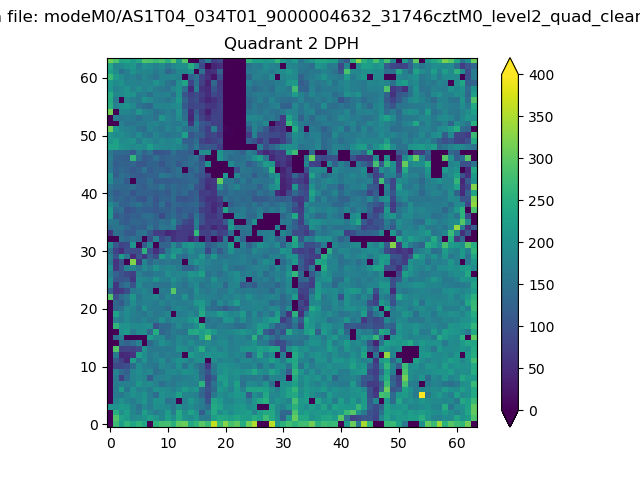 |
Quadrant C |
| Plot type | Count rate plots | Images |
|---|---|---|
| Comparison with Poisson distribution Blue bars denote a histogram of data divided into 1 sec bins. Red curve is a Poisson curve with rate = median count rate of data. |
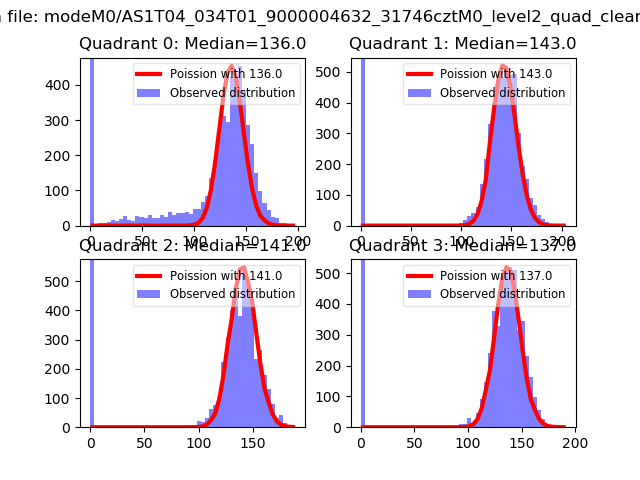 |
 |
| Quadrant-wise count rates Data is divided into 100 sec bins |
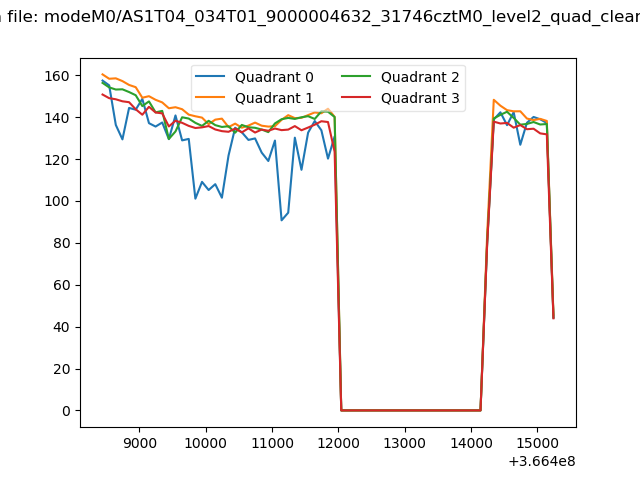 |
|
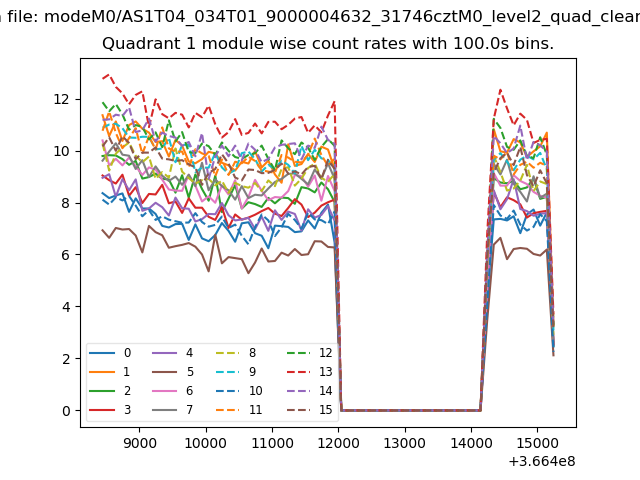
| Module-wise count rates for Quadrant A Data is divided into 100 sec bins |
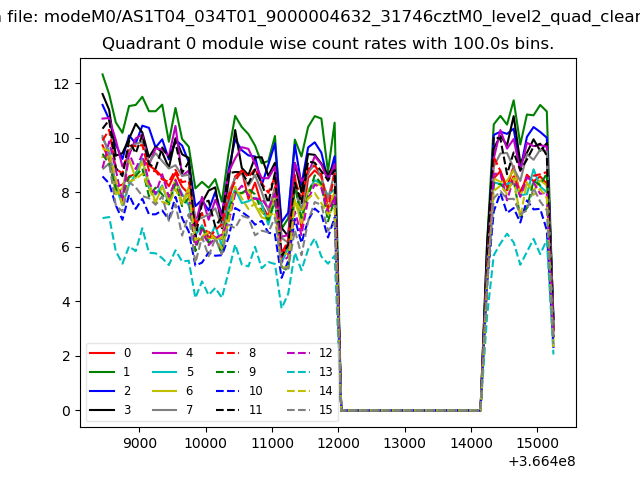 |
 |
| Module-wise count rates for Quadrant B Data is divided into 100 sec bins |
 |
 |
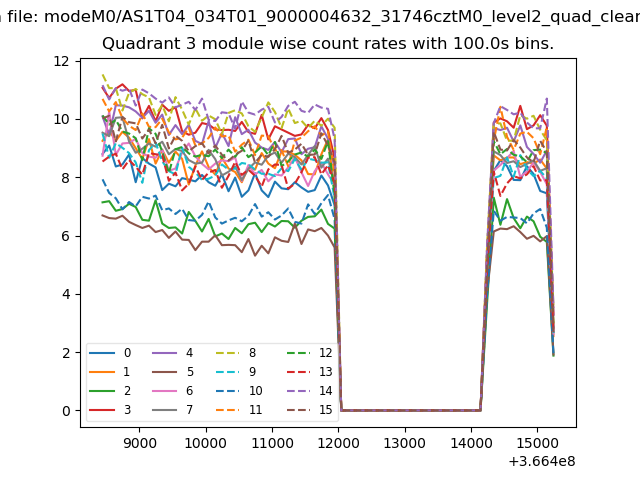
| Module-wise count rates for Quadrant C Data is divided into 100 sec bins |
 |
 |
| Module-wise count rates for Quadrant D Data is divided into 100 sec bins |
 |
 |
| Parameter | Plot |
|---|---|
| CZT HV Monitor |  |
| D_VDD | 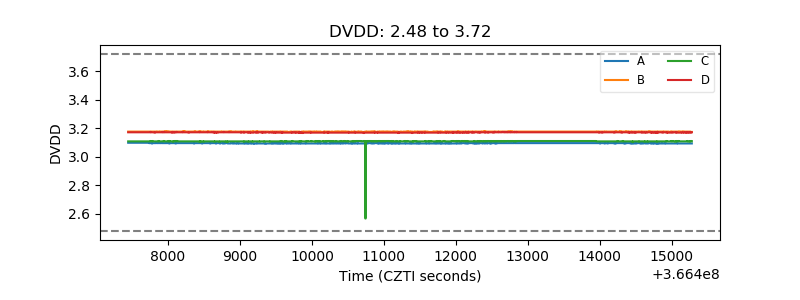 |
| Temperature 1 | 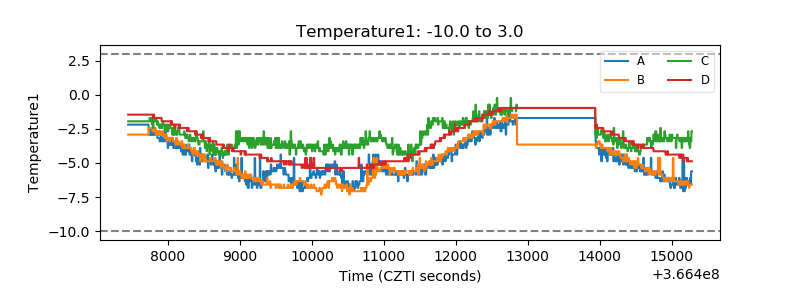 |
| Veto HV Monitor | 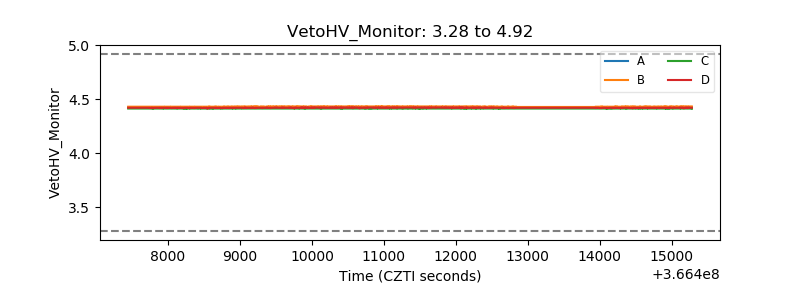 |
| Veto LLD | 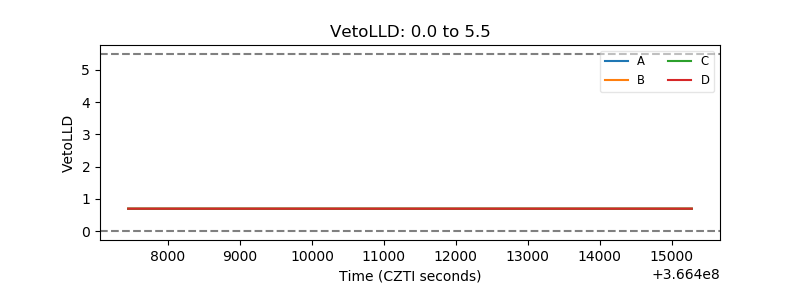 |
| Alpha Counter |  |
| _CPM_Rate | 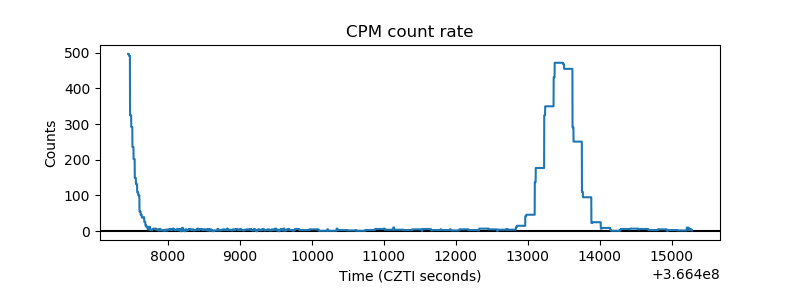 |
| CZT Counter | 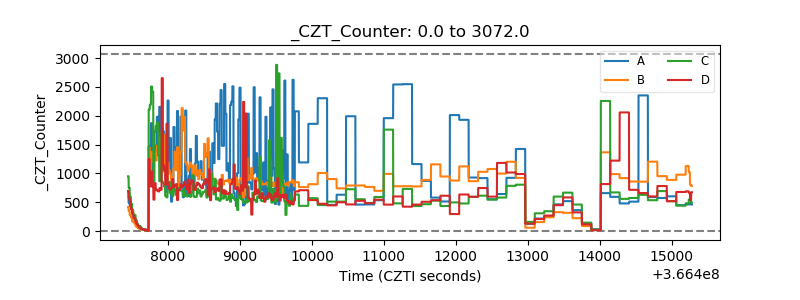 |
| +2.5 Volts monitor |  |
| +5 Volts monitor |  |
| _ROLL_ROT | 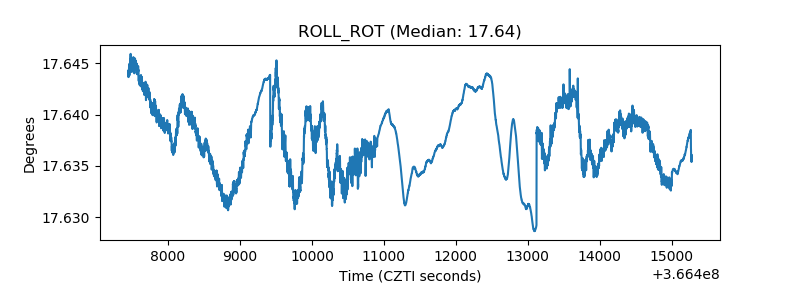 |
| _Roll_DEC | 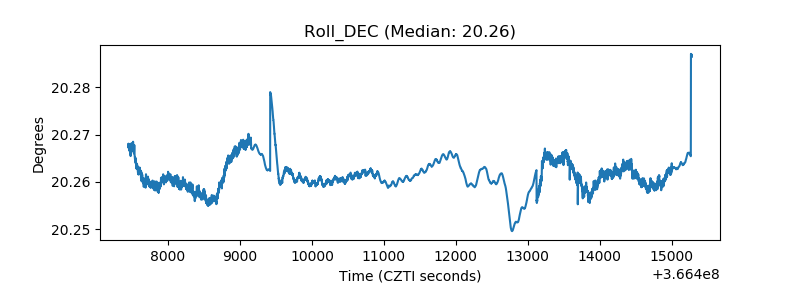 |
| _Roll_RA | 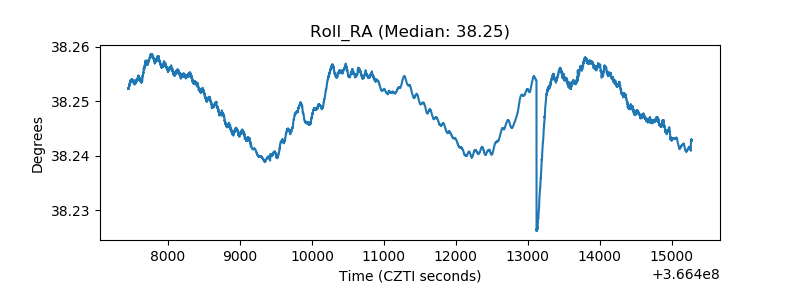 |
| Veto Counter | 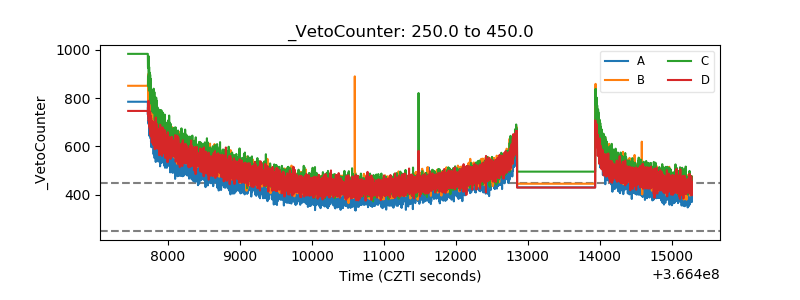 |