| Param | Original file | Final file |
|---|---|---|
| Filename | modeM0/AS1T04_034T01_9000004632_31747cztM0_level2.evt | modeM0/AS1T04_034T01_9000004632_31747cztM0_level2_quad_clean.evt |
| Size (bytes) | 746,087,040 | 103,158,720 |
| Size | 711.5 MB | 98.4 MB |
| Events in quadrant A | 6,474,359 | 632,008 |
| Events in quadrant B | 6,585,858 | 674,588 |
| Events in quadrant C | 4,416,714 | 654,937 |
| Events in quadrant D | 4,620,312 | 648,944 |
| Mode M9 | |||
|---|---|---|---|
| Quadrant | BADHDUFLAG | Total packets | Discarded packets |
| A | 0 | 16 | 0 |
| B | 0 | 16 | 0 |
| C | 0 | 16 | 0 |
| D | 0 | 16 | 0 |
| Mode SS | |||
|---|---|---|---|
| Quadrant | BADHDUFLAG | Total packets | Discarded packets |
| A | 0 | 154 | 0 |
| B | 0 | 154 | 0 |
| C | 0 | 154 | 0 |
| D | 0 | 154 | 0 |
| Mode M0 | |||
|---|---|---|---|
| Quadrant | BADHDUFLAG | Total packets | Discarded packets |
| A | 0 | 24156 | 4 |
| B | 0 | 24548 | 2 |
| C | 0 | 17796 | 2 |
| D | 0 | 18851 | 2 |
| Quadrant | Total seconds | Saturated seconds | Saturation percentage |
|---|---|---|---|
| A | 7369 | 906 | 12.294748% |
| B | 7370 | 442 | 5.997286% |
| C | 7370 | 343 | 4.654003% |
| D | 7370 | 103 | 1.397558% |
Noise dominated data is calculated using 1-second bins in cleaned event files. If a bin has >2000 counts, and if more than 50% of those come from <1% of pixels, then it is considered to be noise-dominated and hence unusable.
| Quadrant | # 1 sec bins | Bins with >0 counts | Bins with >2000 counts | High rate bins dominated by noise | Noise dominated (total time) | Noise dominated (detector-on time) | Marked lightcurve |
|---|---|---|---|---|---|---|---|
| A | 9109 | 7370 | 525 | 525 | 5.76% | 7.12% | 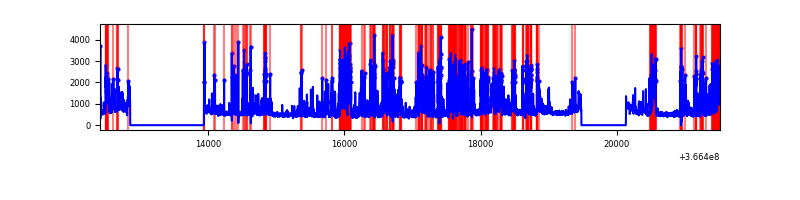 |
| B | 9110 | 7372 | 61 | 61 | 0.67% | 0.83% | 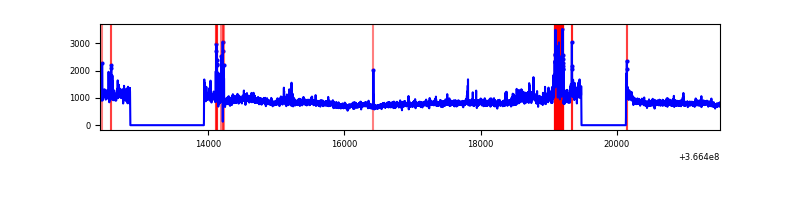 |
| C | 9110 | 7372 | 79 | 79 | 0.87% | 1.07% | 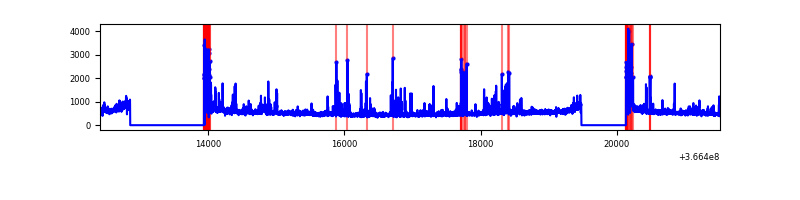 |
| D | 9110 | 7372 | 27 | 27 | 0.30% | 0.37% | 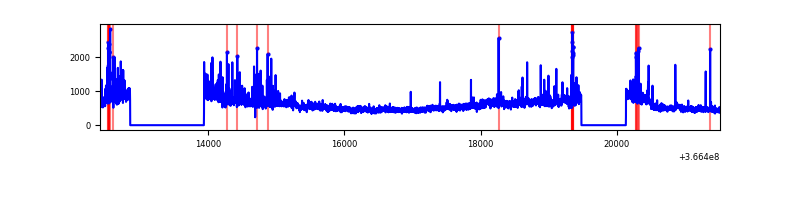 |
Top three noisy pixels from each quadrant. If the there are fewer than three noisy pixels in the level2.evt file, extra rows are filled as -1
| Pixel properties | Quadrant properties | ||||||
|---|---|---|---|---|---|---|---|
| Quadrant | DetID | PixID | Counts | Sigma | Mean | Median | Sigma |
| A | 0 | 13 | 2951381 | 16034.29 | 912 | 894 | 184.0 |
| A | 13 | 254 | 12493 | 63.03 | 912 | 894 | 184.0 |
| A | 3 | 137 | 9197 | 45.12 | 912 | 894 | 184.0 |
| B | 6 | 159 | 2049412 | 11448.86 | 932 | 907 | 178.9 |
| B | 4 | 80 | 608049 | 3393.25 | 932 | 907 | 178.9 |
| B | 15 | 219 | 138843 | 770.91 | 932 | 907 | 178.9 |
| C | 0 | 10 | 646482 | 3049.74 | 904 | 911 | 211.7 |
| C | 14 | 238 | 144873 | 680.09 | 904 | 911 | 211.7 |
| C | 3 | 233 | 55696 | 258.81 | 904 | 911 | 211.7 |
| D | 8 | 195 | 843542 | 3816.28 | 927 | 903 | 220.8 |
| D | 1 | 52 | 100054 | 449.05 | 927 | 903 | 220.8 |
| D | 12 | 233 | 78873 | 353.12 | 927 | 903 | 220.8 |
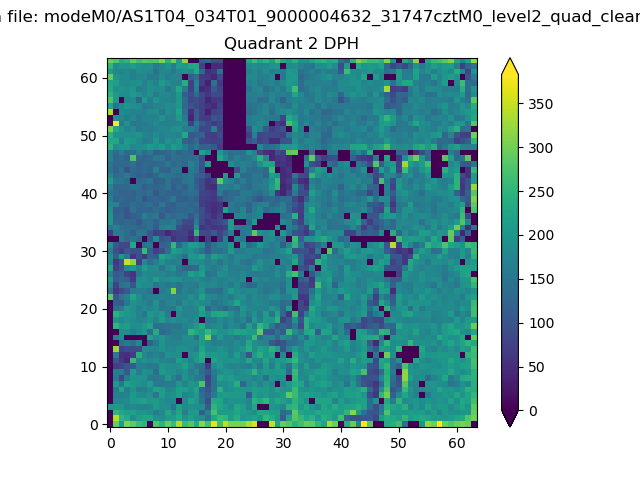
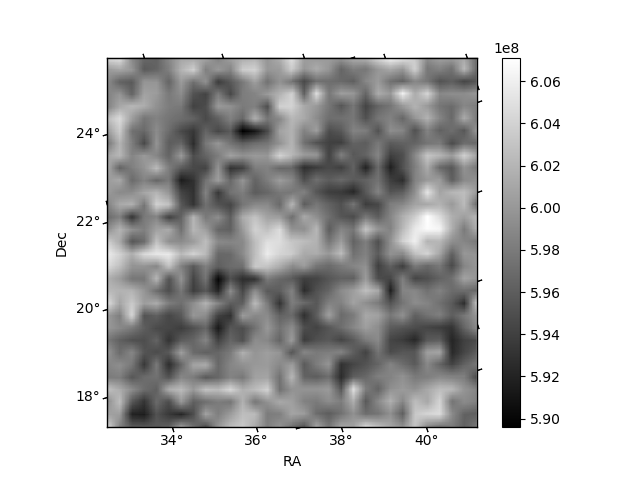
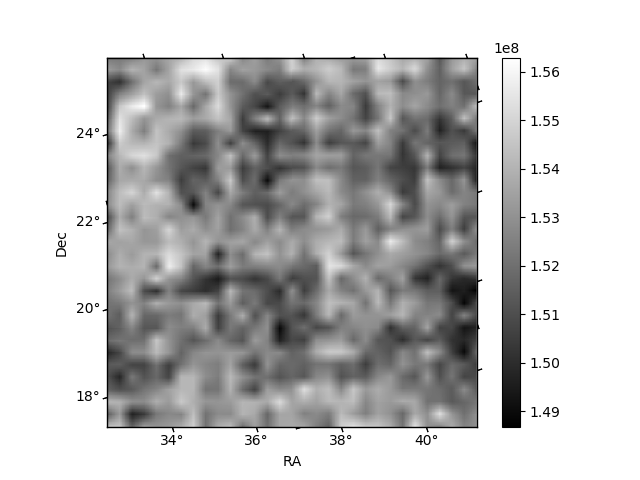
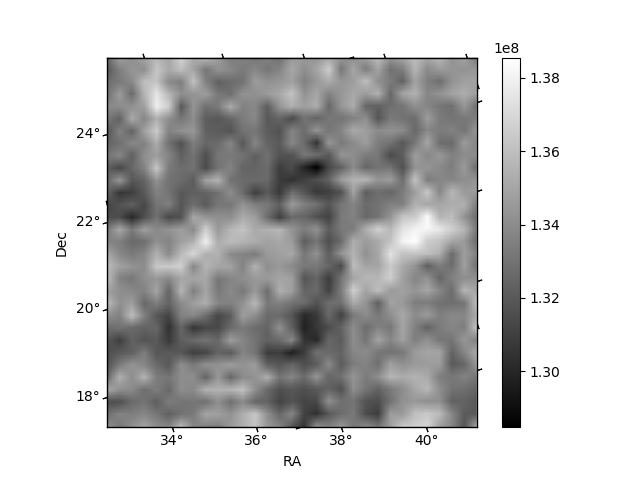
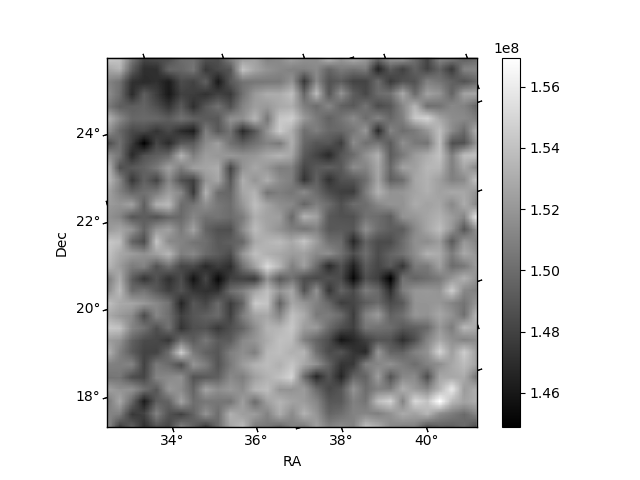
Histogram calculated using DETX and DETY for each event in the final _common_clean file
| Quadrant A | 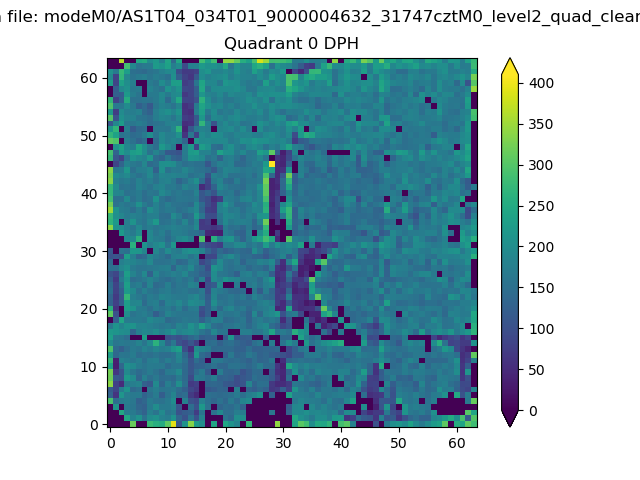 |
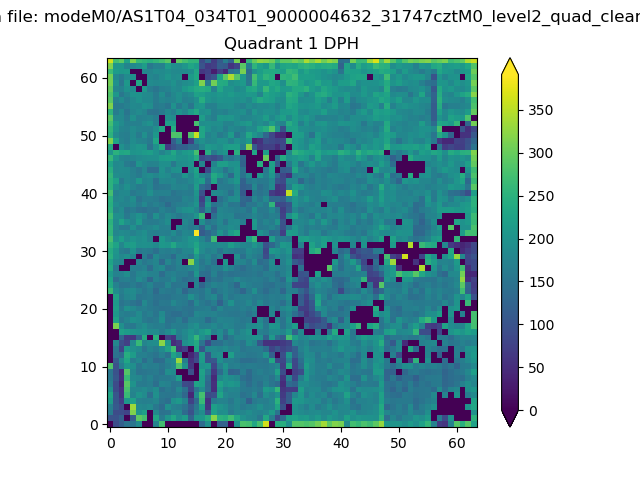 |
Quadrant B |
|---|---|---|---|
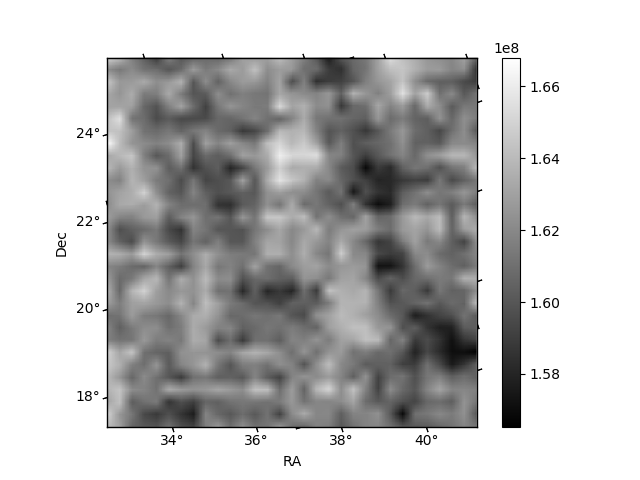
| Quadrant D | 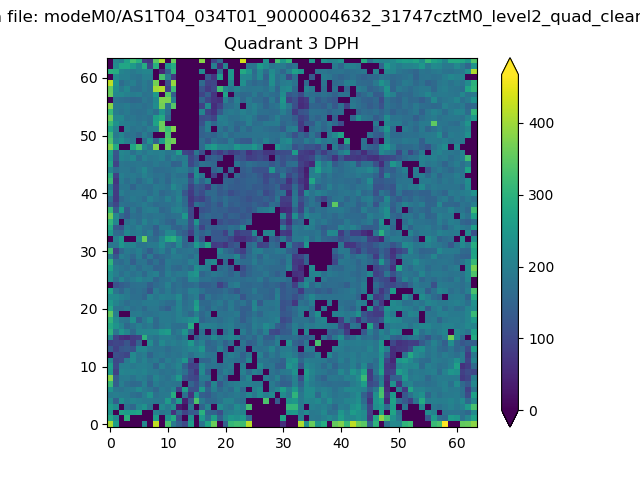 |
 |
Quadrant C |
| Plot type | Count rate plots | Images |
|---|---|---|
| Comparison with Poisson distribution Blue bars denote a histogram of data divided into 1 sec bins. Red curve is a Poisson curve with rate = median count rate of data. |
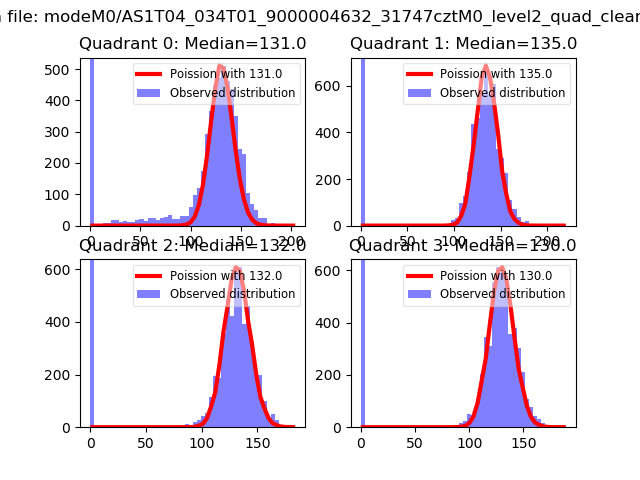 |
 |
| Quadrant-wise count rates Data is divided into 100 sec bins |
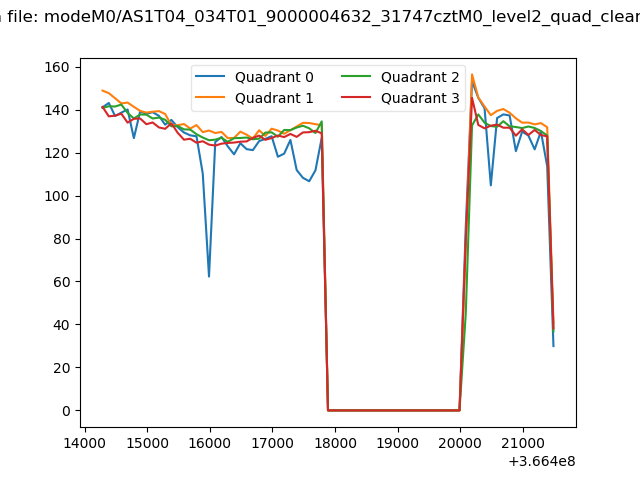 |
|
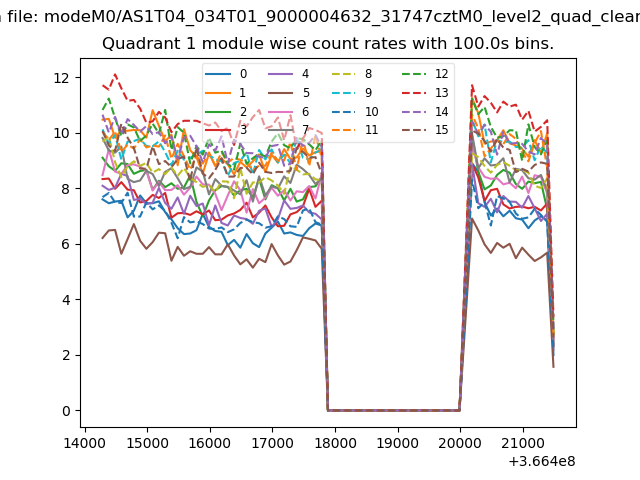
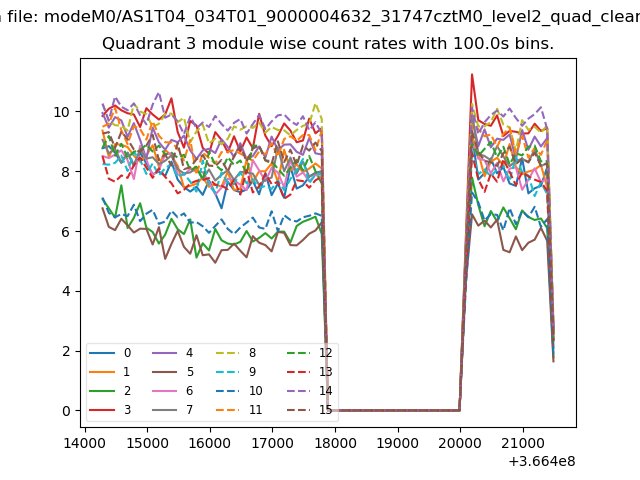
| Module-wise count rates for Quadrant A Data is divided into 100 sec bins |
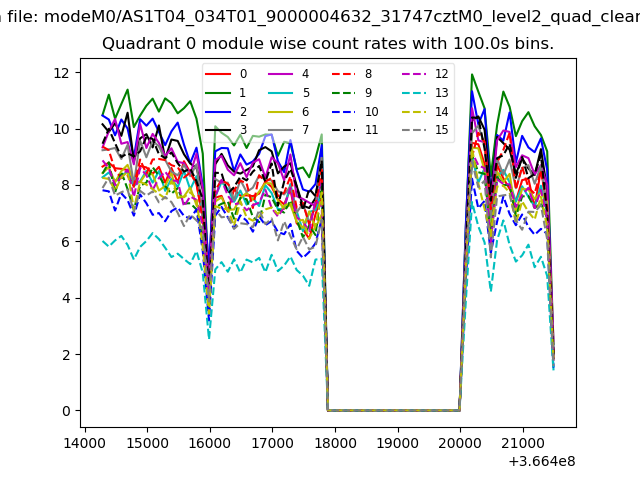 |
 |
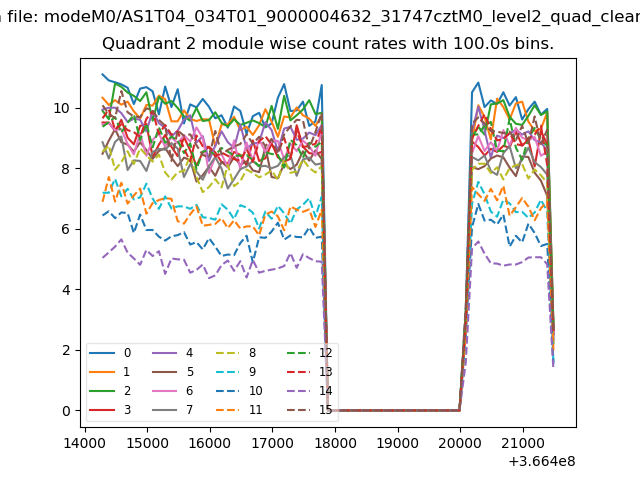
| Module-wise count rates for Quadrant B Data is divided into 100 sec bins |
 |
 |
| Module-wise count rates for Quadrant C Data is divided into 100 sec bins |
 |
 |
| Module-wise count rates for Quadrant D Data is divided into 100 sec bins |
 |
 |
| Parameter | Plot |
|---|---|
| CZT HV Monitor | 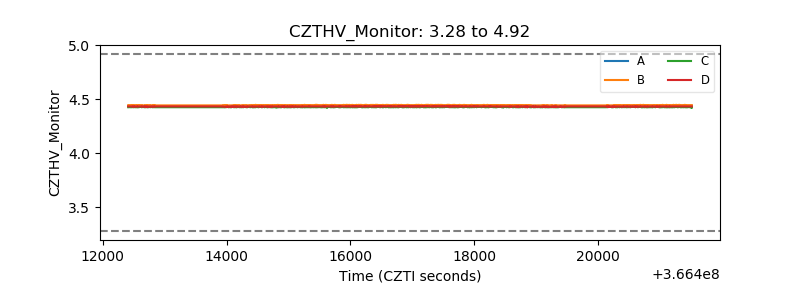 |
| D_VDD | 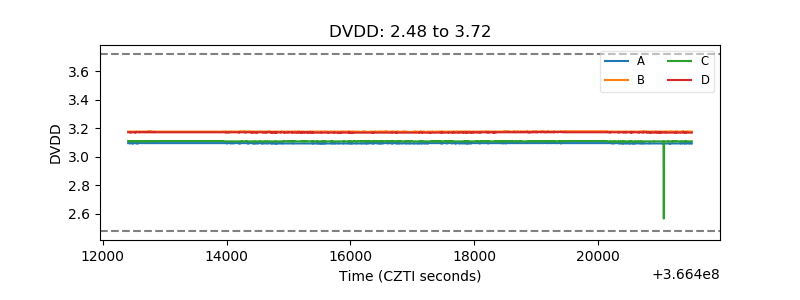 |
| Temperature 1 | 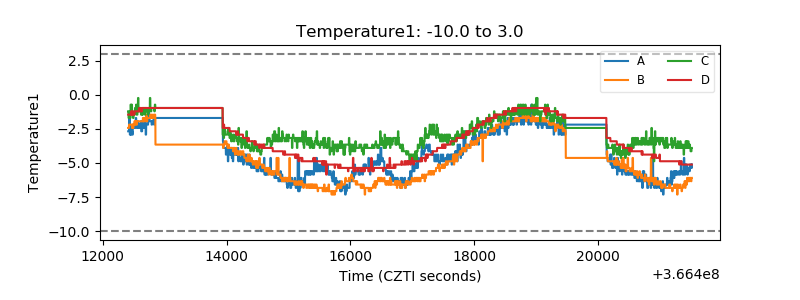 |
| Veto HV Monitor |  |
| Veto LLD | 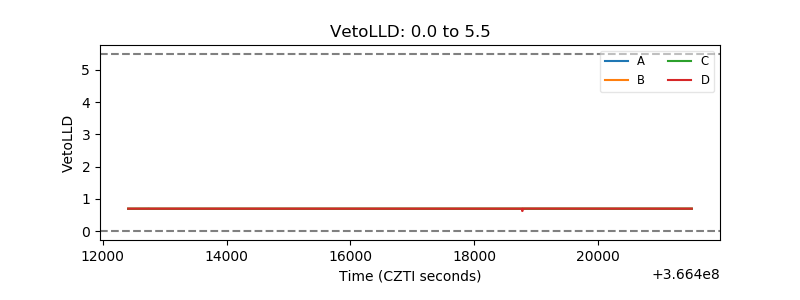 |
| Alpha Counter | 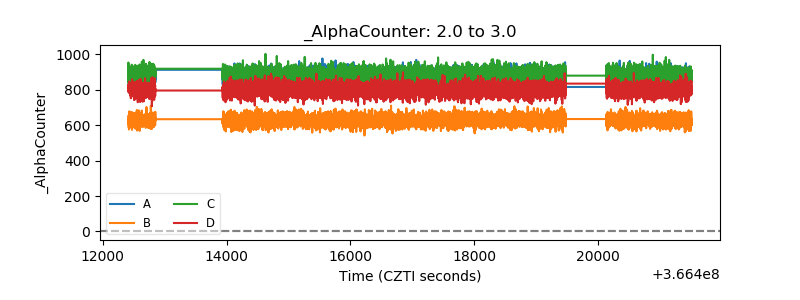 |
| _CPM_Rate | 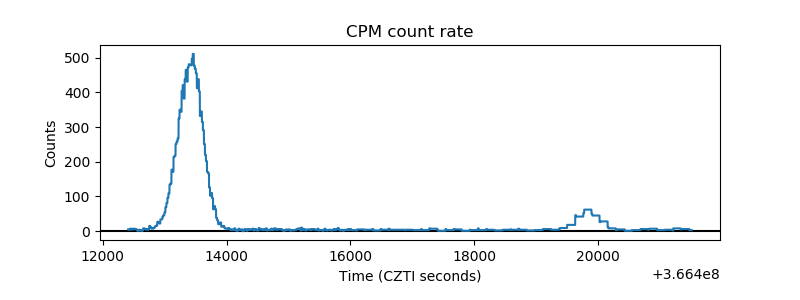 |
| CZT Counter | 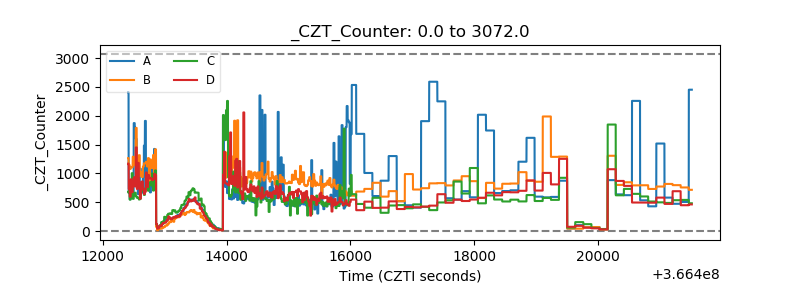 |
| +2.5 Volts monitor |  |
| +5 Volts monitor |  |
| _ROLL_ROT | 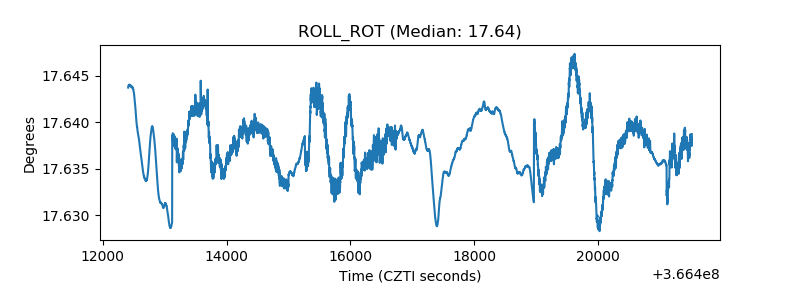 |
| _Roll_DEC | 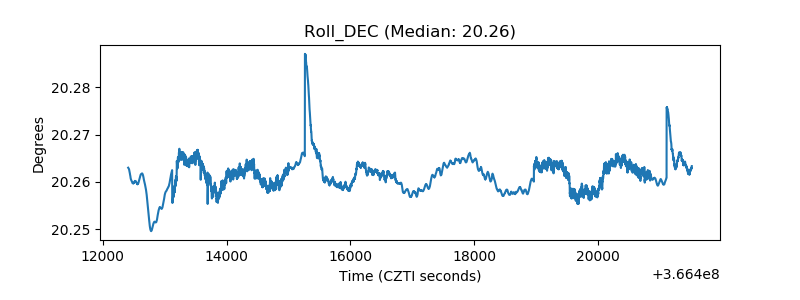 |
| _Roll_RA | 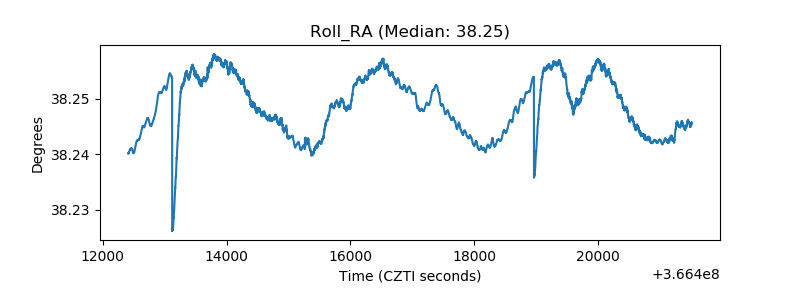 |
| Veto Counter | 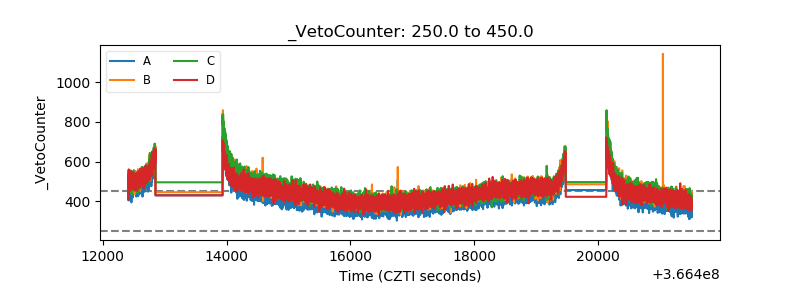 |