| Param | Original file | Final file |
|---|---|---|
| Filename | modeM0/AS1T04_034T01_9000004632_31748cztM0_level2.evt | modeM0/AS1T04_034T01_9000004632_31748cztM0_level2_quad_clean.evt |
| Size (bytes) | 793,149,120 | 106,715,520 |
| Size | 756.4 MB | 101.8 MB |
| Events in quadrant A | 6,979,690 | 666,604 |
| Events in quadrant B | 6,041,759 | 700,397 |
| Events in quadrant C | 5,862,696 | 667,955 |
| Events in quadrant D | 4,627,738 | 671,797 |
| Mode M9 | |||
|---|---|---|---|
| Quadrant | BADHDUFLAG | Total packets | Discarded packets |
| A | 0 | 7 | 0 |
| B | 0 | 8 | 0 |
| C | 0 | 8 | 0 |
| D | 0 | 8 | 0 |
| Mode SS | |||
|---|---|---|---|
| Quadrant | BADHDUFLAG | Total packets | Discarded packets |
| A | 0 | 156 | 0 |
| B | 0 | 156 | 0 |
| C | 0 | 156 | 0 |
| D | 0 | 156 | 0 |
| Mode M0 | |||
|---|---|---|---|
| Quadrant | BADHDUFLAG | Total packets | Discarded packets |
| A | 0 | 25956 | 2 |
| B | 0 | 23446 | 2 |
| C | 0 | 22507 | 2 |
| D | 0 | 19152 | 2 |
| Quadrant | Total seconds | Saturated seconds | Saturation percentage |
|---|---|---|---|
| A | 7543 | 1037 | 13.747846% |
| B | 7543 | 347 | 4.600292% |
| C | 7543 | 657 | 8.710062% |
| D | 7543 | 101 | 1.338990% |
Noise dominated data is calculated using 1-second bins in cleaned event files. If a bin has >2000 counts, and if more than 50% of those come from <1% of pixels, then it is considered to be noise-dominated and hence unusable.
| Quadrant | # 1 sec bins | Bins with >0 counts | Bins with >2000 counts | High rate bins dominated by noise | Noise dominated (total time) | Noise dominated (detector-on time) | Marked lightcurve |
|---|---|---|---|---|---|---|---|
| A | 7678 | 7544 | 572 | 572 | 7.45% | 7.58% |  |
| B | 7678 | 7545 | 17 | 17 | 0.22% | 0.23% | 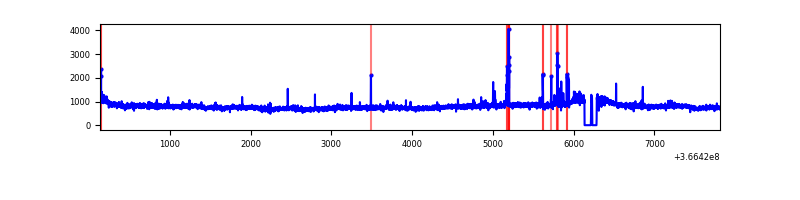 |
| C | 7678 | 7545 | 260 | 260 | 3.39% | 3.45% | 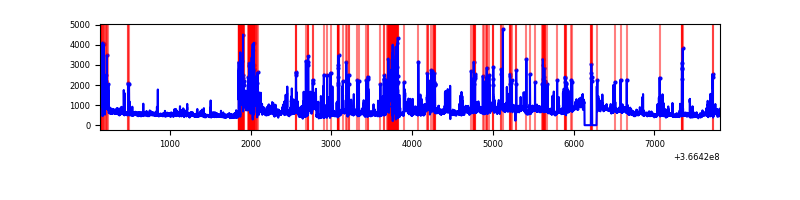 |
| D | 7678 | 7545 | 20 | 20 | 0.26% | 0.27% | 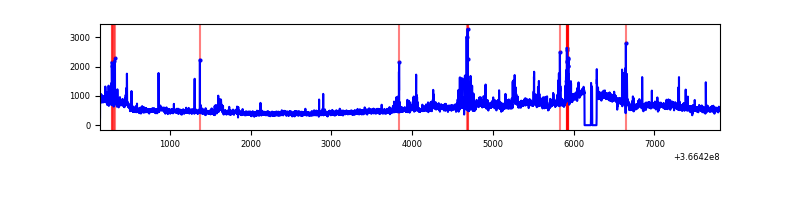 |
Top three noisy pixels from each quadrant. If the there are fewer than three noisy pixels in the level2.evt file, extra rows are filled as -1
| Pixel properties | Quadrant properties | ||||||
|---|---|---|---|---|---|---|---|
| Quadrant | DetID | PixID | Counts | Sigma | Mean | Median | Sigma |
| A | 0 | 13 | 3436483 | 18367.39 | 918 | 899 | 187.0 |
| A | 13 | 254 | 13119 | 65.33 | 918 | 899 | 187.0 |
| A | 3 | 137 | 9703 | 47.07 | 918 | 899 | 187.0 |
| B | 6 | 159 | 2115710 | 11508.66 | 948 | 924 | 183.8 |
| B | 5 | 172 | 81817 | 440.22 | 948 | 924 | 183.8 |
| B | 4 | 80 | 55495 | 296.98 | 948 | 924 | 183.8 |
| C | 0 | 10 | 2019234 | 9404.95 | 905 | 913 | 214.6 |
| C | 14 | 238 | 143152 | 662.8 | 905 | 913 | 214.6 |
| C | 3 | 233 | 80749 | 372.02 | 905 | 913 | 214.6 |
| D | 8 | 195 | 853390 | 3791.48 | 932 | 908 | 224.8 |
| D | 12 | 233 | 74068 | 325.38 | 932 | 908 | 224.8 |
| D | 2 | 250 | 63162 | 276.88 | 932 | 908 | 224.8 |
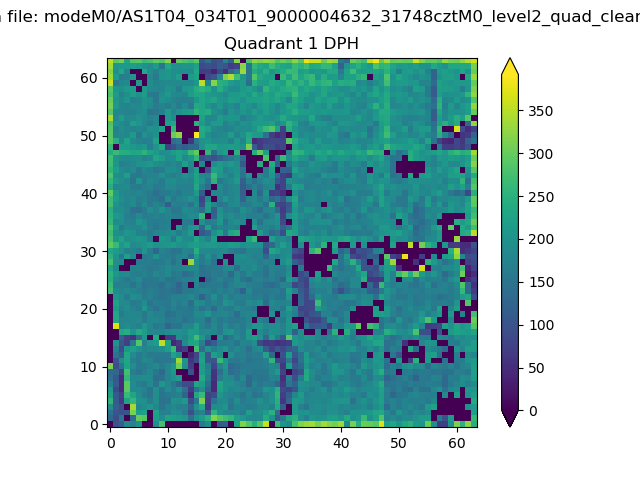
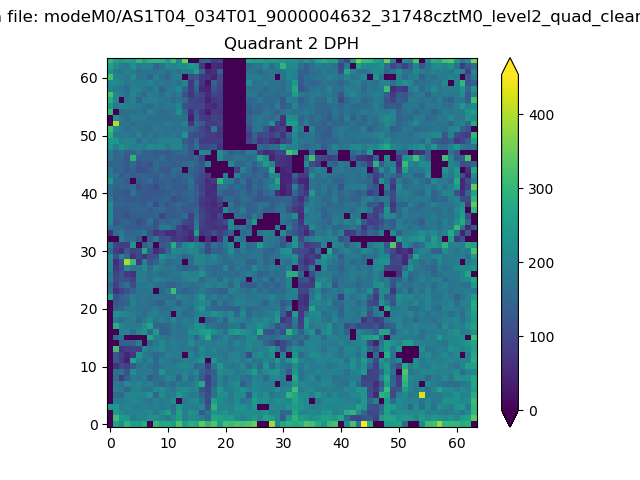
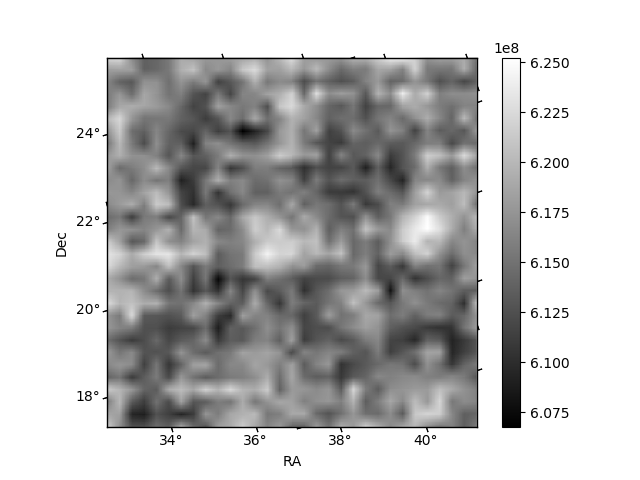
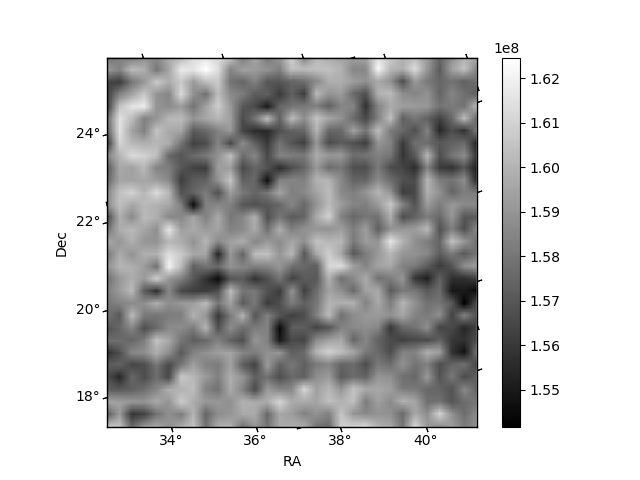
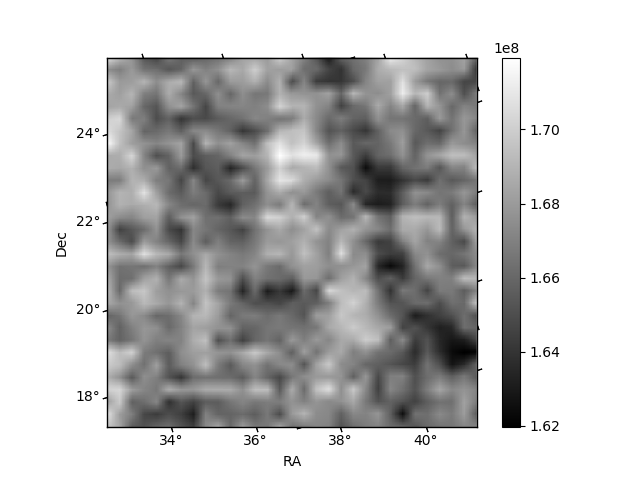
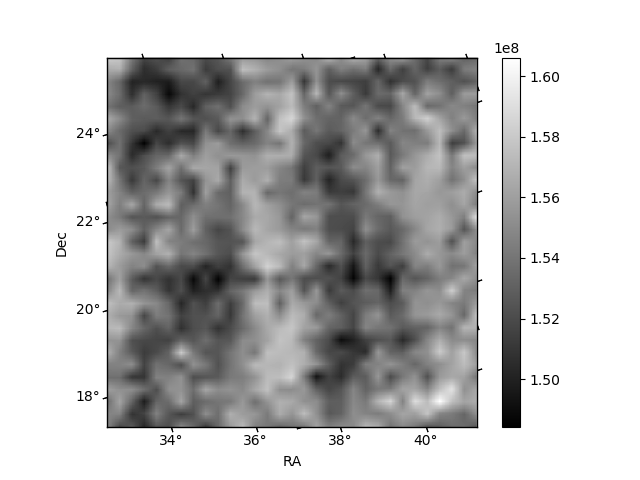
Histogram calculated using DETX and DETY for each event in the final _common_clean file
| Quadrant A | 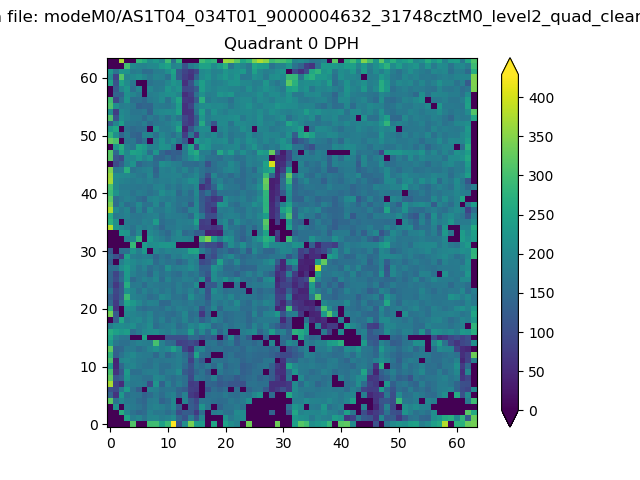 |
 |
Quadrant B |
|---|---|---|---|
| Quadrant D | 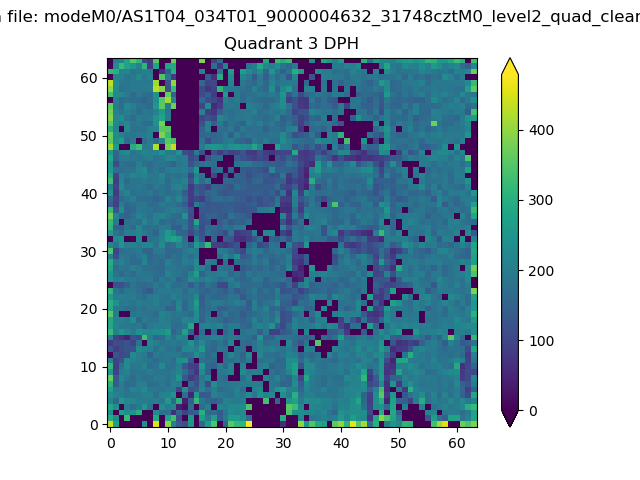 |
 |
Quadrant C |
| Plot type | Count rate plots | Images |
|---|---|---|
| Comparison with Poisson distribution Blue bars denote a histogram of data divided into 1 sec bins. Red curve is a Poisson curve with rate = median count rate of data. |
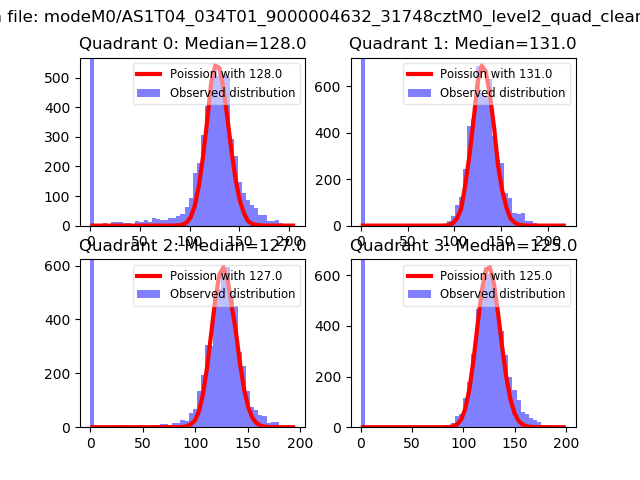 |
 |
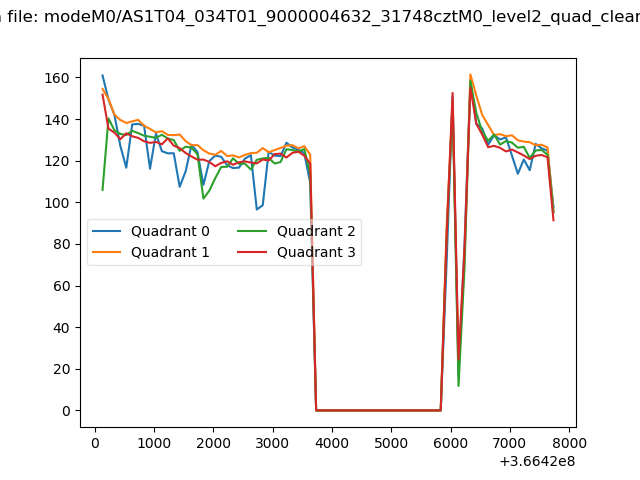
| Quadrant-wise count rates Data is divided into 100 sec bins |
 |
|
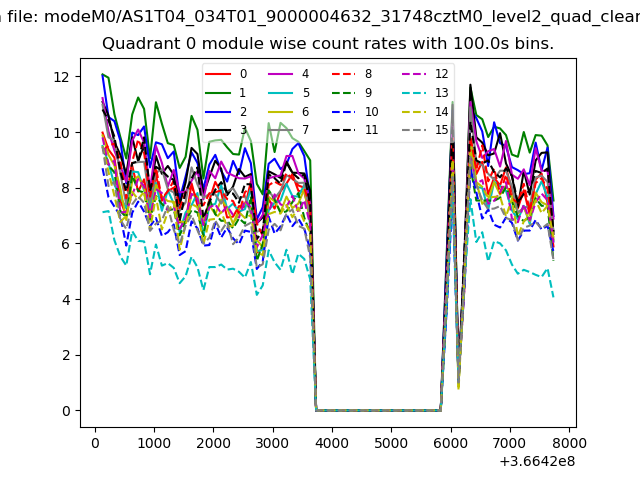
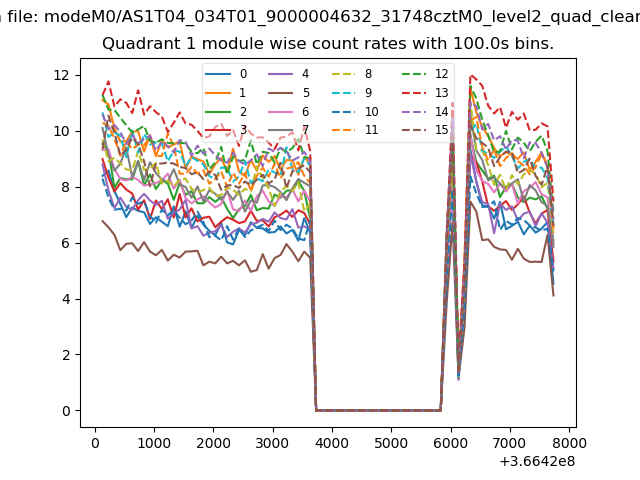
| Module-wise count rates for Quadrant A Data is divided into 100 sec bins |
 |
 |
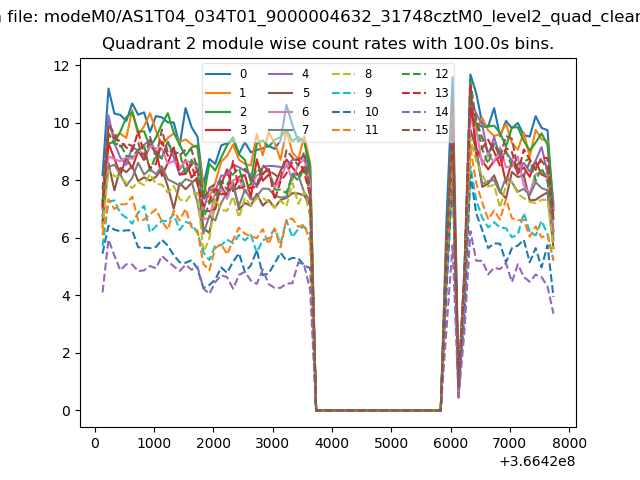
| Module-wise count rates for Quadrant B Data is divided into 100 sec bins |
 |
 |
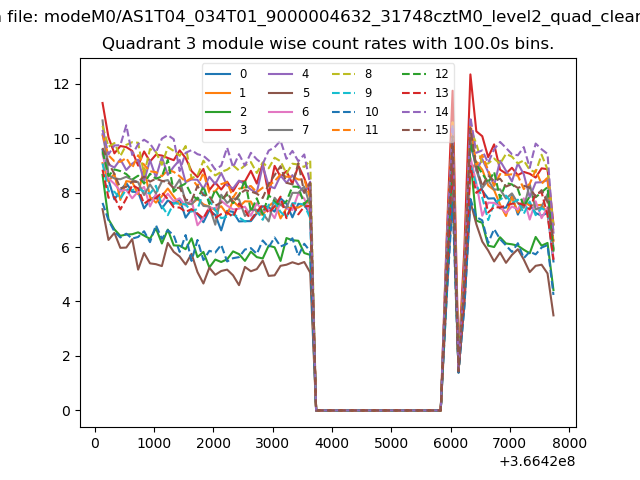
| Module-wise count rates for Quadrant C Data is divided into 100 sec bins |
 |
 |
| Module-wise count rates for Quadrant D Data is divided into 100 sec bins |
 |
 |
| Parameter | Plot |
|---|---|
| CZT HV Monitor | 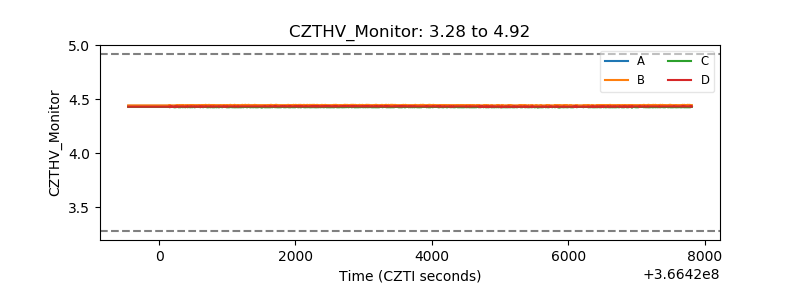 |
| D_VDD | 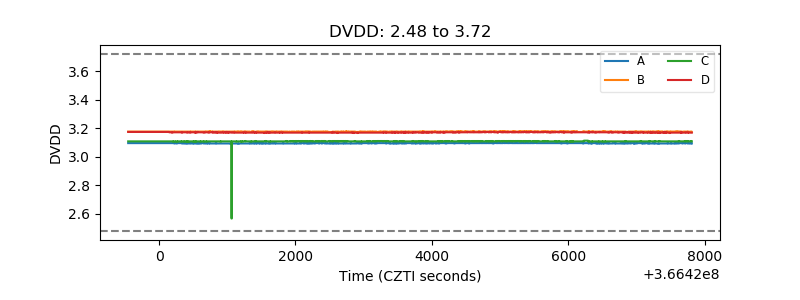 |
| Temperature 1 | 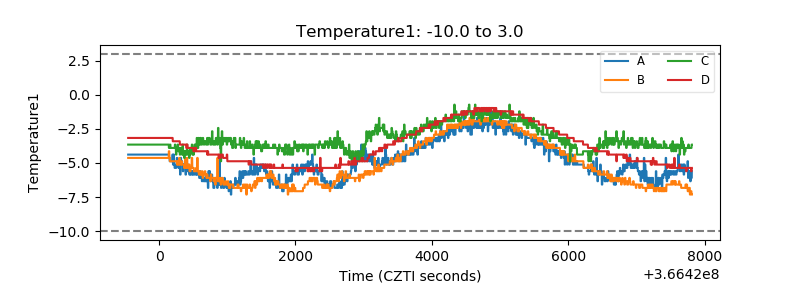 |
| Veto HV Monitor | 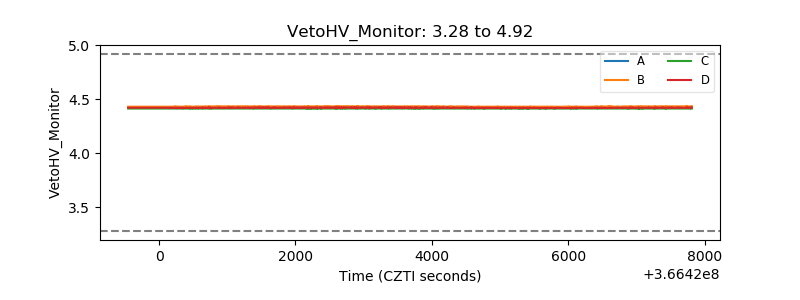 |
| Veto LLD | 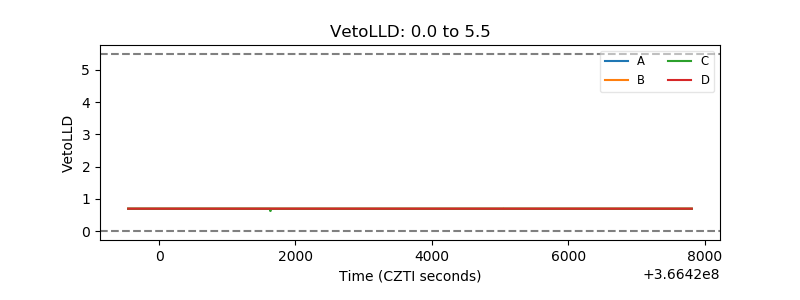 |
| Alpha Counter | 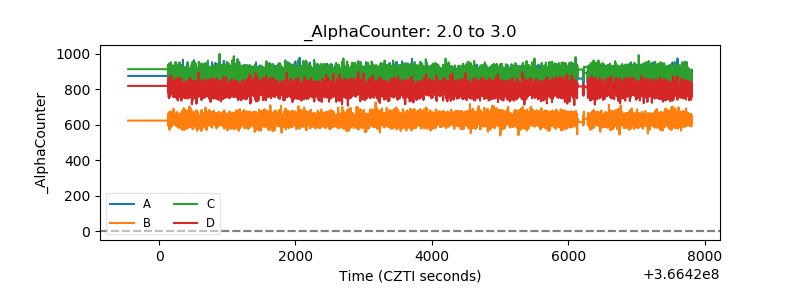 |
| _CPM_Rate | 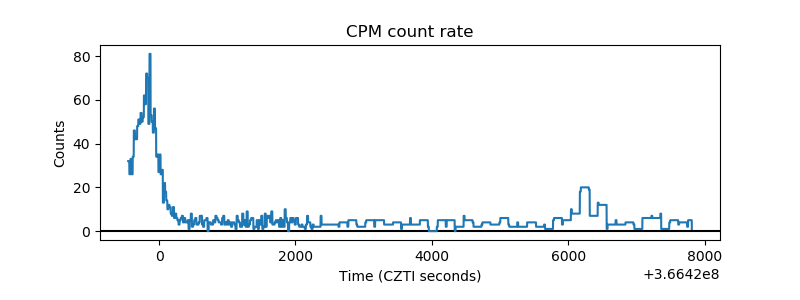 |
| CZT Counter | 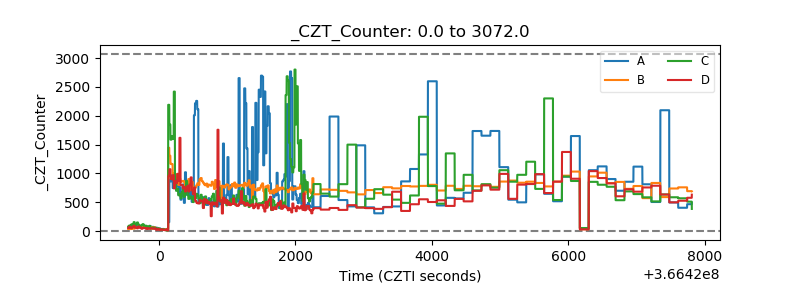 |
| +2.5 Volts monitor |  |
| +5 Volts monitor |  |
| _ROLL_ROT | 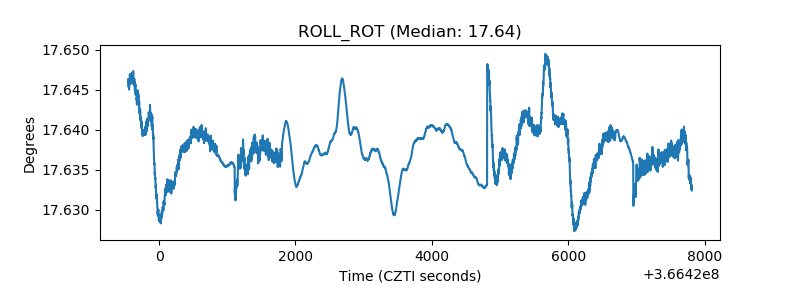 |
| _Roll_DEC | 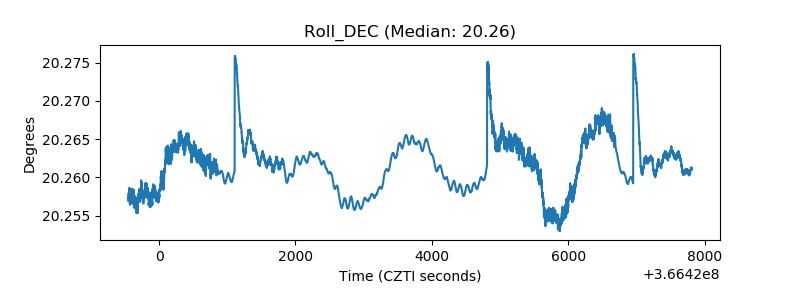 |
| _Roll_RA | 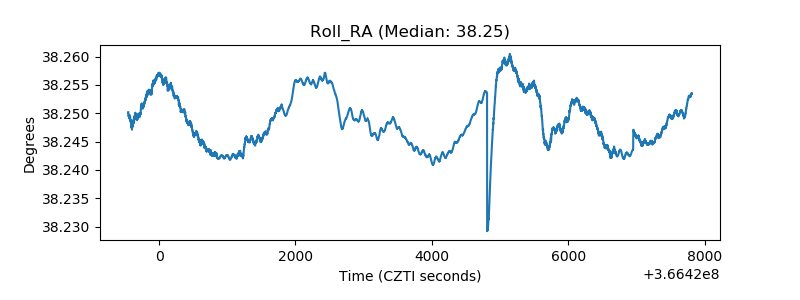 |
| Veto Counter | 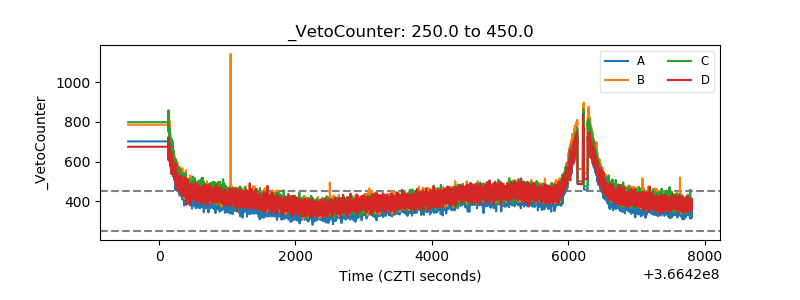 |