| Param | Original file | Final file |
|---|---|---|
| Filename | modeM0/AS1T04_034T01_9000004632_31749cztM0_level2.evt | modeM0/AS1T04_034T01_9000004632_31749cztM0_level2_quad_clean.evt |
| Size (bytes) | 843,410,880 | 111,741,120 |
| Size | 804.3 MB | 106.6 MB |
| Events in quadrant A | 8,632,868 | 650,069 |
| Events in quadrant B | 6,273,766 | 744,714 |
| Events in quadrant C | 5,384,768 | 717,289 |
| Events in quadrant D | 4,714,440 | 718,231 |
| Mode SS | |||
|---|---|---|---|
| Quadrant | BADHDUFLAG | Total packets | Discarded packets |
| A | 0 | 158 | 0 |
| B | 0 | 158 | 0 |
| C | 0 | 158 | 0 |
| D | 0 | 158 | 0 |
| Mode M0 | |||
|---|---|---|---|
| Quadrant | BADHDUFLAG | Total packets | Discarded packets |
| A | 0 | 31153 | 1 |
| B | 0 | 24618 | 1 |
| C | 0 | 21149 | 1 |
| D | 0 | 19217 | 1 |
| Quadrant | Total seconds | Saturated seconds | Saturation percentage |
|---|---|---|---|
| A | 7956 | 1946 | 24.459527% |
| B | 7957 | 466 | 5.856479% |
| C | 7957 | 579 | 7.276612% |
| D | 7957 | 127 | 1.596079% |
Noise dominated data is calculated using 1-second bins in cleaned event files. If a bin has >2000 counts, and if more than 50% of those come from <1% of pixels, then it is considered to be noise-dominated and hence unusable.
| Quadrant | # 1 sec bins | Bins with >0 counts | Bins with >2000 counts | High rate bins dominated by noise | Noise dominated (total time) | Noise dominated (detector-on time) | Marked lightcurve |
|---|---|---|---|---|---|---|---|
| A | 7956 | 7956 | 972 | 972 | 12.22% | 12.22% | 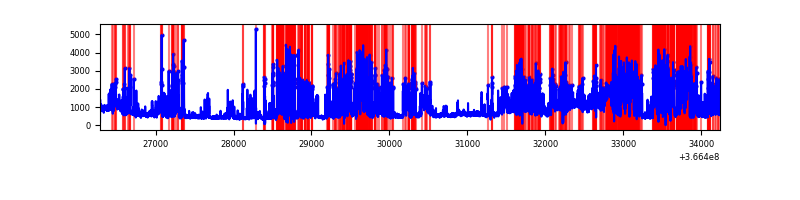 |
| B | 7957 | 7957 | 4 | 4 | 0.05% | 0.05% | 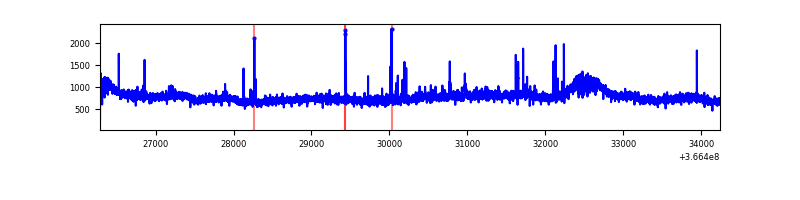 |
| C | 7957 | 7957 | 165 | 165 | 2.07% | 2.07% | 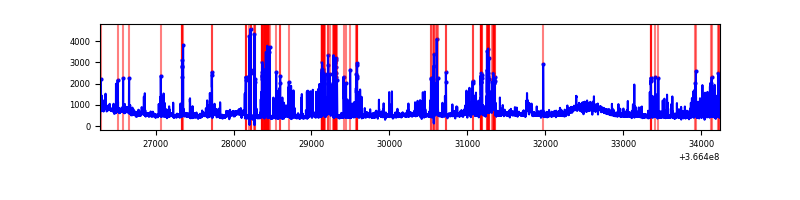 |
| D | 7957 | 7957 | 15 | 15 | 0.19% | 0.19% | 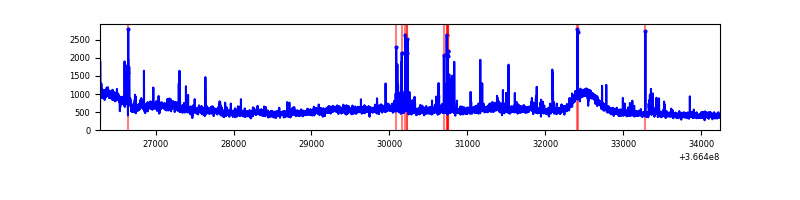 |
Top three noisy pixels from each quadrant. If the there are fewer than three noisy pixels in the level2.evt file, extra rows are filled as -1
| Pixel properties | Quadrant properties | ||||||
|---|---|---|---|---|---|---|---|
| Quadrant | DetID | PixID | Counts | Sigma | Mean | Median | Sigma |
| A | 0 | 13 | 5111557 | 27540.5 | 913 | 893 | 185.6 |
| A | 13 | 254 | 13482 | 67.84 | 913 | 893 | 185.6 |
| A | 3 | 137 | 9686 | 47.38 | 913 | 893 | 185.6 |
| B | 6 | 159 | 2225652 | 11346.26 | 1000 | 972 | 196.1 |
| B | 12 | 111 | 24905 | 122.06 | 1000 | 972 | 196.1 |
| B | 0 | 190 | 24784 | 121.45 | 1000 | 972 | 196.1 |
| C | 0 | 10 | 1283187 | 5562.03 | 968 | 973 | 230.5 |
| C | 14 | 238 | 153270 | 660.64 | 968 | 973 | 230.5 |
| C | 3 | 233 | 149358 | 643.67 | 968 | 973 | 230.5 |
| D | 8 | 195 | 793063 | 3317.03 | 987 | 961 | 238.8 |
| D | 1 | 52 | 54361 | 223.62 | 987 | 961 | 238.8 |
| D | 2 | 250 | 54014 | 222.17 | 987 | 961 | 238.8 |
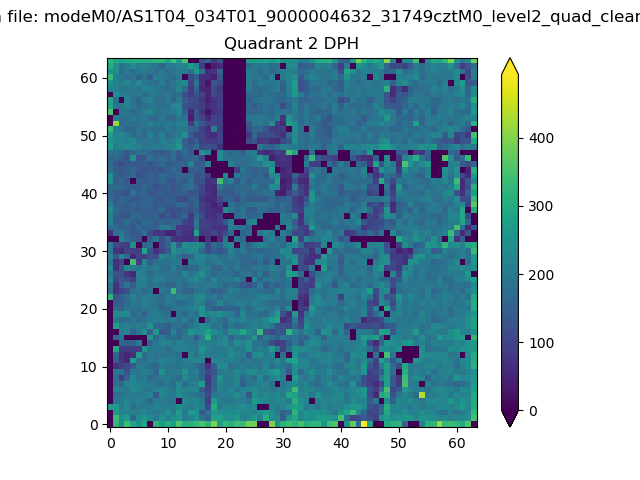
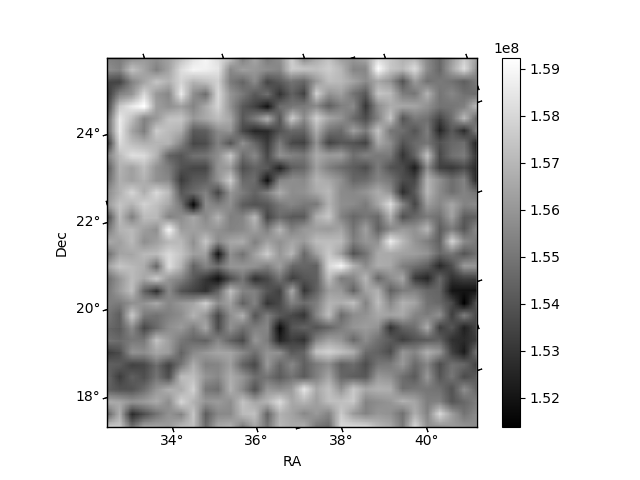
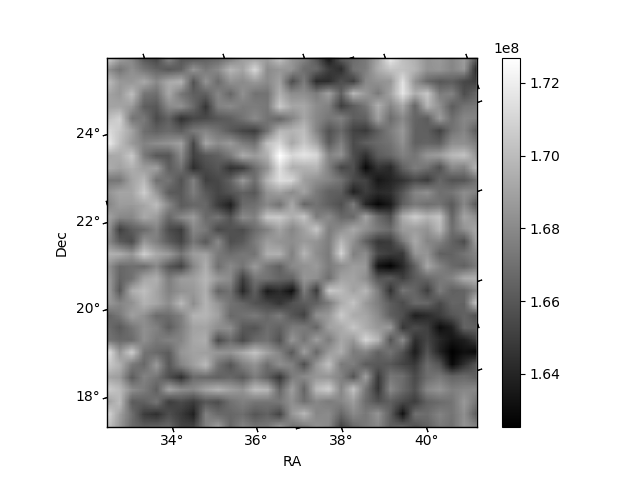
Histogram calculated using DETX and DETY for each event in the final _common_clean file
| Quadrant A | 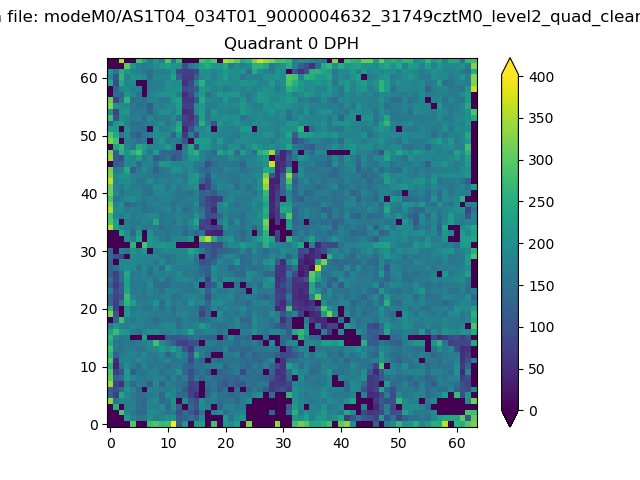 |
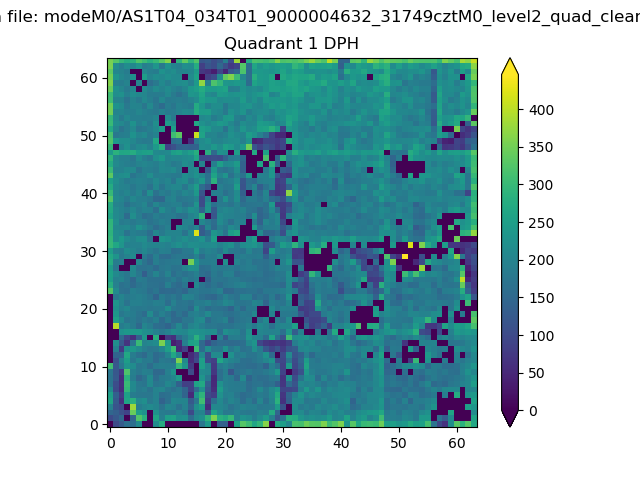 |
Quadrant B |
|---|---|---|---|
| Quadrant D | 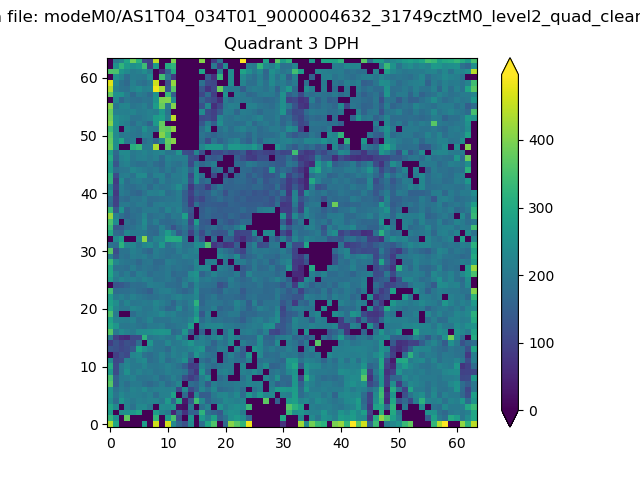 |
 |
Quadrant C |
| Plot type | Count rate plots | Images |
|---|---|---|
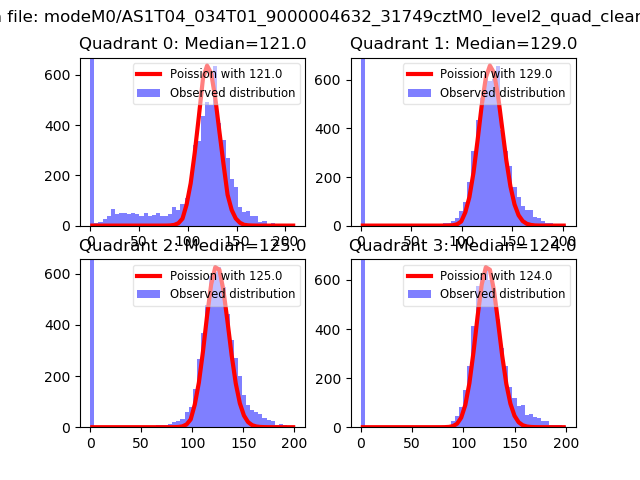
| Comparison with Poisson distribution Blue bars denote a histogram of data divided into 1 sec bins. Red curve is a Poisson curve with rate = median count rate of data. |
 |
 |
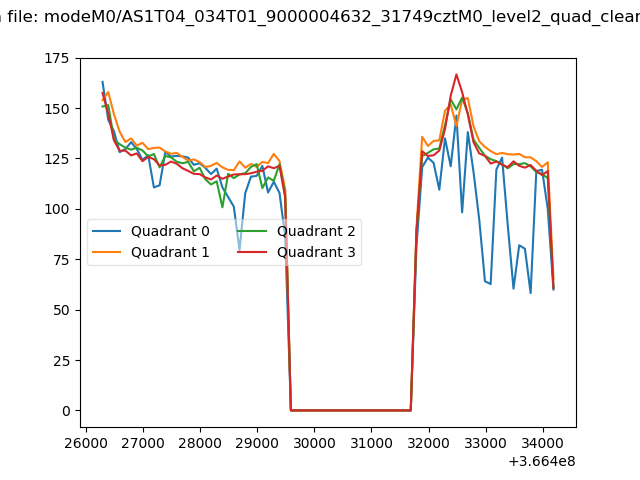
| Quadrant-wise count rates Data is divided into 100 sec bins |
 |
|
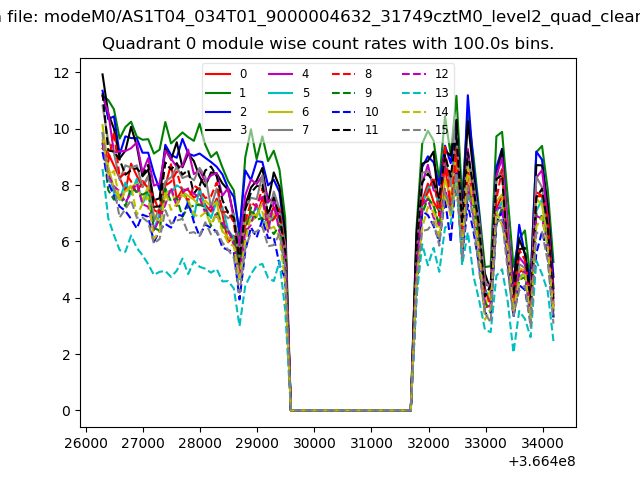
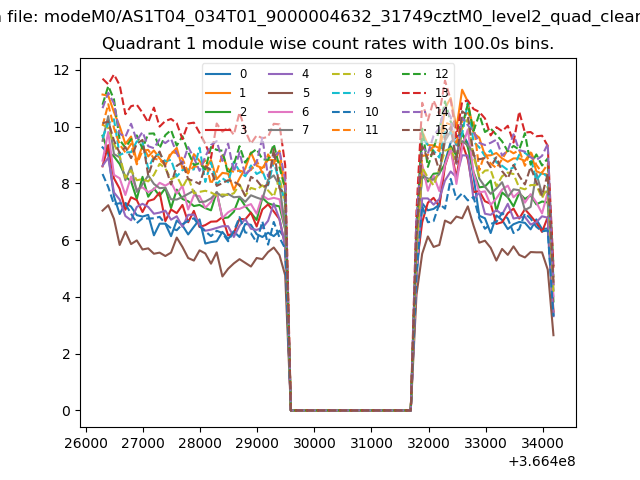
| Module-wise count rates for Quadrant A Data is divided into 100 sec bins |
 |
 |
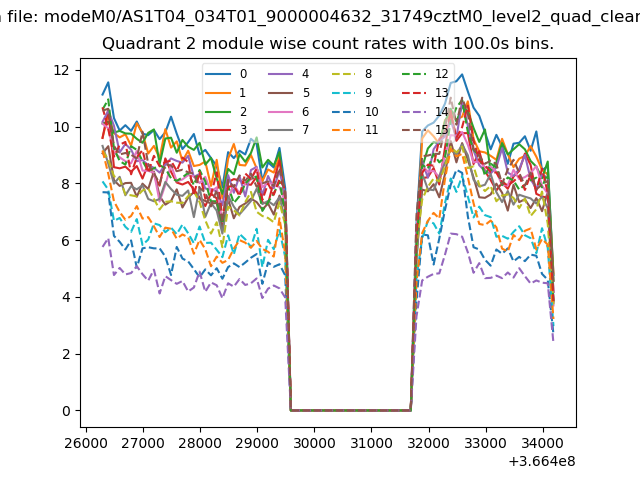
| Module-wise count rates for Quadrant B Data is divided into 100 sec bins |
 |
 |
| Module-wise count rates for Quadrant C Data is divided into 100 sec bins |
 |
 |
| Module-wise count rates for Quadrant D Data is divided into 100 sec bins |
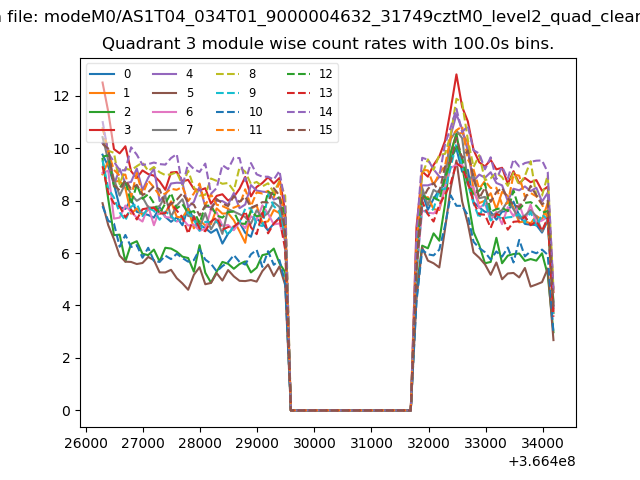 |
 |
| Parameter | Plot |
|---|---|
| CZT HV Monitor | 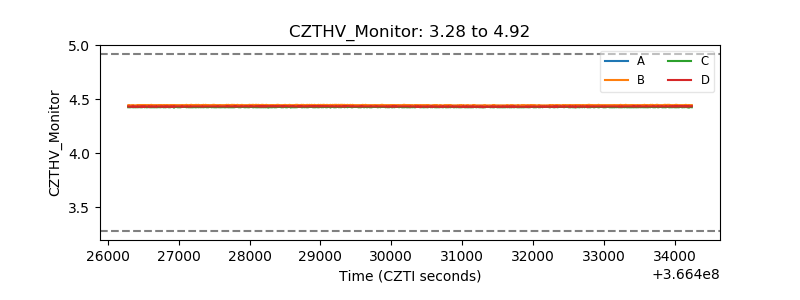 |
| D_VDD | 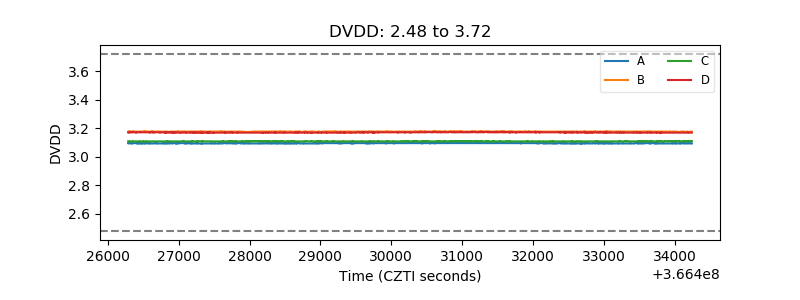 |
| Temperature 1 | 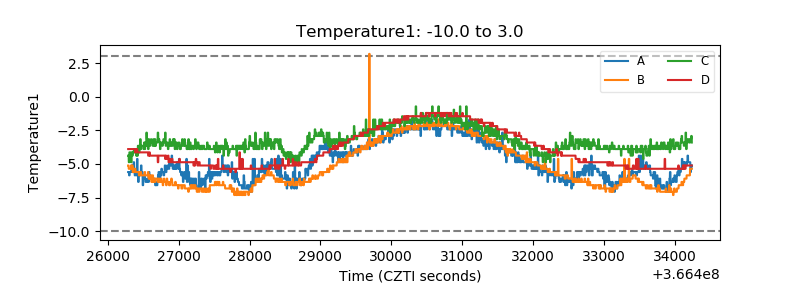 |
| Veto HV Monitor |  |
| Veto LLD | 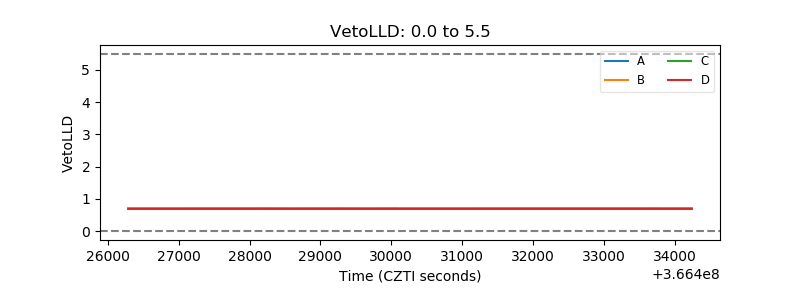 |
| Alpha Counter | 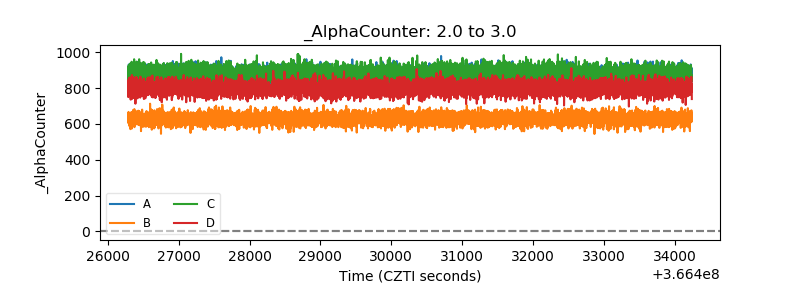 |
| _CPM_Rate | 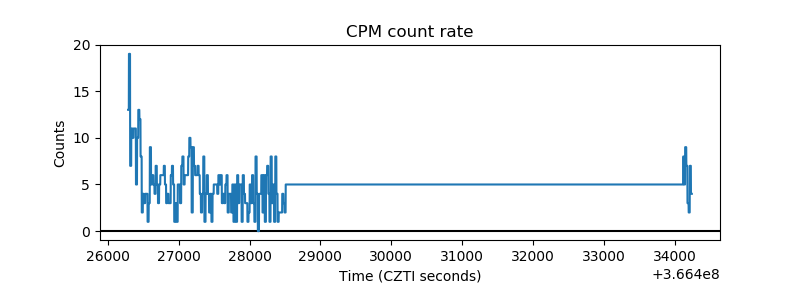 |
| CZT Counter | 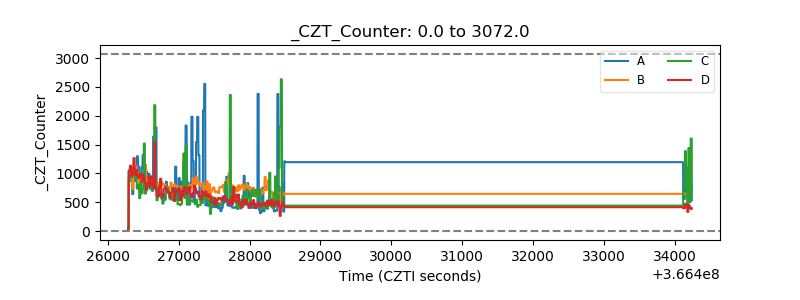 |
| +2.5 Volts monitor |  |
| +5 Volts monitor |  |
| _ROLL_ROT | 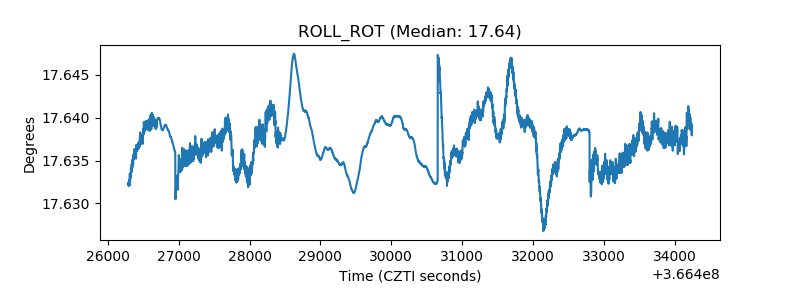 |
| _Roll_DEC | 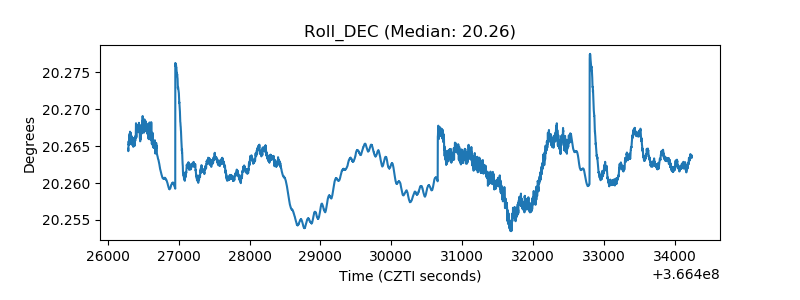 |
| _Roll_RA |  |
| Veto Counter | 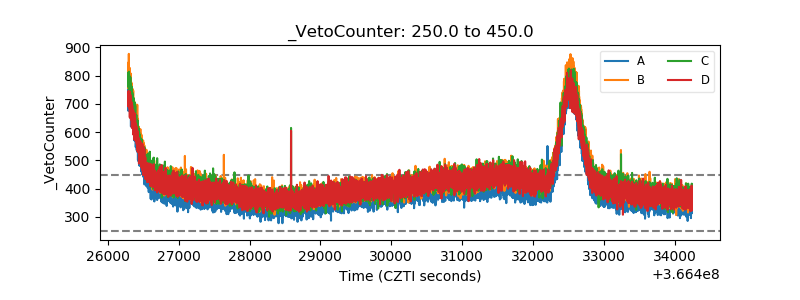 |