| Param | Original file | Final file |
|---|---|---|
| Filename | modeM0/AS1T04_034T01_9000004632_31752cztM0_level2.evt | modeM0/AS1T04_034T01_9000004632_31752cztM0_level2_quad_clean.evt |
| Size (bytes) | 1,380,352,320 | 159,148,800 |
| Size | 1.3 GB | 151.8 MB |
| Events in quadrant A | 15,387,947 | 880,413 |
| Events in quadrant B | 10,031,172 | 1,044,141 |
| Events in quadrant C | 8,155,455 | 1,001,572 |
| Events in quadrant D | 7,363,217 | 1,002,738 |
| Mode M9 | |||
|---|---|---|---|
| Quadrant | BADHDUFLAG | Total packets | Discarded packets |
| A | 0 | 12 | 0 |
| B | 0 | 13 | 0 |
| C | 0 | 13 | 0 |
| D | 0 | 13 | 0 |
| Mode SS | |||
|---|---|---|---|
| Quadrant | BADHDUFLAG | Total packets | Discarded packets |
| A | 0 | 262 | 0 |
| B | 0 | 262 | 0 |
| C | 0 | 262 | 0 |
| D | 0 | 262 | 0 |
| Mode M0 | |||
|---|---|---|---|
| Quadrant | BADHDUFLAG | Total packets | Discarded packets |
| A | 0 | 54587 | 3 |
| B | 0 | 39878 | 3 |
| C | 0 | 32435 | 3 |
| D | 0 | 30109 | 3 |
| Quadrant | Total seconds | Saturated seconds | Saturation percentage |
|---|---|---|---|
| A | 12867 | 3447 | 26.789461% |
| B | 12867 | 269 | 2.090619% |
| C | 12867 | 511 | 3.971400% |
| D | 12867 | 93 | 0.722779% |
Noise dominated data is calculated using 1-second bins in cleaned event files. If a bin has >2000 counts, and if more than 50% of those come from <1% of pixels, then it is considered to be noise-dominated and hence unusable.
| Quadrant | # 1 sec bins | Bins with >0 counts | Bins with >2000 counts | High rate bins dominated by noise | Noise dominated (total time) | Noise dominated (detector-on time) | Marked lightcurve |
|---|---|---|---|---|---|---|---|
| A | 14182 | 12868 | 2072 | 2072 | 14.61% | 16.10% | 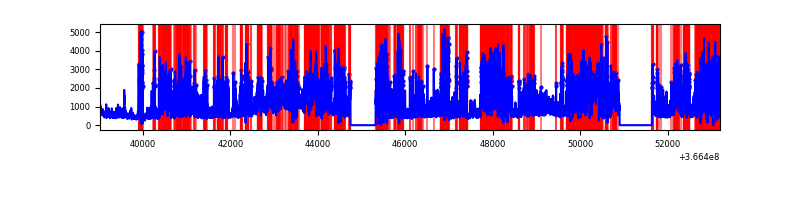 |
| B | 14182 | 12869 | 68 | 68 | 0.48% | 0.53% |  |
| C | 14182 | 12869 | 140 | 140 | 0.99% | 1.09% | 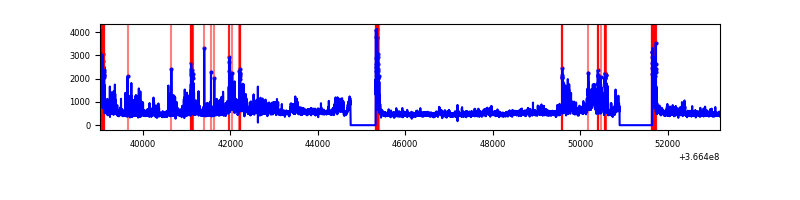 |
| D | 14182 | 12869 | 12 | 12 | 0.08% | 0.09% | 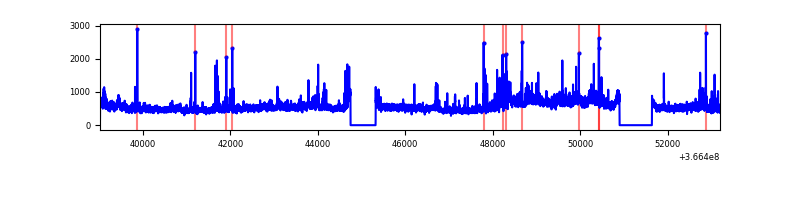 |
Top three noisy pixels from each quadrant. If the there are fewer than three noisy pixels in the level2.evt file, extra rows are filled as -1
| Pixel properties | Quadrant properties | ||||||
|---|---|---|---|---|---|---|---|
| Quadrant | DetID | PixID | Counts | Sigma | Mean | Median | Sigma |
| A | 0 | 13 | 10132205 | 37064.04 | 1362 | 1335 | 273.3 |
| A | 13 | 254 | 19051 | 64.81 | 1362 | 1335 | 273.3 |
| A | 3 | 137 | 13940 | 46.12 | 1362 | 1335 | 273.3 |
| B | 6 | 159 | 3425290 | 11576.76 | 1531 | 1490 | 295.7 |
| B | 4 | 80 | 299632 | 1008.1 | 1531 | 1490 | 295.7 |
| B | 10 | 245 | 80810 | 268.2 | 1531 | 1490 | 295.7 |
| C | 0 | 10 | 1076473 | 3114.33 | 1472 | 1482 | 345.2 |
| C | 3 | 233 | 1001282 | 2896.49 | 1472 | 1482 | 345.2 |
| C | 14 | 238 | 245255 | 706.23 | 1472 | 1482 | 345.2 |
| D | 8 | 195 | 1378459 | 3833.95 | 1506 | 1467 | 359.2 |
| D | 2 | 250 | 134892 | 371.49 | 1506 | 1467 | 359.2 |
| D | 12 | 233 | 93720 | 256.86 | 1506 | 1467 | 359.2 |
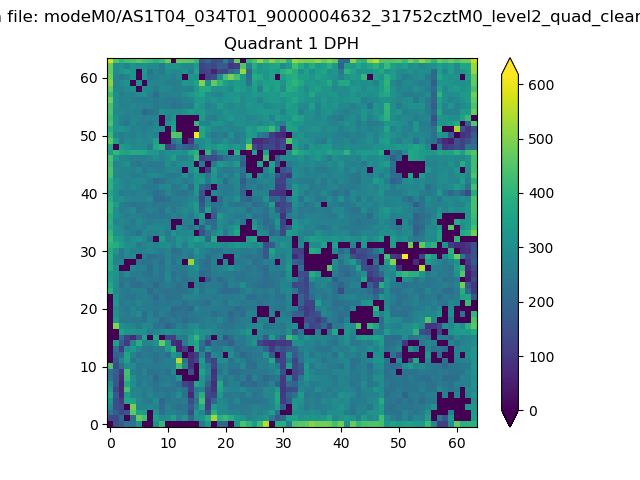
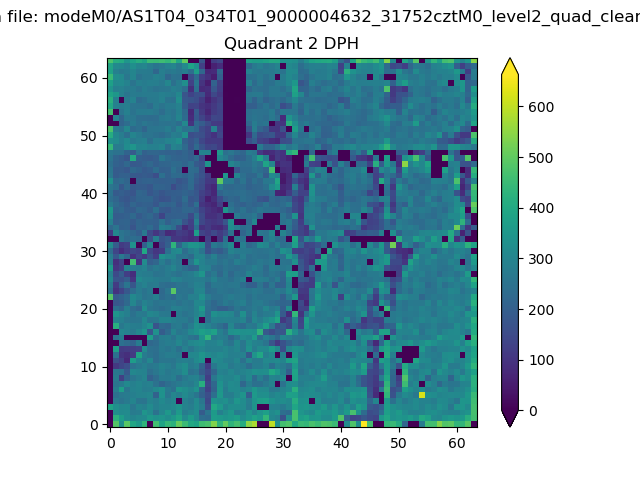
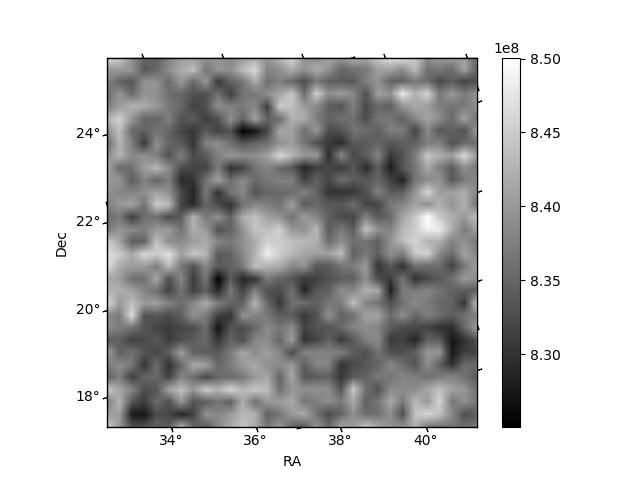
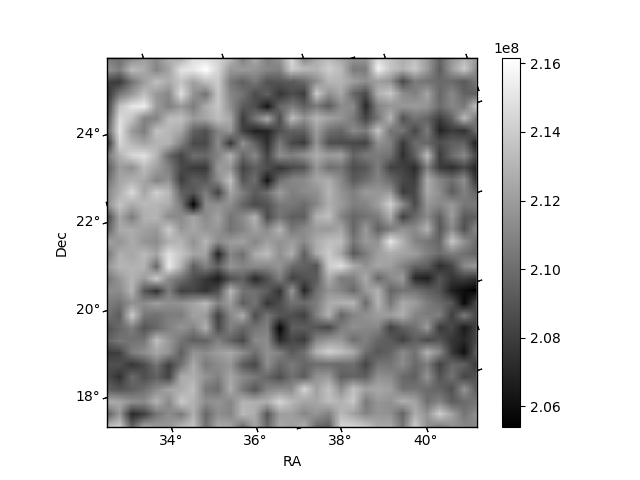
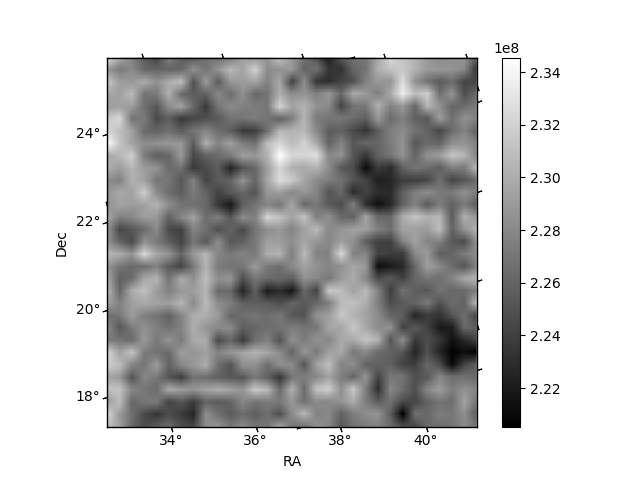
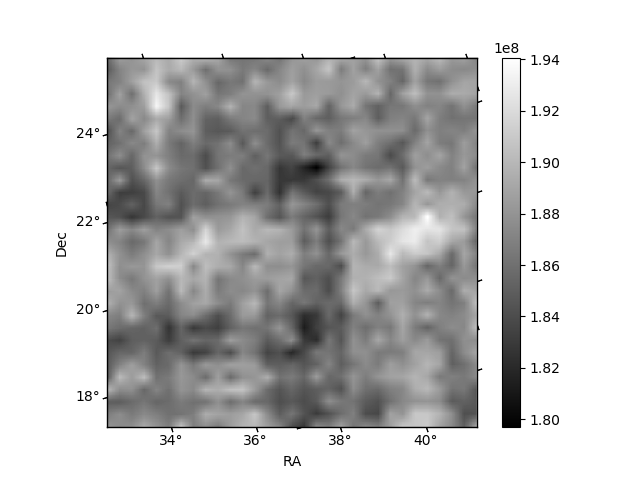
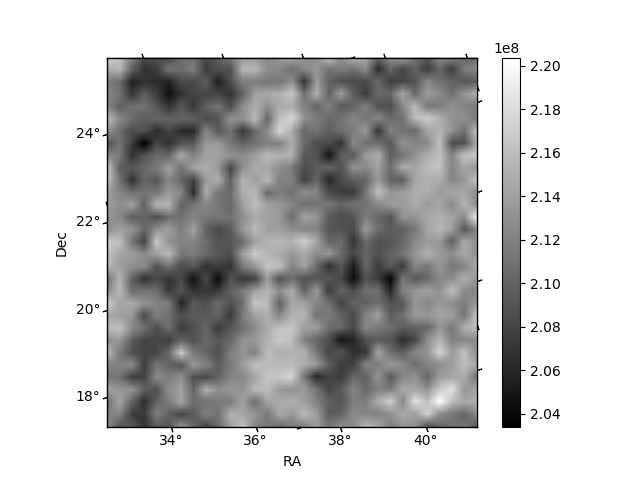
Histogram calculated using DETX and DETY for each event in the final _common_clean file
| Quadrant A | 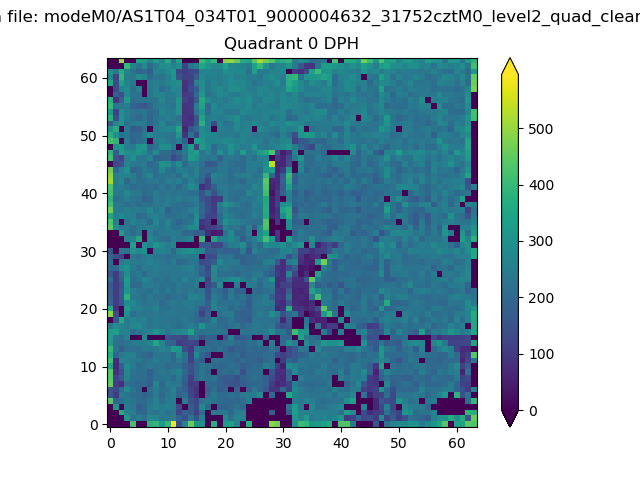 |
 |
Quadrant B |
|---|---|---|---|
| Quadrant D | 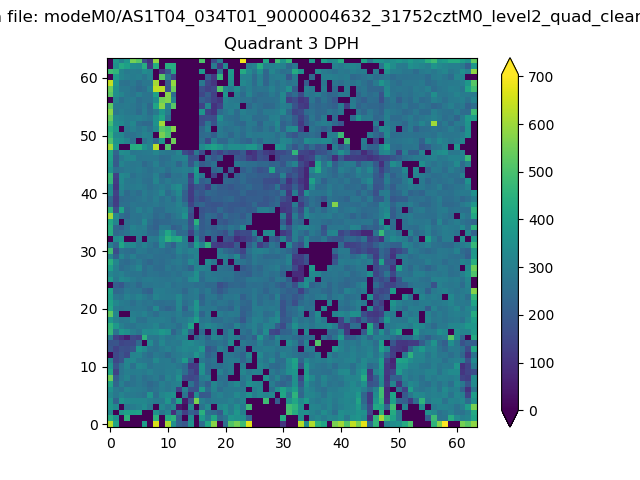 |
 |
Quadrant C |
| Plot type | Count rate plots | Images |
|---|---|---|
| Comparison with Poisson distribution Blue bars denote a histogram of data divided into 1 sec bins. Red curve is a Poisson curve with rate = median count rate of data. |
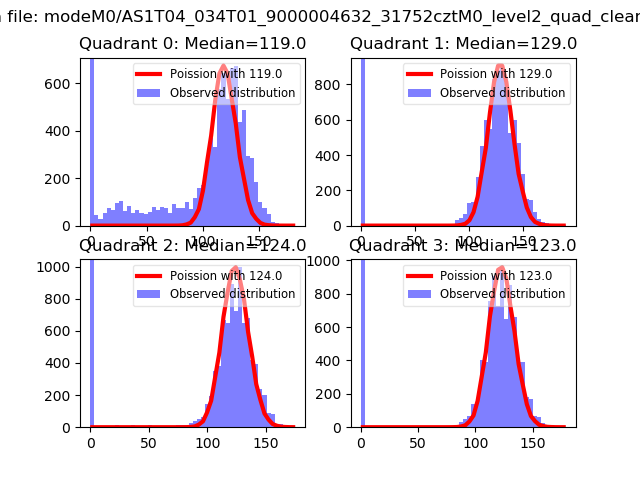 |
 |
| Quadrant-wise count rates Data is divided into 100 sec bins |
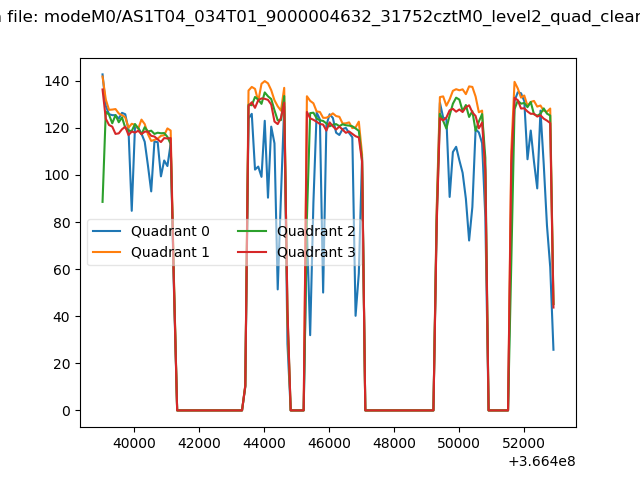 |
|
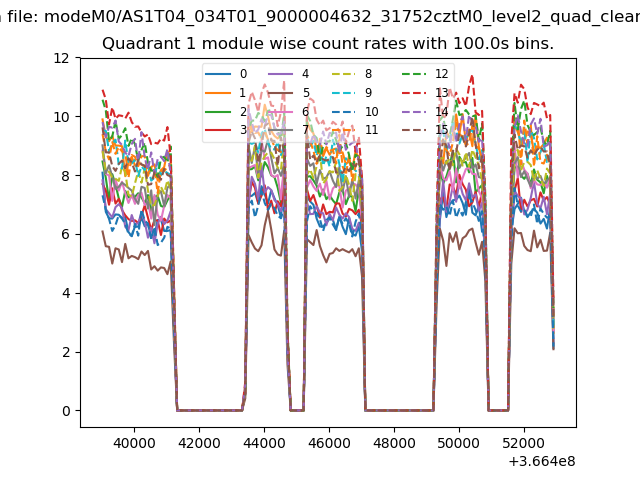
| Module-wise count rates for Quadrant A Data is divided into 100 sec bins |
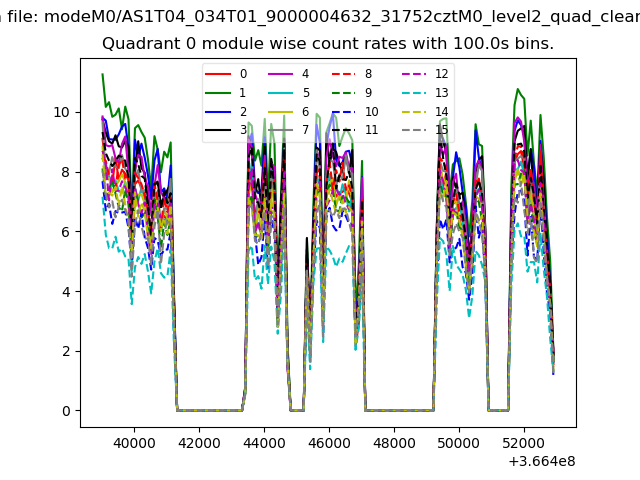 |
 |
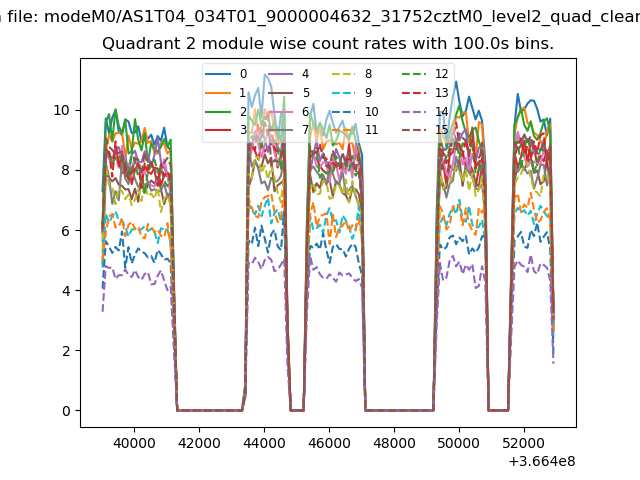
| Module-wise count rates for Quadrant B Data is divided into 100 sec bins |
 |
 |
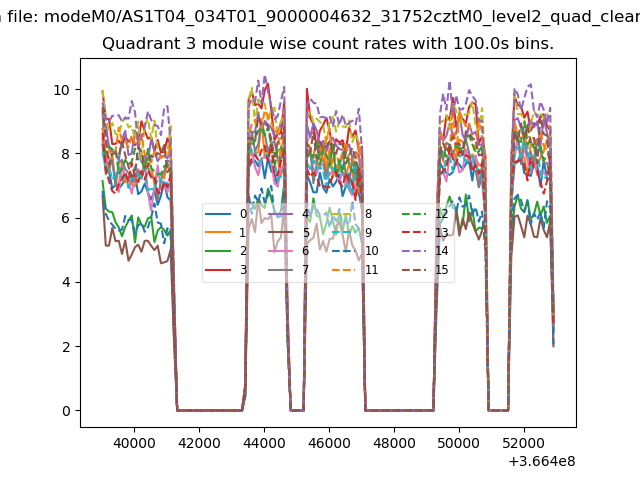
| Module-wise count rates for Quadrant C Data is divided into 100 sec bins |
 |
 |
| Module-wise count rates for Quadrant D Data is divided into 100 sec bins |
 |
 |
| Parameter | Plot |
|---|---|
| CZT HV Monitor | 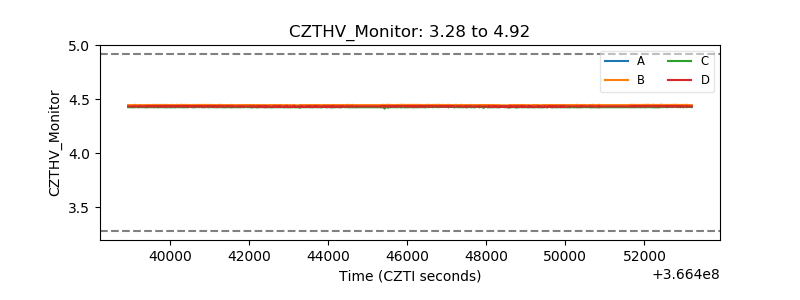 |
| D_VDD |  |
| Temperature 1 | 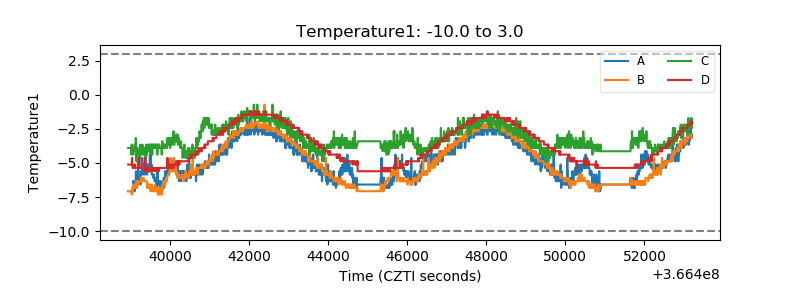 |
| Veto HV Monitor | 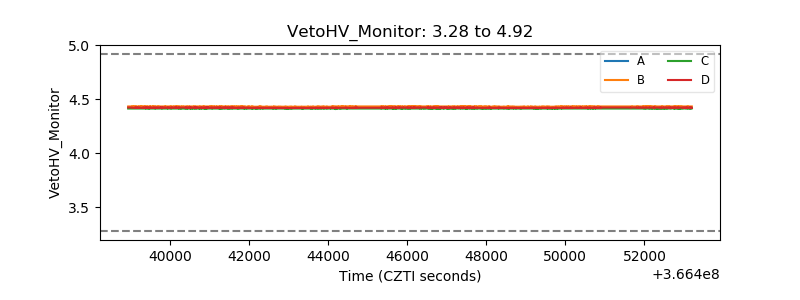 |
| Veto LLD | 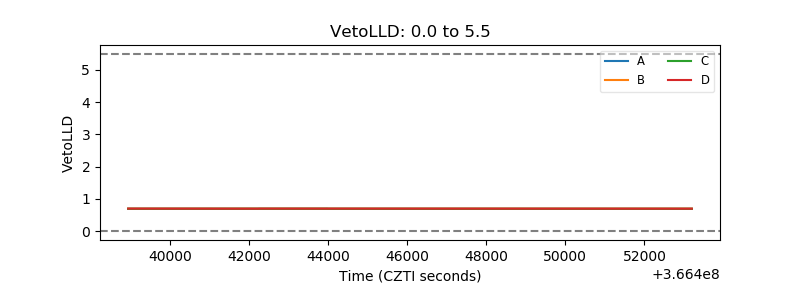 |
| Alpha Counter | 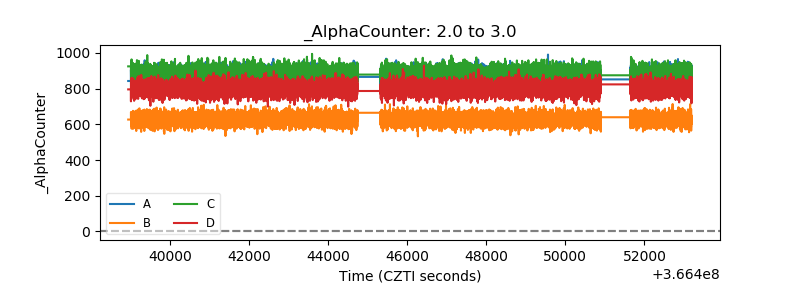 |
| _CPM_Rate | 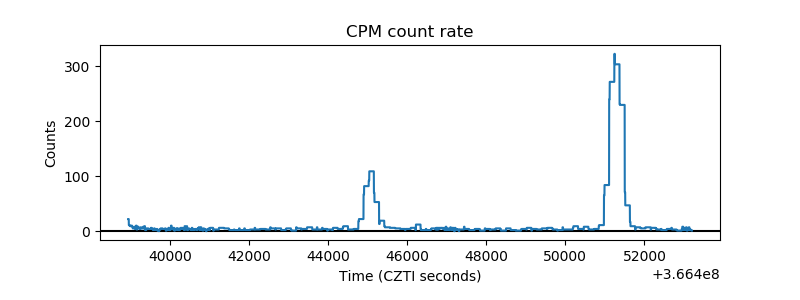 |
| CZT Counter | 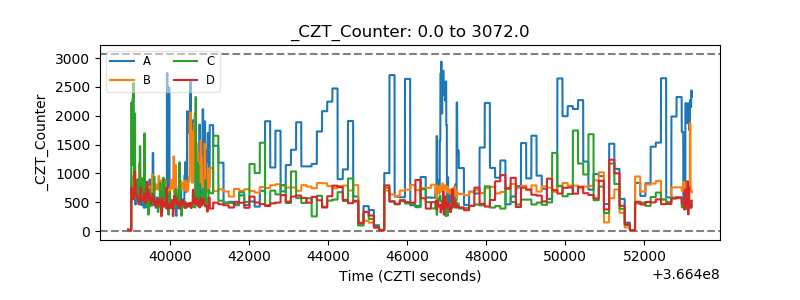 |
| +2.5 Volts monitor | 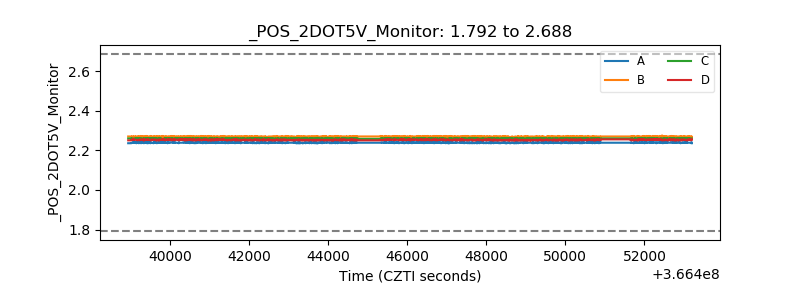 |
| +5 Volts monitor |  |
| _ROLL_ROT | 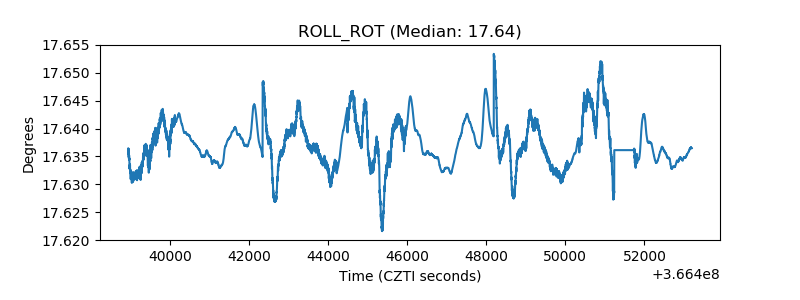 |
| _Roll_DEC | 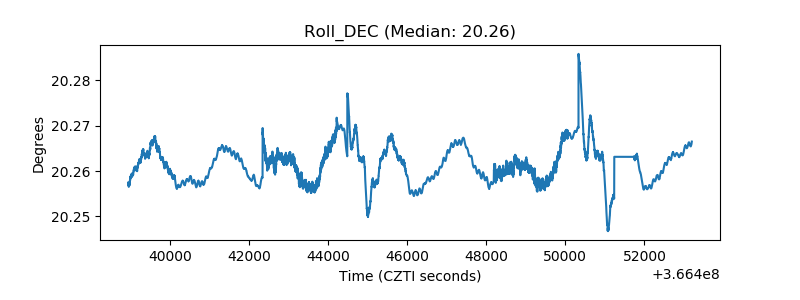 |
| _Roll_RA | 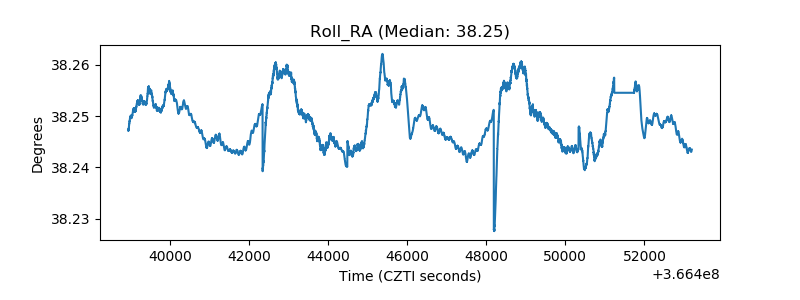 |
| Veto Counter | 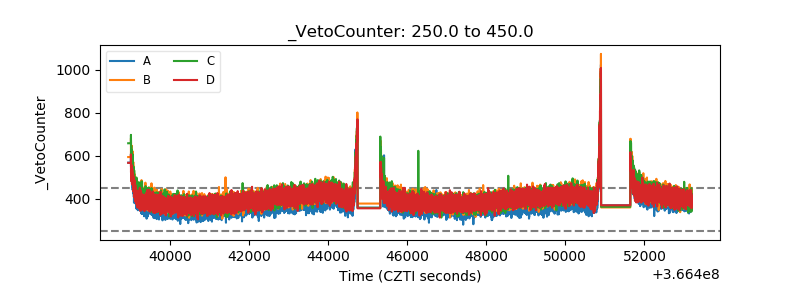 |