| Param | Original file | Final file |
|---|---|---|
| Filename | modeM0/AS1T04_034T01_9000004632_31755cztM0_level2.evt | modeM0/AS1T04_034T01_9000004632_31755cztM0_level2_quad_clean.evt |
| Size (bytes) | 814,236,480 | 54,711,360 |
| Size | 776.5 MB | 52.2 MB |
| Events in quadrant A | 9,785,887 | 243,459 |
| Events in quadrant B | 5,747,675 | 302,719 |
| Events in quadrant C | 4,186,524 | 292,390 |
| Events in quadrant D | 4,433,470 | 296,068 |
| Mode M9 | |||
|---|---|---|---|
| Quadrant | BADHDUFLAG | Total packets | Discarded packets |
| A | 0 | 7 | 4 |
| B | 0 | 6 | 2 |
| C | 0 | 5 | 1 |
| D | 0 | 5 | 2 |
| Mode SS | |||
|---|---|---|---|
| Quadrant | BADHDUFLAG | Total packets | Discarded packets |
| A | 0 | 180 | 26 |
| B | 0 | 181 | 29 |
| C | 0 | 183 | 25 |
| D | 0 | 183 | 29 |
| Mode M0 | |||
|---|---|---|---|
| Quadrant | BADHDUFLAG | Total packets | Discarded packets |
| A | 0 | 42078 | 7911 |
| B | 0 | 27785 | 5015 |
| C | 0 | 20359 | 3377 |
| D | 0 | 21742 | 3966 |
| Quadrant | Total seconds | Saturated seconds | Saturation percentage |
|---|---|---|---|
| A | 7373 | 2478 | 33.609114% |
| B | 7443 | 109 | 1.464463% |
| C | 7536 | 145 | 1.924098% |
| D | 7532 | 80 | 1.062135% |
Noise dominated data is calculated using 1-second bins in cleaned event files. If a bin has >2000 counts, and if more than 50% of those come from <1% of pixels, then it is considered to be noise-dominated and hence unusable.
| Quadrant | # 1 sec bins | Bins with >0 counts | Bins with >2000 counts | High rate bins dominated by noise | Noise dominated (total time) | Noise dominated (detector-on time) | Marked lightcurve |
|---|---|---|---|---|---|---|---|
| A | 13614 | 7529 | 1481 | 1481 | 10.88% | 19.67% | 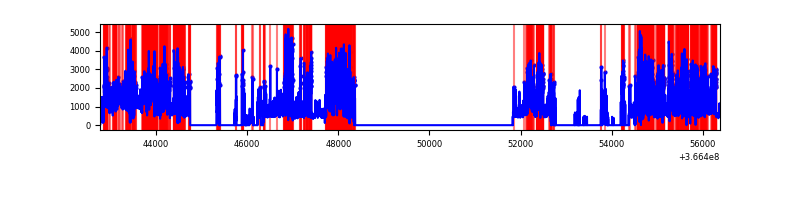 |
| B | 13613 | 7618 | 14 | 14 | 0.10% | 0.18% | 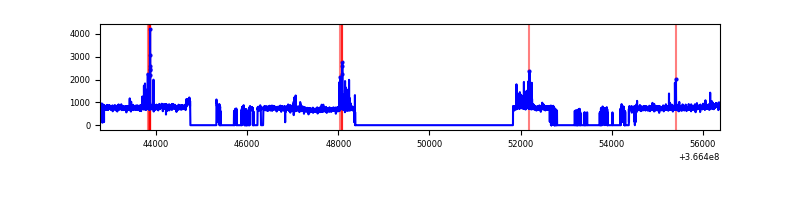 |
| C | 13615 | 7726 | 28 | 28 | 0.21% | 0.36% |  |
| D | 13614 | 7716 | 43 | 43 | 0.32% | 0.56% |  |
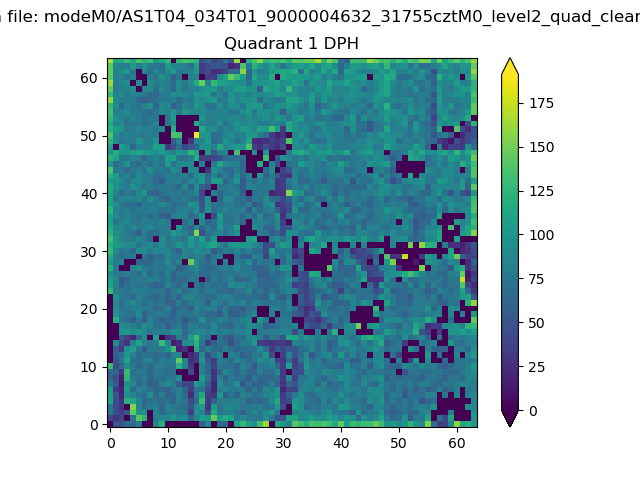
Top three noisy pixels from each quadrant. If the there are fewer than three noisy pixels in the level2.evt file, extra rows are filled as -1
| Pixel properties | Quadrant properties | ||||||
|---|---|---|---|---|---|---|---|
| Quadrant | DetID | PixID | Counts | Sigma | Mean | Median | Sigma |
| A | 0 | 13 | 6862799 | 44592.78 | 757 | 743 | 153.9 |
| A | 13 | 254 | 10801 | 65.36 | 757 | 743 | 153.9 |
| A | 3 | 137 | 7731 | 45.41 | 757 | 743 | 153.9 |
| B | 6 | 159 | 2023916 | 11603.98 | 894 | 869 | 174.3 |
| B | 10 | 245 | 76262 | 432.44 | 894 | 869 | 174.3 |
| B | 15 | 33 | 61586 | 348.26 | 894 | 869 | 174.3 |
| C | 0 | 10 | 409983 | 1978.44 | 877 | 882 | 206.8 |
| C | 3 | 233 | 186535 | 897.83 | 877 | 882 | 206.8 |
| C | 14 | 238 | 140907 | 677.17 | 877 | 882 | 206.8 |
| D | 8 | 195 | 566988 | 2642.67 | 891 | 870 | 214.2 |
| D | 12 | 233 | 330482 | 1538.64 | 891 | 870 | 214.2 |
| D | 2 | 250 | 66624 | 306.94 | 891 | 870 | 214.2 |
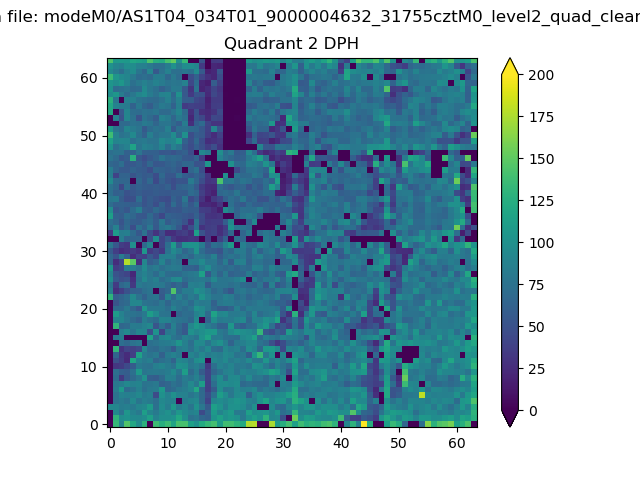
Histogram calculated using DETX and DETY for each event in the final _common_clean file
| Quadrant A | 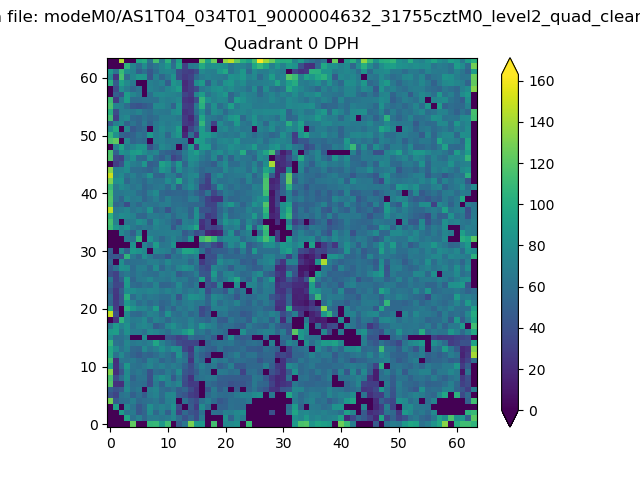 |
 |
Quadrant B |
|---|---|---|---|
| Quadrant D | 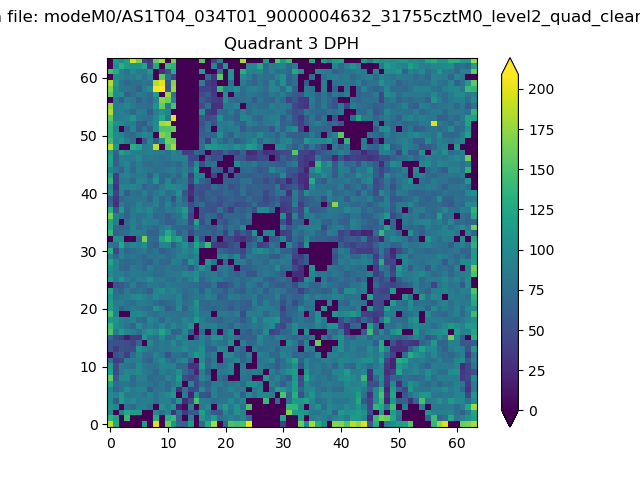 |
 |
Quadrant C |
| Plot type | Count rate plots | Images |
|---|---|---|
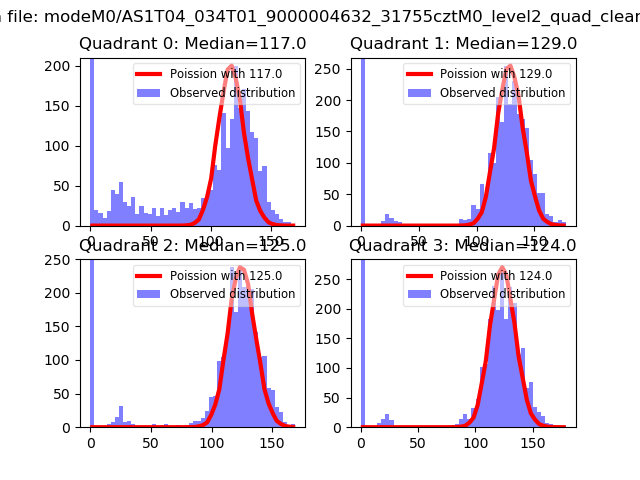
| Comparison with Poisson distribution Blue bars denote a histogram of data divided into 1 sec bins. Red curve is a Poisson curve with rate = median count rate of data. |
 |
 |
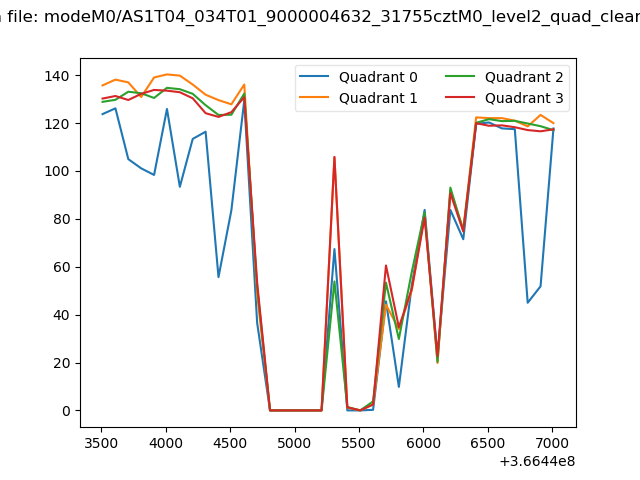
| Quadrant-wise count rates Data is divided into 100 sec bins |
 |
|
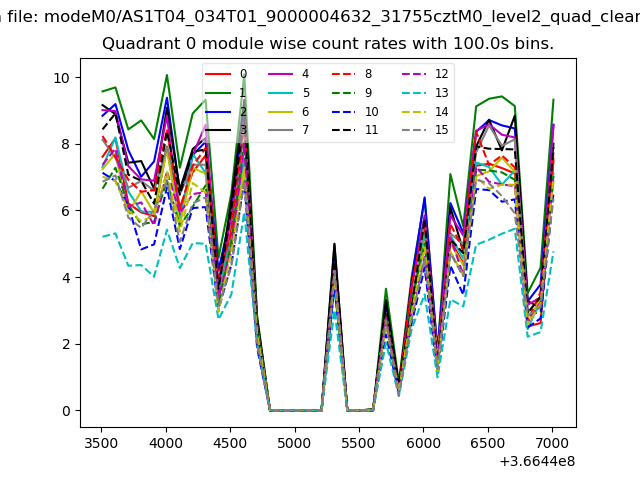
| Module-wise count rates for Quadrant A Data is divided into 100 sec bins |
 |
 |
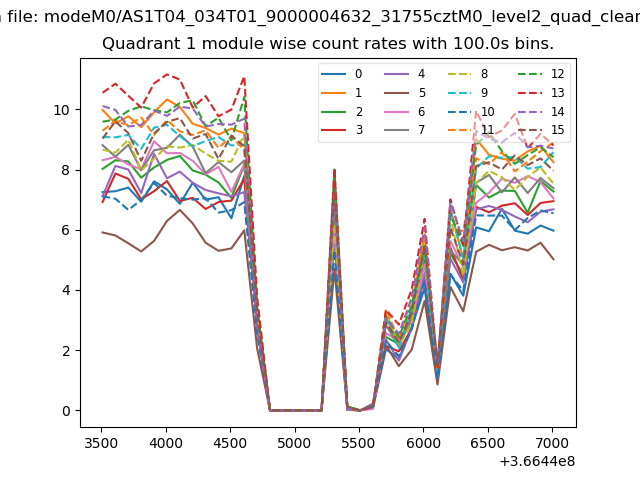
| Module-wise count rates for Quadrant B Data is divided into 100 sec bins |
 |
 |
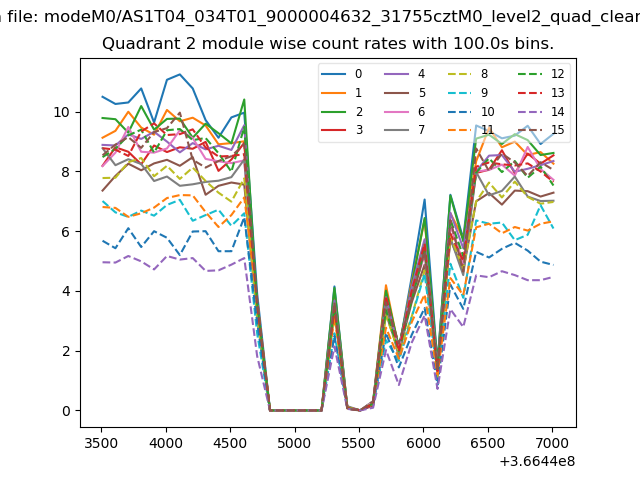
| Module-wise count rates for Quadrant C Data is divided into 100 sec bins |
 |
 |
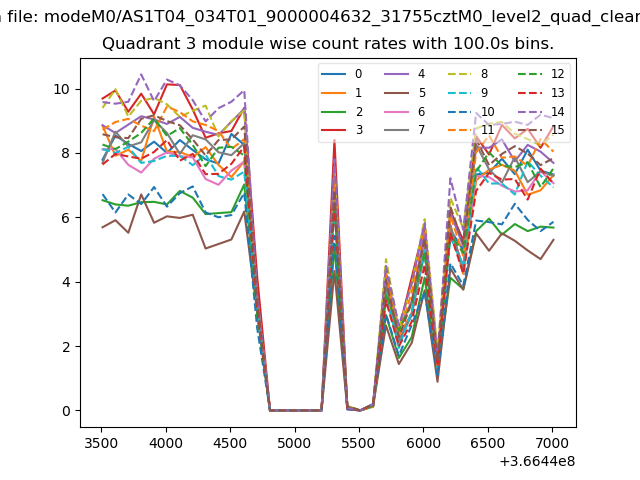
| Module-wise count rates for Quadrant D Data is divided into 100 sec bins |
 |
 |
| Parameter | Plot |
|---|---|
| CZT HV Monitor | 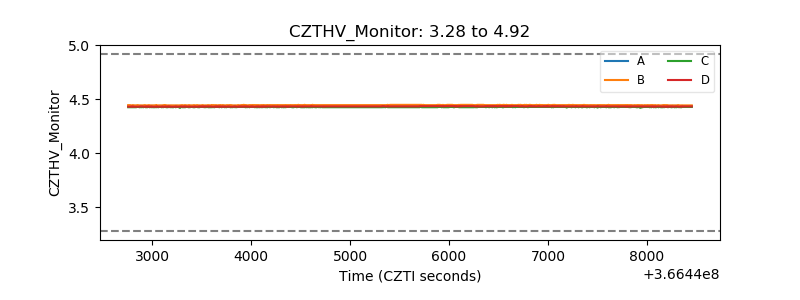 |
| D_VDD | 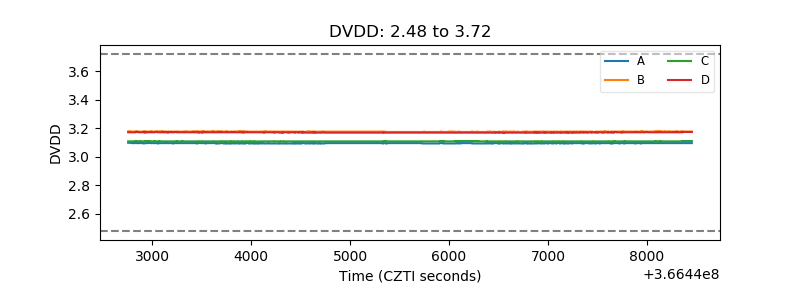 |
| Temperature 1 | 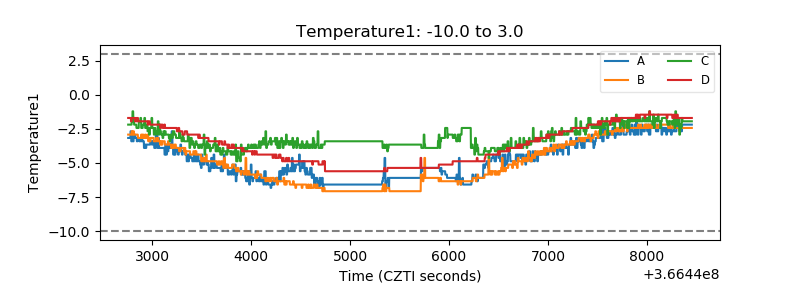 |
| Veto HV Monitor | 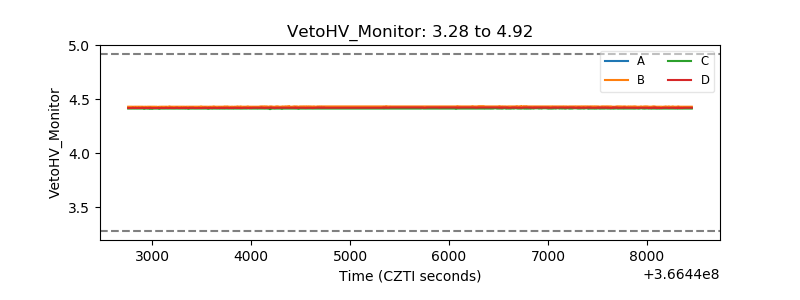 |
| Veto LLD | 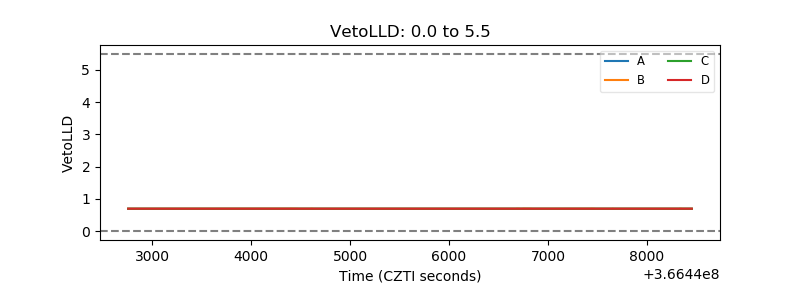 |
| Alpha Counter | 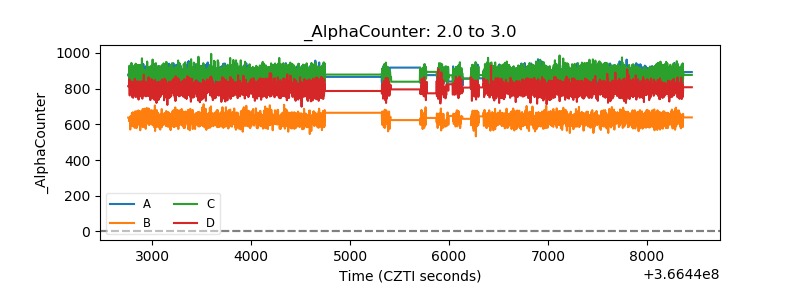 |
| _CPM_Rate | 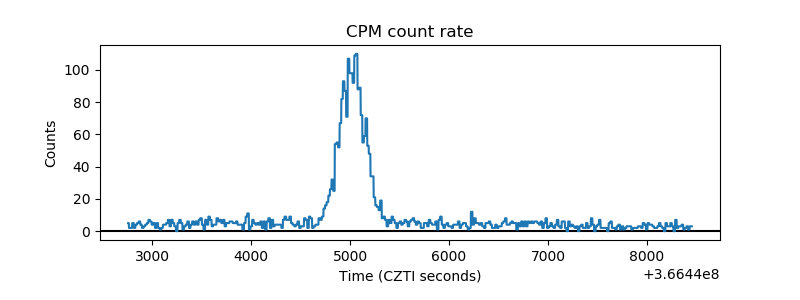 |
| CZT Counter | 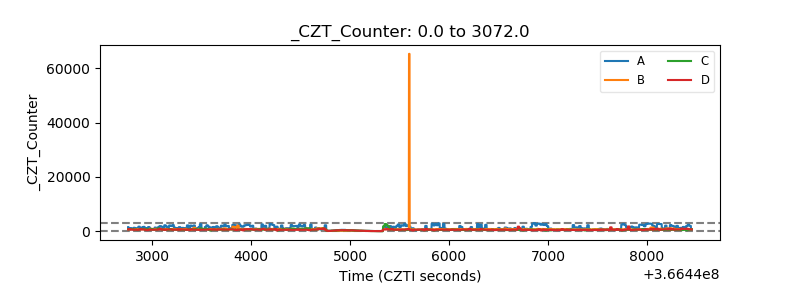 |
| +2.5 Volts monitor |  |
| +5 Volts monitor |  |
| _ROLL_ROT | 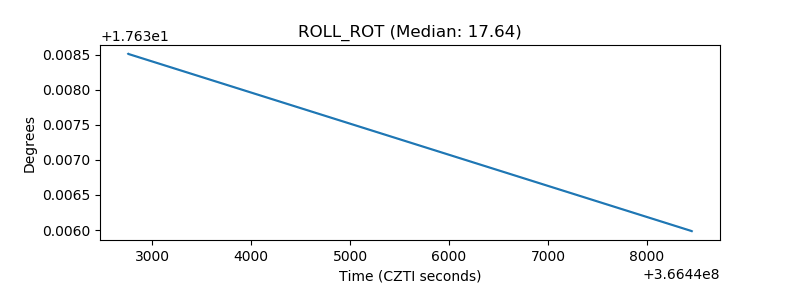 |
| _Roll_DEC | 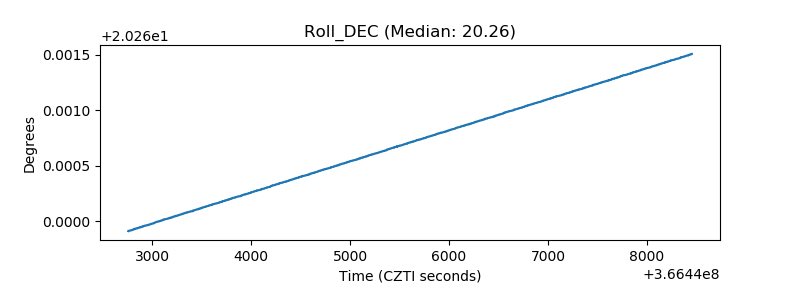 |
| _Roll_RA | 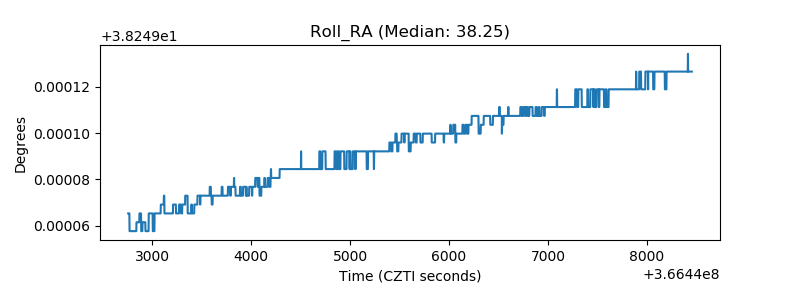 |
| Veto Counter | 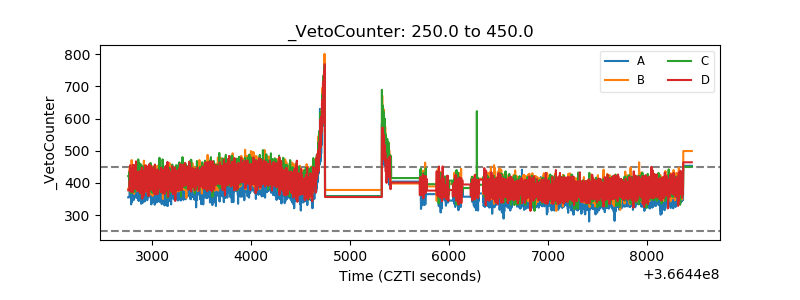 |