| Param | Original file | Final file |
|---|---|---|
| Filename | modeM0/AS1T04_034T01_9000004632_31757cztM0_level2.evt | modeM0/AS1T04_034T01_9000004632_31757cztM0_level2_quad_clean.evt |
| Size (bytes) | 2,251,232,640 | 236,041,920 |
| Size | 2.1 GB | 225.1 MB |
| Events in quadrant A | 25,058,900 | 1,294,020 |
| Events in quadrant B | 16,056,345 | 1,513,296 |
| Events in quadrant C | 13,357,107 | 1,455,868 |
| Events in quadrant D | 12,310,803 | 1,453,200 |
| Mode M9 | |||
|---|---|---|---|
| Quadrant | BADHDUFLAG | Total packets | Discarded packets |
| A | 0 | 16 | 0 |
| B | 0 | 16 | 0 |
| C | 0 | 16 | 0 |
| D | 0 | 16 | 0 |
| Mode SS | |||
|---|---|---|---|
| Quadrant | BADHDUFLAG | Total packets | Discarded packets |
| A | 0 | 422 | 0 |
| B | 0 | 422 | 0 |
| C | 0 | 422 | 0 |
| D | 0 | 422 | 0 |
| Mode M0 | |||
|---|---|---|---|
| Quadrant | BADHDUFLAG | Total packets | Discarded packets |
| A | 0 | 88628 | 3 |
| B | 0 | 63928 | 3 |
| C | 0 | 52973 | 3 |
| D | 0 | 50195 | 3 |
| Quadrant | Total seconds | Saturated seconds | Saturation percentage |
|---|---|---|---|
| A | 20770 | 5837 | 28.103033% |
| B | 20770 | 382 | 1.839191% |
| C | 20770 | 741 | 3.567646% |
| D | 20771 | 218 | 1.049540% |
Noise dominated data is calculated using 1-second bins in cleaned event files. If a bin has >2000 counts, and if more than 50% of those come from <1% of pixels, then it is considered to be noise-dominated and hence unusable.
| Quadrant | # 1 sec bins | Bins with >0 counts | Bins with >2000 counts | High rate bins dominated by noise | Noise dominated (total time) | Noise dominated (detector-on time) | Marked lightcurve |
|---|---|---|---|---|---|---|---|
| A | 22490 | 20772 | 3501 | 3501 | 15.57% | 16.85% | 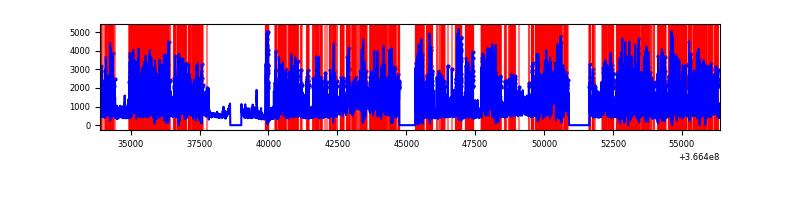 |
| B | 22490 | 20773 | 83 | 83 | 0.37% | 0.40% | 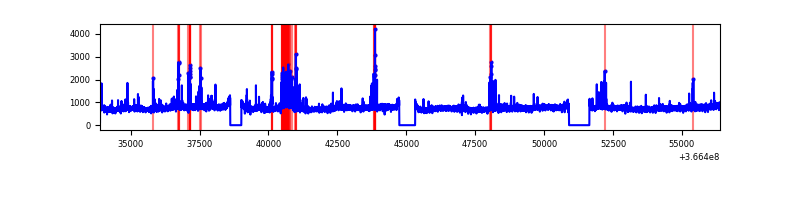 |
| C | 22490 | 20773 | 170 | 170 | 0.76% | 0.82% | 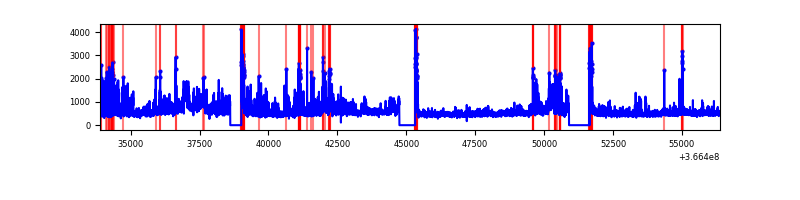 |
| D | 22491 | 20774 | 88 | 88 | 0.39% | 0.42% | 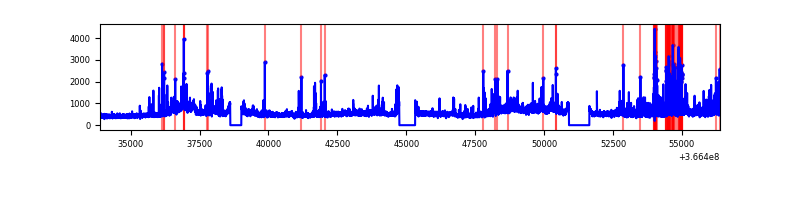 |
Top three noisy pixels from each quadrant. If the there are fewer than three noisy pixels in the level2.evt file, extra rows are filled as -1
| Pixel properties | Quadrant properties | ||||||
|---|---|---|---|---|---|---|---|
| Quadrant | DetID | PixID | Counts | Sigma | Mean | Median | Sigma |
| A | 0 | 13 | 16608927 | 37837.2 | 2190 | 2149 | 438.9 |
| A | 13 | 254 | 31591 | 67.08 | 2190 | 2149 | 438.9 |
| A | 3 | 137 | 22393 | 46.12 | 2190 | 2149 | 438.9 |
| B | 6 | 159 | 5562464 | 11666.57 | 2473 | 2406 | 476.6 |
| B | 4 | 80 | 308308 | 641.87 | 2473 | 2406 | 476.6 |
| B | 10 | 245 | 120540 | 247.88 | 2473 | 2406 | 476.6 |
| C | 0 | 10 | 1830202 | 3282.36 | 2383 | 2399 | 556.9 |
| C | 3 | 233 | 1708804 | 3064.36 | 2383 | 2399 | 556.9 |
| C | 14 | 238 | 396036 | 706.89 | 2383 | 2399 | 556.9 |
| D | 8 | 195 | 2107068 | 3642.66 | 2431 | 2367 | 577.8 |
| D | 12 | 233 | 622897 | 1073.97 | 2431 | 2367 | 577.8 |
| D | 2 | 250 | 231850 | 397.17 | 2431 | 2367 | 577.8 |
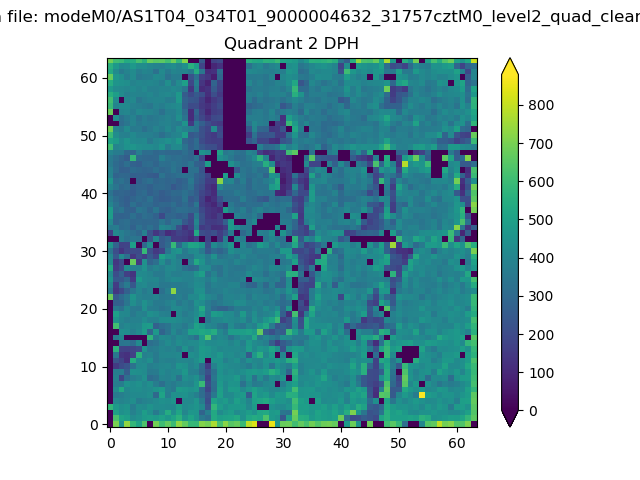
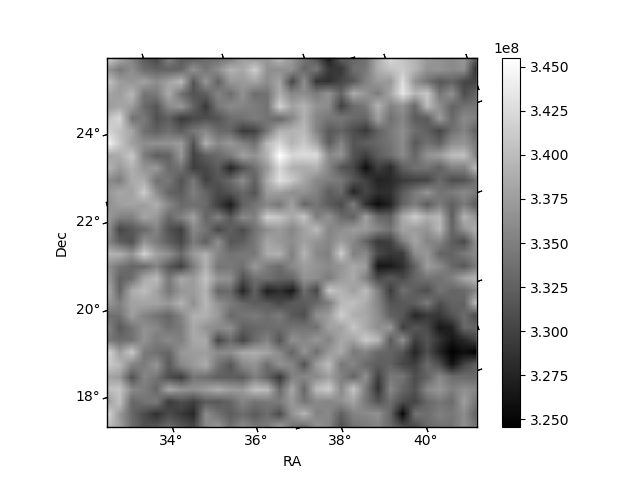
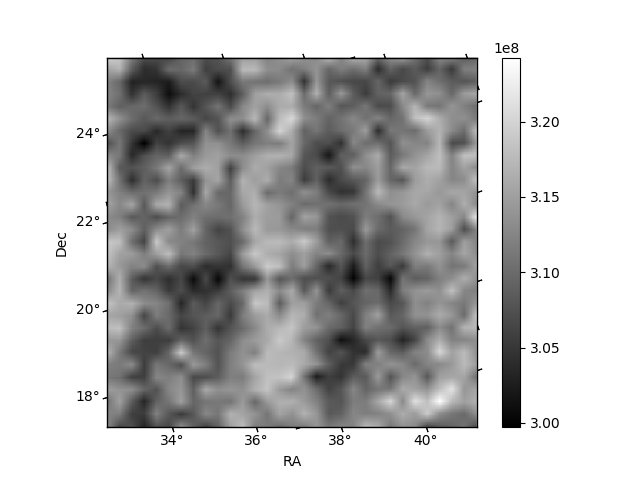
Histogram calculated using DETX and DETY for each event in the final _common_clean file
| Quadrant A | 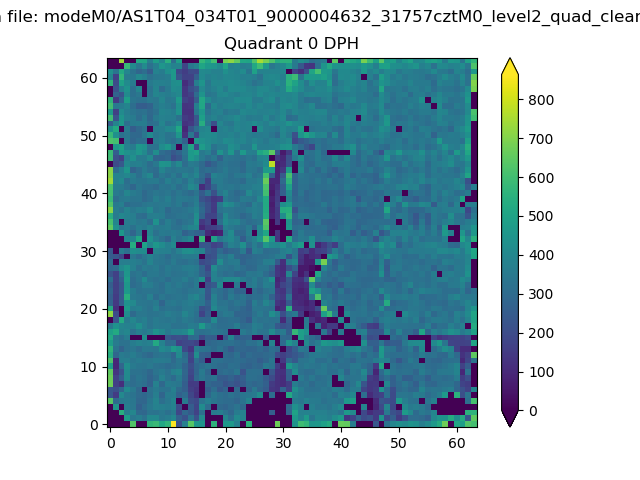 |
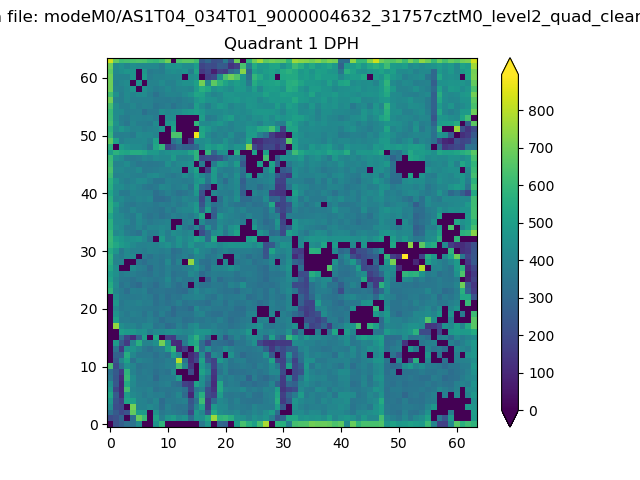 |
Quadrant B |
|---|---|---|---|
| Quadrant D | 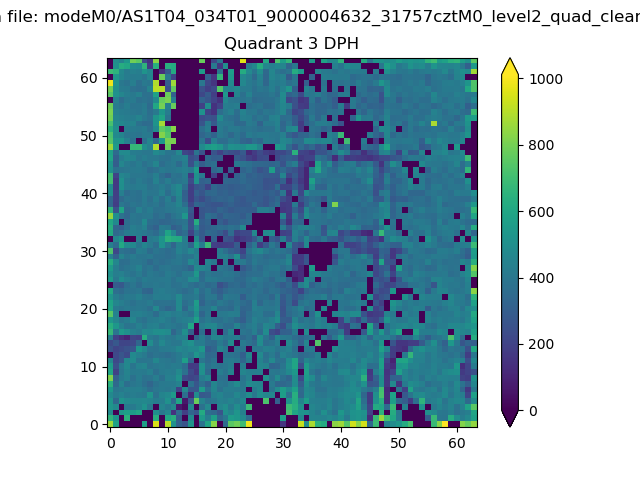 |
 |
Quadrant C |
| Plot type | Count rate plots | Images |
|---|---|---|
| Comparison with Poisson distribution Blue bars denote a histogram of data divided into 1 sec bins. Red curve is a Poisson curve with rate = median count rate of data. |
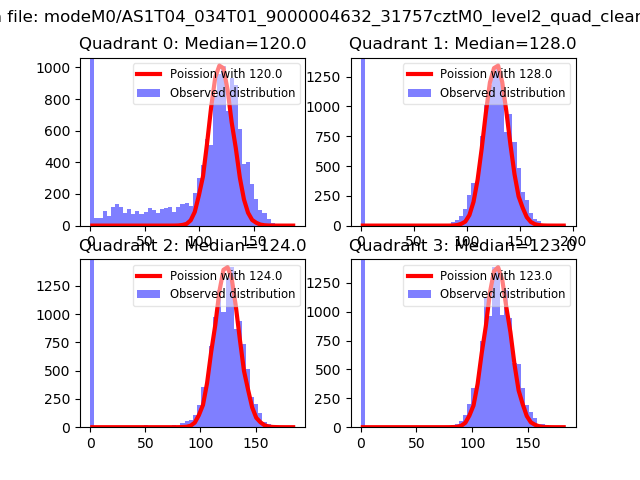 |
 |
| Quadrant-wise count rates Data is divided into 100 sec bins |
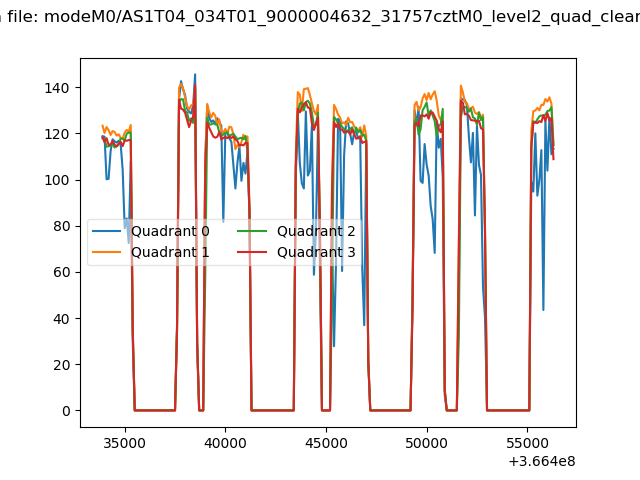 |
|
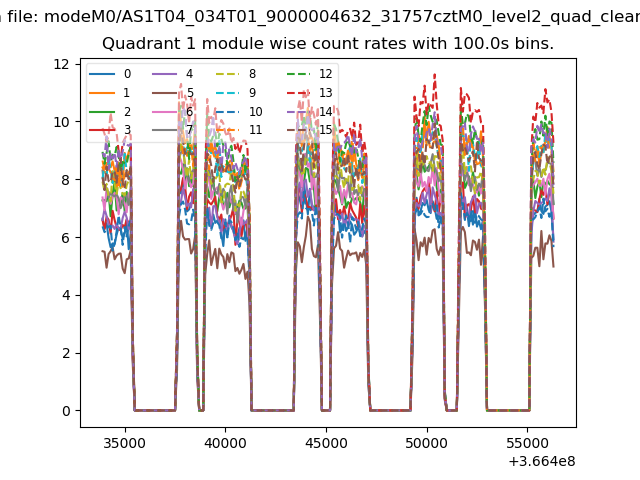
| Module-wise count rates for Quadrant A Data is divided into 100 sec bins |
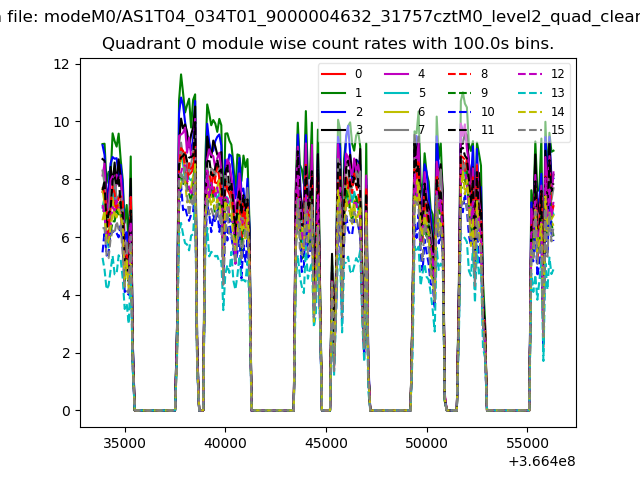 |
 |
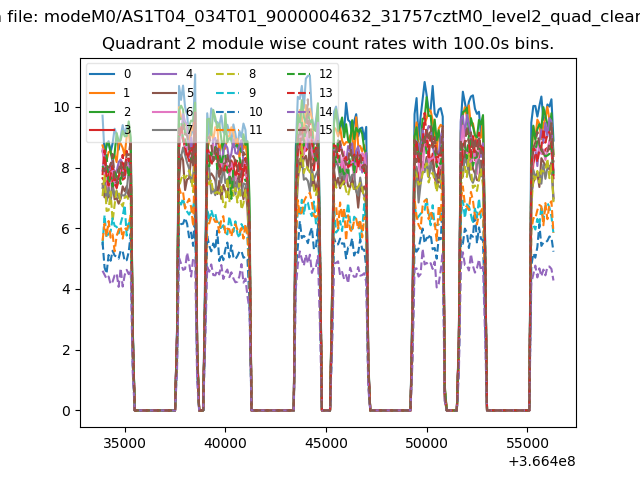
| Module-wise count rates for Quadrant B Data is divided into 100 sec bins |
 |
 |
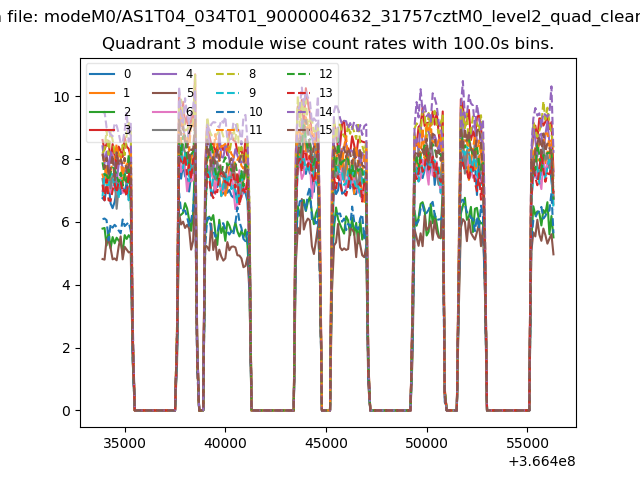
| Module-wise count rates for Quadrant C Data is divided into 100 sec bins |
 |
 |
| Module-wise count rates for Quadrant D Data is divided into 100 sec bins |
 |
 |
| Parameter | Plot |
|---|---|
| CZT HV Monitor | 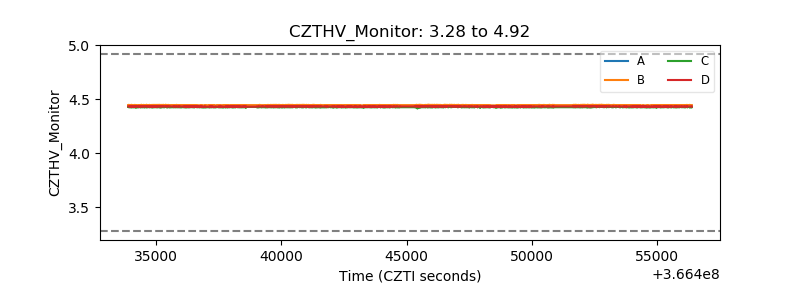 |
| D_VDD | 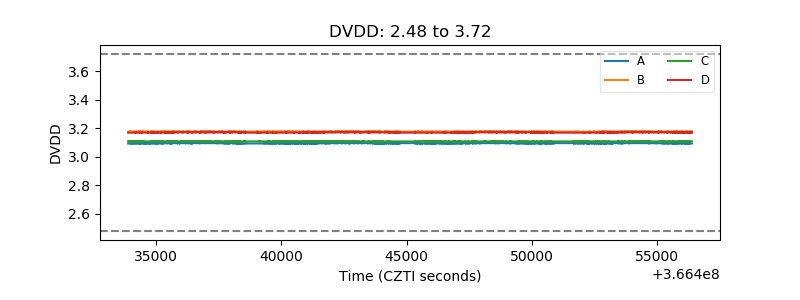 |
| Temperature 1 | 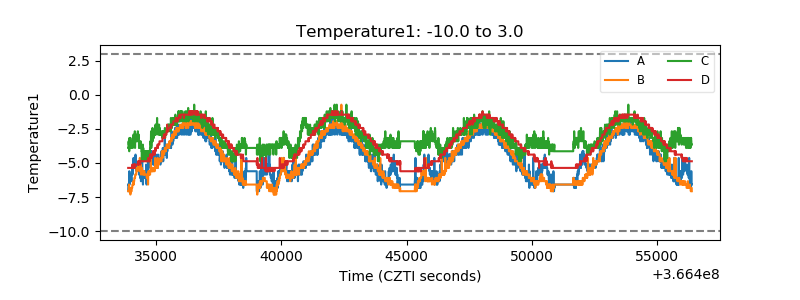 |
| Veto HV Monitor |  |
| Veto LLD | 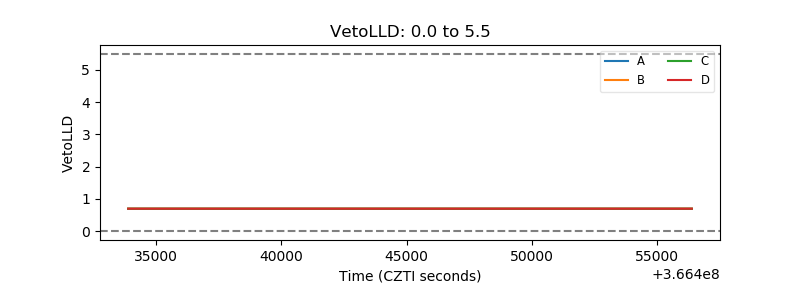 |
| Alpha Counter | 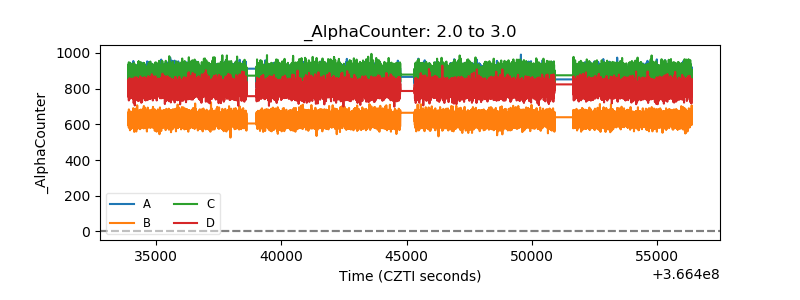 |
| _CPM_Rate | 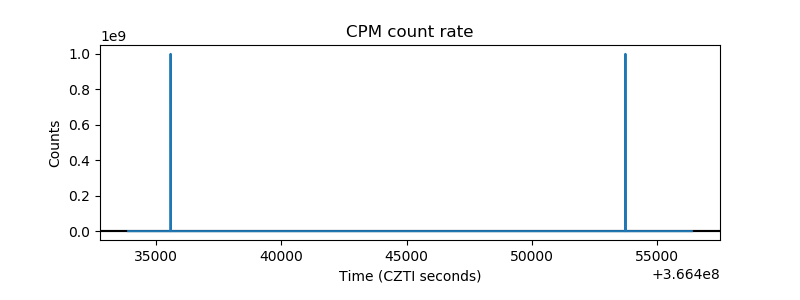 |
| CZT Counter | 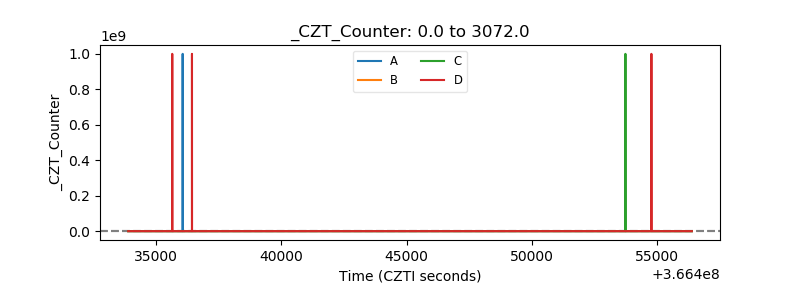 |
| +2.5 Volts monitor |  |
| +5 Volts monitor |  |
| _ROLL_ROT | 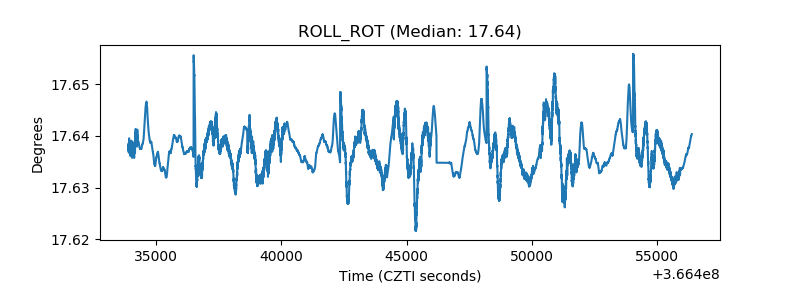 |
| _Roll_DEC | 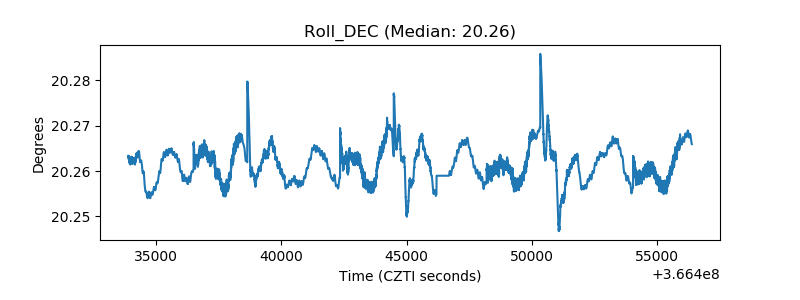 |
| _Roll_RA |  |
| Veto Counter |  |