| Param | Original file | Final file |
|---|---|---|
| Filename | modeM0/AS1T04_034T01_9000004632_31897cztM0_level2.evt | modeM0/AS1T04_034T01_9000004632_31897cztM0_level2_quad_clean.evt |
| Size (bytes) | 344,226,240 | 50,443,200 |
| Size | 328.3 MB | 48.1 MB |
| Events in quadrant A | 1,706,419 | 331,241 |
| Events in quadrant B | 2,679,802 | 325,535 |
| Events in quadrant C | 3,285,722 | 311,525 |
| Events in quadrant D | 2,517,530 | 313,378 |
| Mode M9 | |||
|---|---|---|---|
| Quadrant | BADHDUFLAG | Total packets | Discarded packets |
| A | 0 | 6 | 0 |
| B | 0 | 6 | 0 |
| C | 0 | 6 | 0 |
| D | 0 | 6 | 0 |
| Mode SS | |||
|---|---|---|---|
| Quadrant | BADHDUFLAG | Total packets | Discarded packets |
| A | 0 | 75 | 1 |
| B | 0 | 74 | 0 |
| C | 0 | 74 | 0 |
| D | 0 | 74 | 0 |
| Mode M0 | |||
|---|---|---|---|
| Quadrant | BADHDUFLAG | Total packets | Discarded packets |
| A | 0 | 7359 | 232 |
| B | 0 | 10892 | 378 |
| C | 0 | 12563 | 315 |
| D | 0 | 10129 | 291 |
| Quadrant | Total seconds | Saturated seconds | Saturation percentage |
|---|---|---|---|
| A | 3458 | 28 | 0.809717% |
| B | 3450 | 67 | 1.942029% |
| C | 3449 | 272 | 7.886344% |
| D | 3451 | 82 | 2.376123% |
Noise dominated data is calculated using 1-second bins in cleaned event files. If a bin has >2000 counts, and if more than 50% of those come from <1% of pixels, then it is considered to be noise-dominated and hence unusable.
| Quadrant | # 1 sec bins | Bins with >0 counts | Bins with >2000 counts | High rate bins dominated by noise | Noise dominated (total time) | Noise dominated (detector-on time) | Marked lightcurve |
|---|---|---|---|---|---|---|---|
| A | 4257 | 3481 | 0 | 0 | 0.00% | 0.00% |  |
| B | 4254 | 3472 | 6 | 6 | 0.14% | 0.17% |  |
| C | 4251 | 3473 | 64 | 64 | 1.51% | 1.84% |  |
| D | 4252 | 3475 | 53 | 53 | 1.25% | 1.53% |  |
Top three noisy pixels from each quadrant. If the there are fewer than three noisy pixels in the level2.evt file, extra rows are filled as -1
| Pixel properties | Quadrant properties | ||||||
|---|---|---|---|---|---|---|---|
| Quadrant | DetID | PixID | Counts | Sigma | Mean | Median | Sigma |
| A | 15 | 174 | 6533 | 68.5 | 437 | 429 | 89.1 |
| A | 3 | 1 | 6259 | 65.42 | 437 | 429 | 89.1 |
| A | 13 | 254 | 5632 | 58.39 | 437 | 429 | 89.1 |
| B | 6 | 159 | 939141 | 11159.81 | 427 | 416 | 84.1 |
| B | 0 | 229 | 30577 | 358.56 | 427 | 416 | 84.1 |
| B | 10 | 245 | 14124 | 162.96 | 427 | 416 | 84.1 |
| C | 3 | 233 | 1471031 | 15141.74 | 406 | 407 | 97.1 |
| C | 0 | 10 | 149239 | 1532.39 | 406 | 407 | 97.1 |
| C | 14 | 238 | 66121 | 676.6 | 406 | 407 | 97.1 |
| D | 8 | 195 | 538574 | 5287.52 | 417 | 404 | 101.8 |
| D | 12 | 233 | 161937 | 1587.06 | 417 | 404 | 101.8 |
| D | 7 | 238 | 146523 | 1435.62 | 417 | 404 | 101.8 |
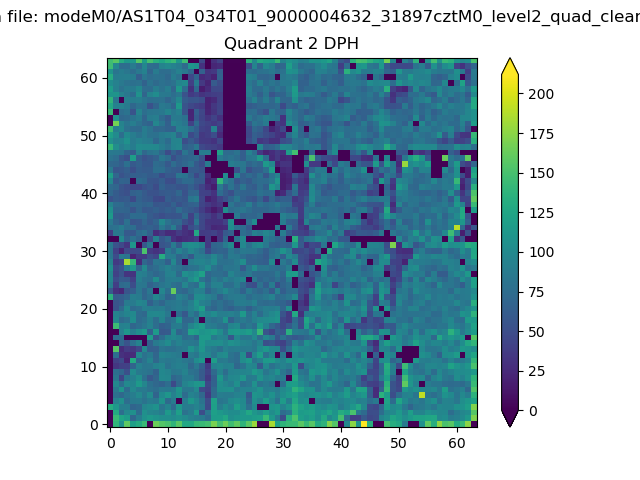
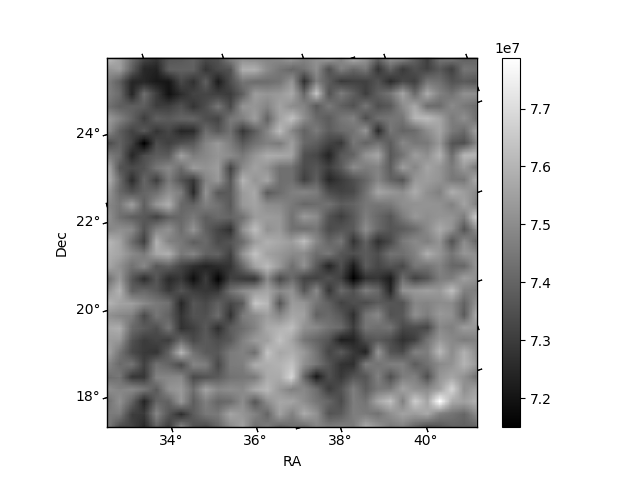
Histogram calculated using DETX and DETY for each event in the final _common_clean file
| Quadrant A | 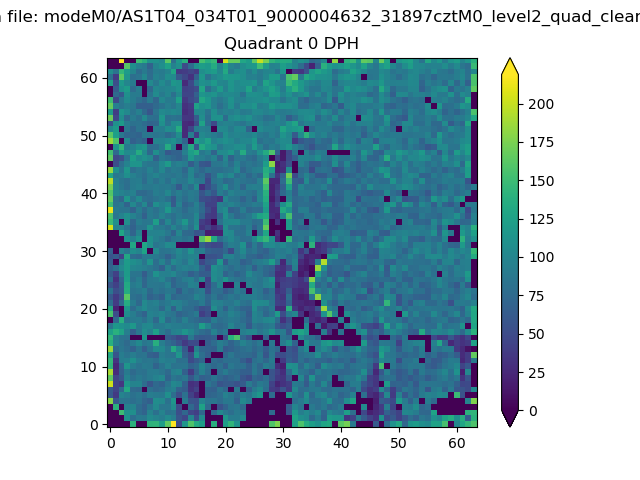 |
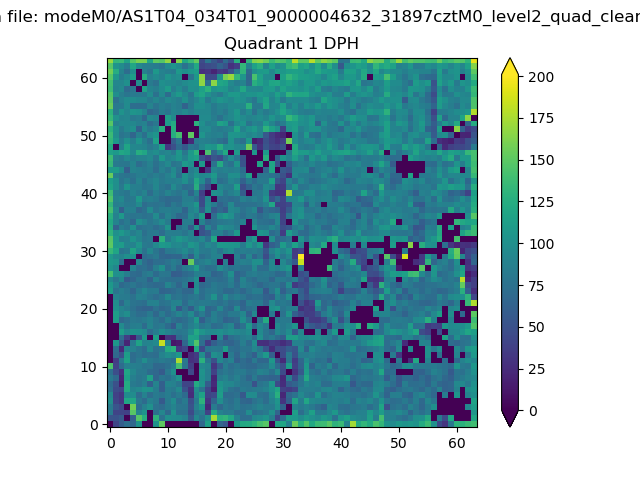 |
Quadrant B |
|---|---|---|---|
| Quadrant D | 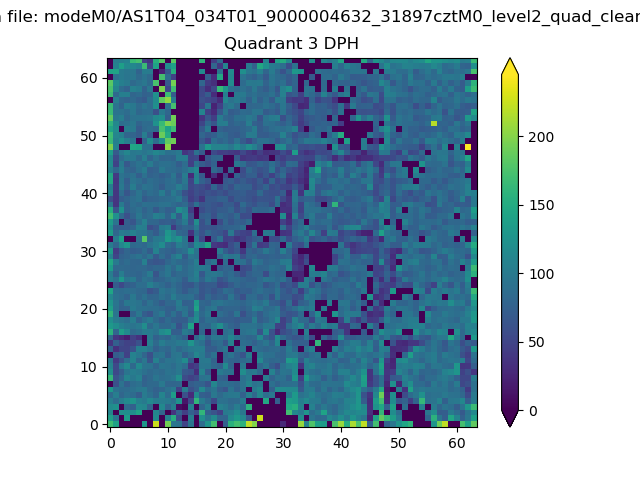 |
 |
Quadrant C |
| Plot type | Count rate plots | Images |
|---|---|---|
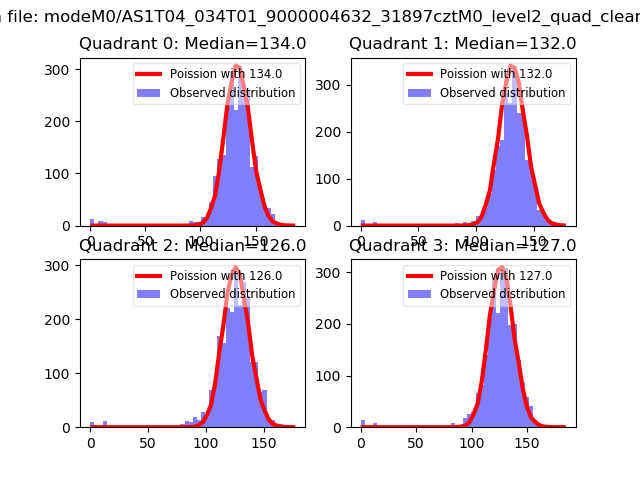
| Comparison with Poisson distribution Blue bars denote a histogram of data divided into 1 sec bins. Red curve is a Poisson curve with rate = median count rate of data. |
 |
 |
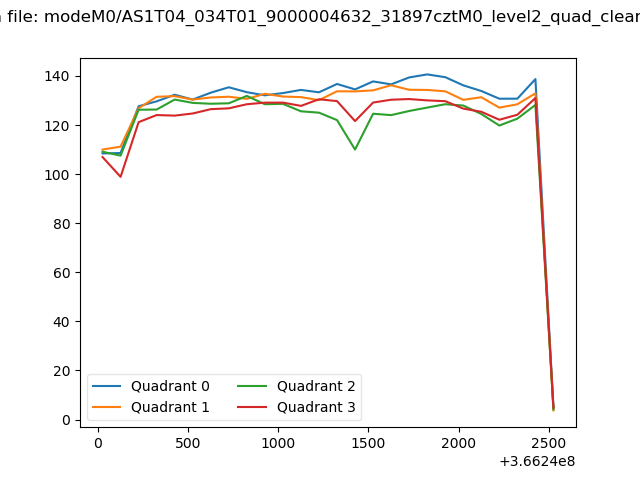
| Quadrant-wise count rates Data is divided into 100 sec bins |
 |
|
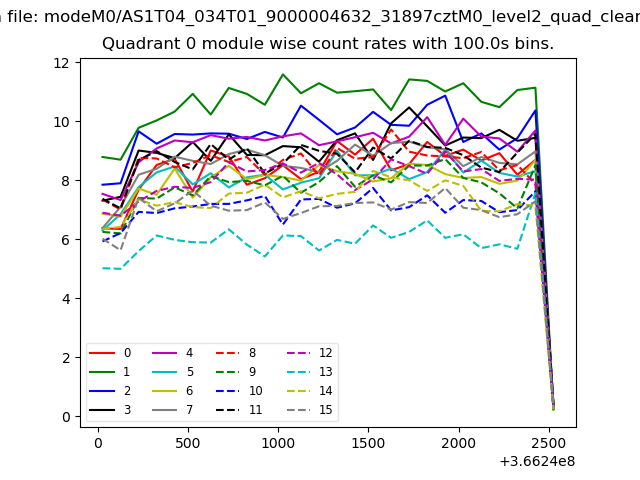
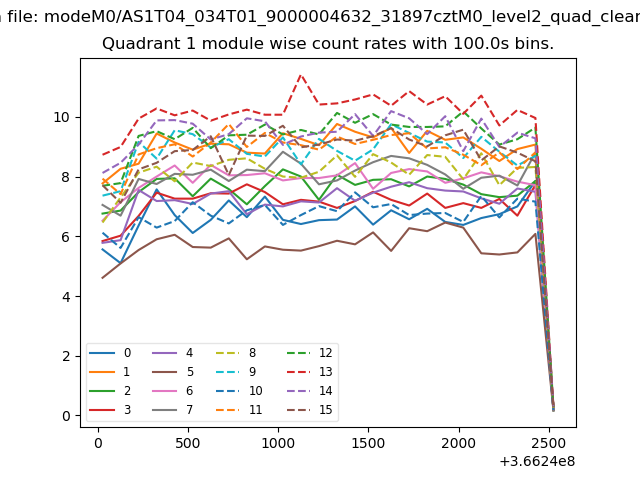
| Module-wise count rates for Quadrant A Data is divided into 100 sec bins |
 |
 |
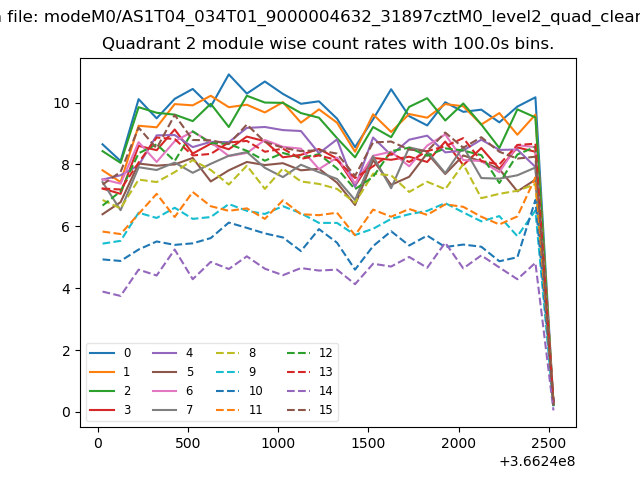
| Module-wise count rates for Quadrant B Data is divided into 100 sec bins |
 |
 |
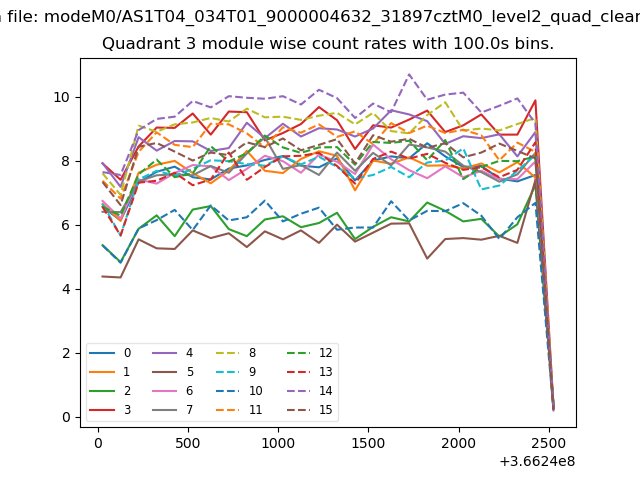
| Module-wise count rates for Quadrant C Data is divided into 100 sec bins |
 |
 |
| Module-wise count rates for Quadrant D Data is divided into 100 sec bins |
 |
 |
| Parameter | Plot |
|---|---|
| CZT HV Monitor | 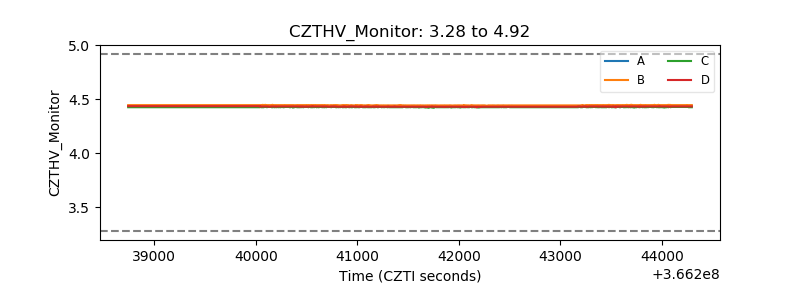 |
| D_VDD | 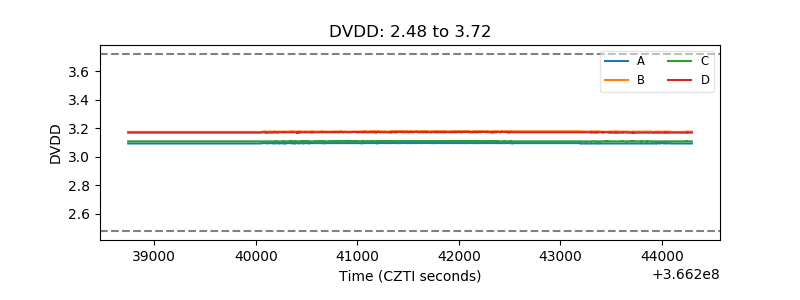 |
| Temperature 1 | 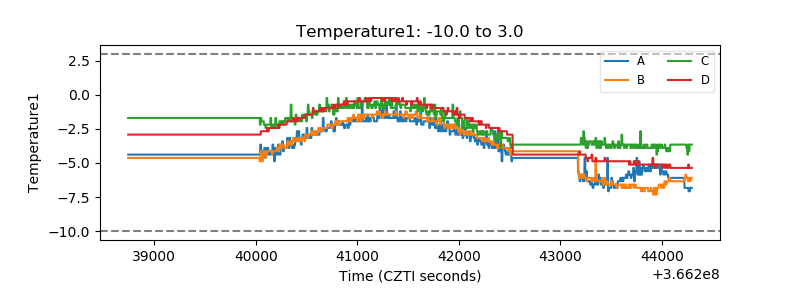 |
| Veto HV Monitor | 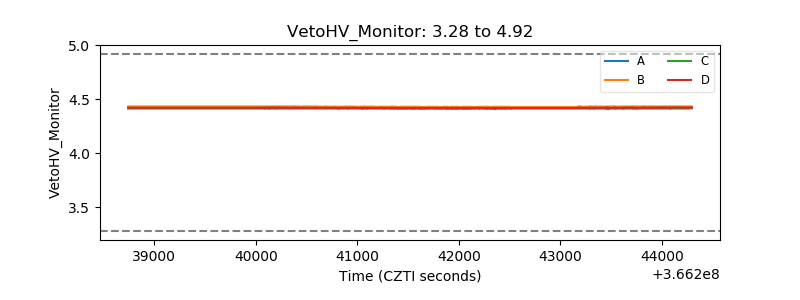 |
| Veto LLD | 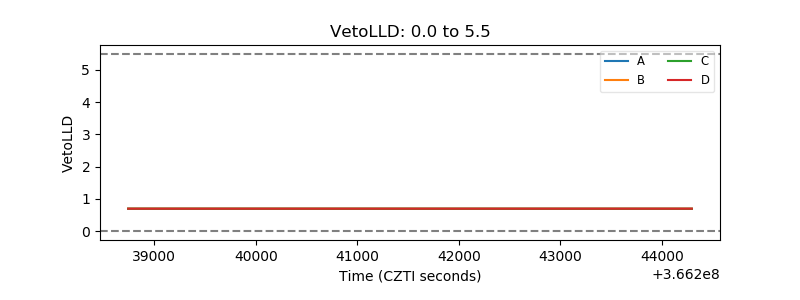 |
| Alpha Counter | 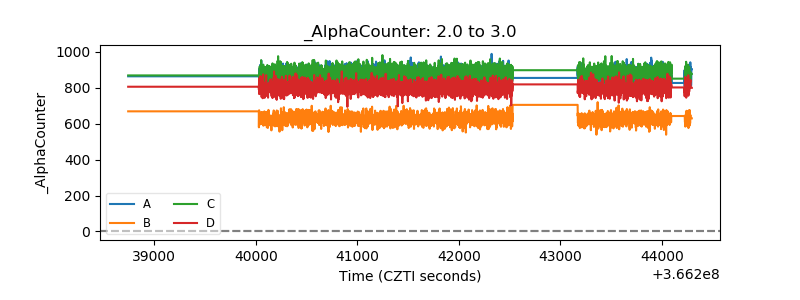 |
| _CPM_Rate | 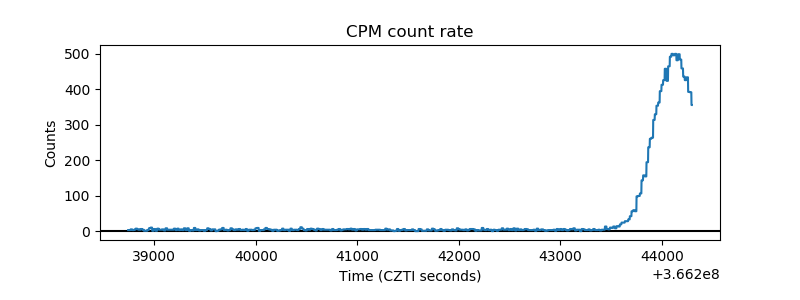 |
| CZT Counter | 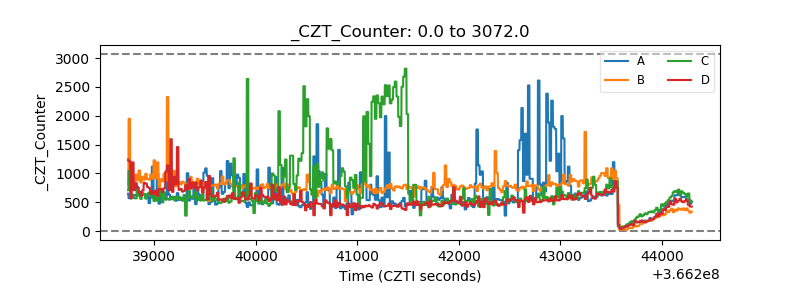 |
| +2.5 Volts monitor |  |
| +5 Volts monitor |  |
| _ROLL_ROT | 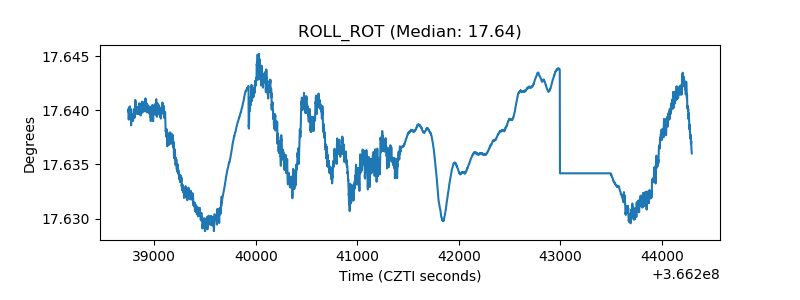 |
| _Roll_DEC | 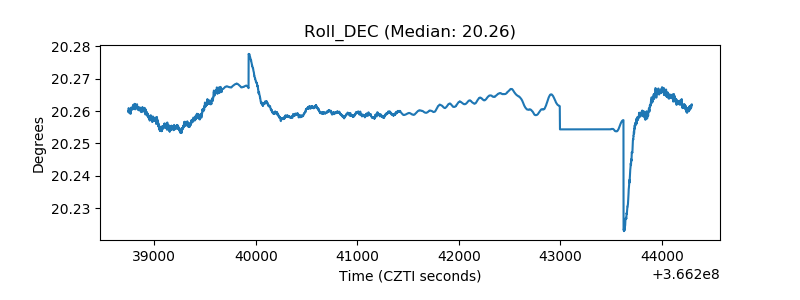 |
| _Roll_RA | 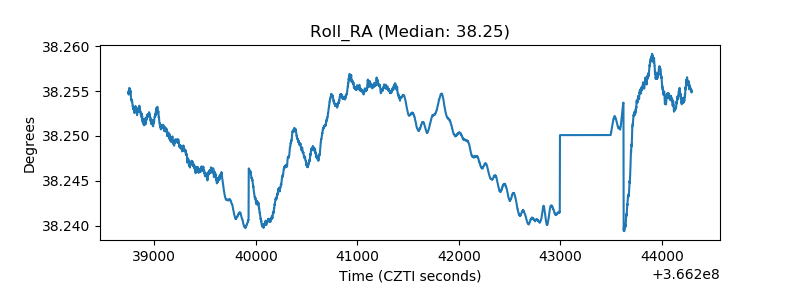 |
| Veto Counter | 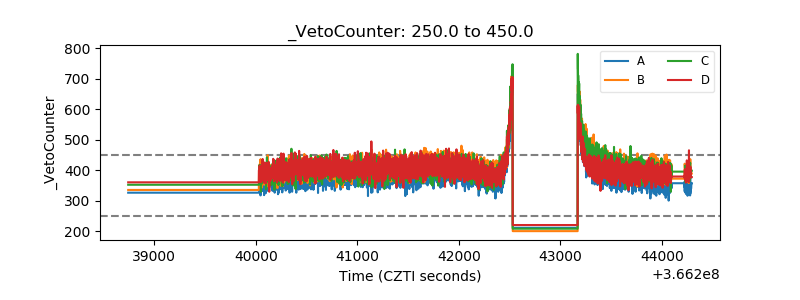 |