| Param | Original file | Final file |
|---|---|---|
| Filename | modeM0/AS1A10_059T01_9000004634cztM0_level2.fits | modeM0/AS1A10_059T01_9000004634cztM0_level2_quad_clean.evt |
| Size (bytes) | 335,534,400 | 185,351,040 |
| Size | 320.0 MB | 176.8 MB |
| Events in quadrant A | 1,954,332 | 833,026 |
| Events in quadrant B | 2,059,886 | 886,867 |
| Events in quadrant C | 1,988,008 | 781,542 |
| Events in quadrant D | 1,876,730 | 833,310 |
| Mode M9 | |||
|---|---|---|---|
| Quadrant | BADHDUFLAG | Total packets | Discarded packets |
| A | 0 | 74 | 0 |
| B | 0 | 74 | 0 |
| C | 0 | 74 | 0 |
| D | 0 | 74 | 0 |
| Mode SS | |||
|---|---|---|---|
| Quadrant | BADHDUFLAG | Total packets | Discarded packets |
| A | 0 | 676 | 0 |
| B | 0 | 676 | 0 |
| C | 0 | 676 | 0 |
| D | 0 | 676 | 0 |
| Mode M0 | |||
|---|---|---|---|
| Quadrant | BADHDUFLAG | Total packets | Discarded packets |
| A | 0 | 134208 | 0 |
| B | 0 | 114851 | 0 |
| C | 0 | 116581 | 0 |
| D | 0 | 98852 | 0 |
| Quadrant | Total seconds | Saturated seconds | Saturation percentage |
|---|---|---|---|
| A | 33094 | 8559 | 25.862694% |
| B | 33104 | 2528 | 7.636539% |
| C | 33113 | 5676 | 17.141304% |
| D | 33093 | 1522 | 4.599160% |
Noise dominated data is calculated using 1-second bins in cleaned event files. If a bin has >2000 counts, and if more than 50% of those come from <1% of pixels, then it is considered to be noise-dominated and hence unusable.
| Quadrant | # 1 sec bins | Bins with >0 counts | Bins with >2000 counts | High rate bins dominated by noise | Noise dominated (total time) | Noise dominated (detector-on time) | Marked lightcurve |
|---|---|---|---|---|---|---|---|
| A | 42329 | 32982 | 0 | 0 | 0.00% | 0.00% |  |
| B | 42329 | 33112 | 0 | 0 | 0.00% | 0.00% |  |
| C | 42329 | 33117 | 0 | 0 | 0.00% | 0.00% |  |
| D | 42329 | 33108 | 0 | 0 | 0.00% | 0.00% |  |
Top three noisy pixels from each quadrant. If the there are fewer than three noisy pixels in the level2.evt file, extra rows are filled as -1
| Pixel properties | Quadrant properties | ||||||
|---|---|---|---|---|---|---|---|
| Quadrant | DetID | PixID | Counts | Sigma | Mean | Median | Sigma |
| A | 0 | 29 | 1667 | 9.51 | 510 | 485 | 124.2 |
| A | 7 | 110 | 1527 | 8.39 | 510 | 485 | 124.2 |
| A | 9 | 19 | 1443 | 7.71 | 510 | 485 | 124.2 |
| B | 2 | 9 | 1603 | 10.01 | 547 | 526 | 107.6 |
| B | 3 | 80 | 1401 | 8.13 | 547 | 526 | 107.6 |
| B | 5 | 128 | 1381 | 7.94 | 547 | 526 | 107.6 |
| C | 3 | 202 | 1506 | 7.62 | 526 | 497 | 132.4 |
| C | 3 | 203 | 1451 | 7.21 | 526 | 497 | 132.4 |
| C | 3 | 187 | 1426 | 7.02 | 526 | 497 | 132.4 |
| D | 6 | 67 | 1381 | 6.37 | 537 | 493 | 139.3 |
| D | 10 | 189 | 1346 | 6.12 | 537 | 493 | 139.3 |
| D | 15 | 47 | 1332 | 6.02 | 537 | 493 | 139.3 |
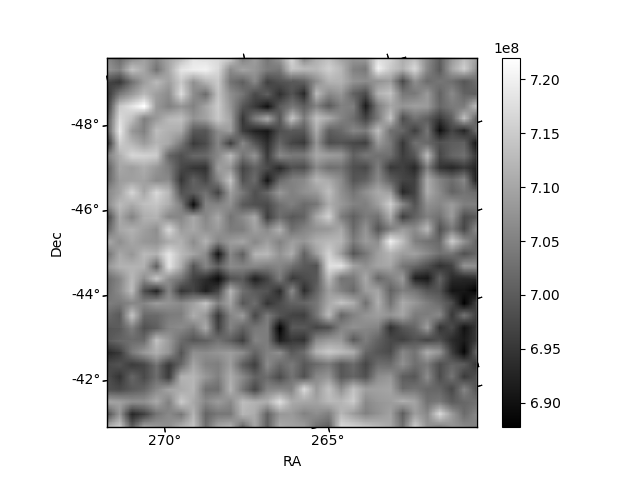
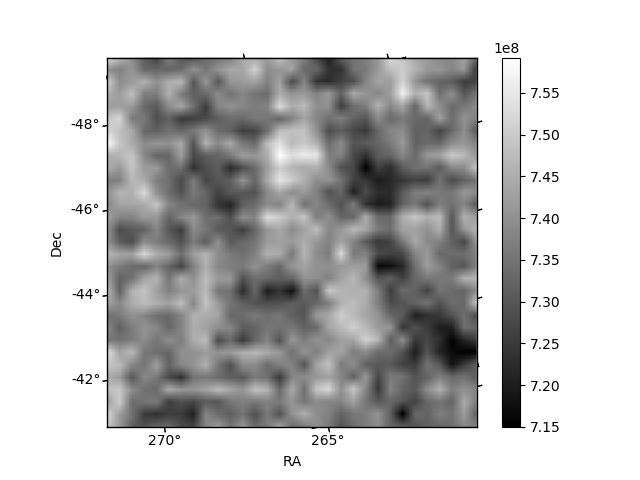
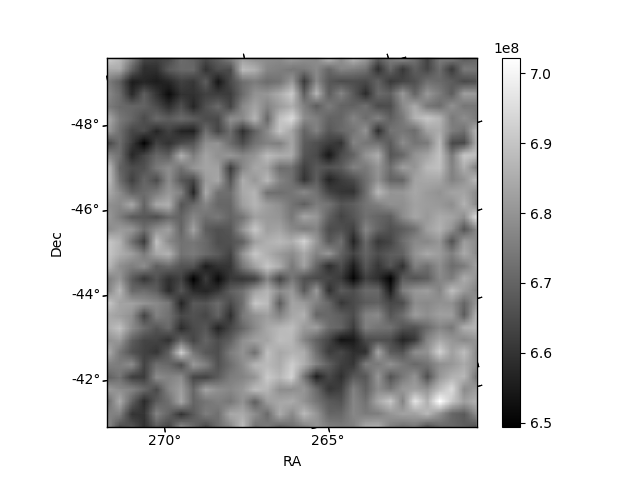
Histogram calculated using DETX and DETY for each event in the final _common_clean file
| Quadrant A | 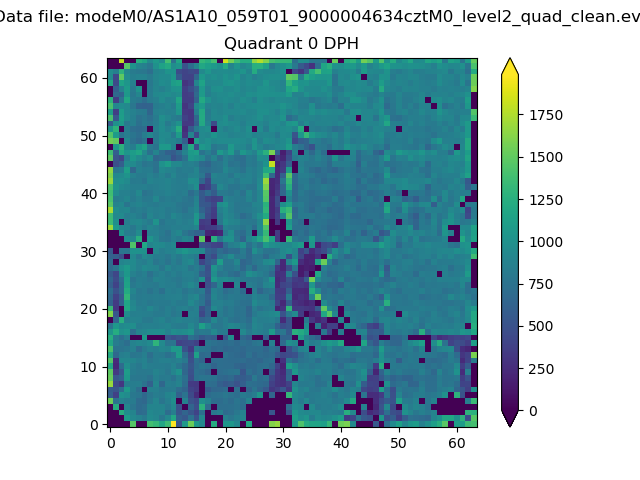 |
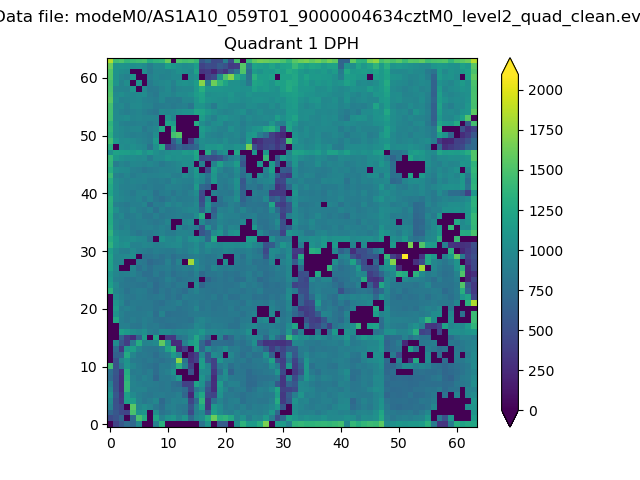 |
Quadrant B |
|---|---|---|---|
| Quadrant D | 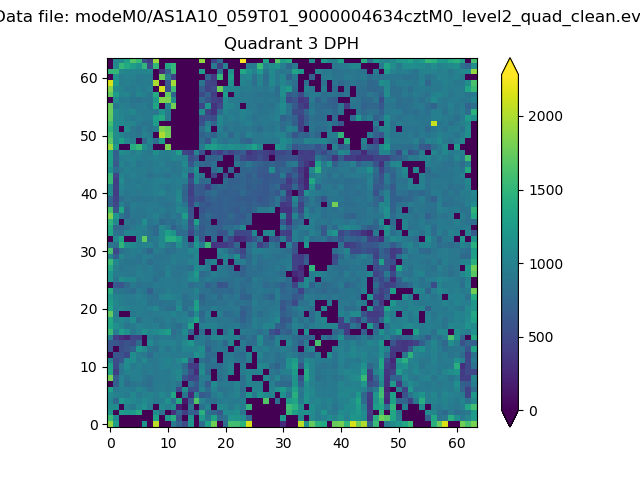 |
 |
Quadrant C |
| Plot type | Count rate plots | Images |
|---|---|---|
| Comparison with Poisson distribution Blue bars denote a histogram of data divided into 1 sec bins. Red curve is a Poisson curve with rate = median count rate of data. |
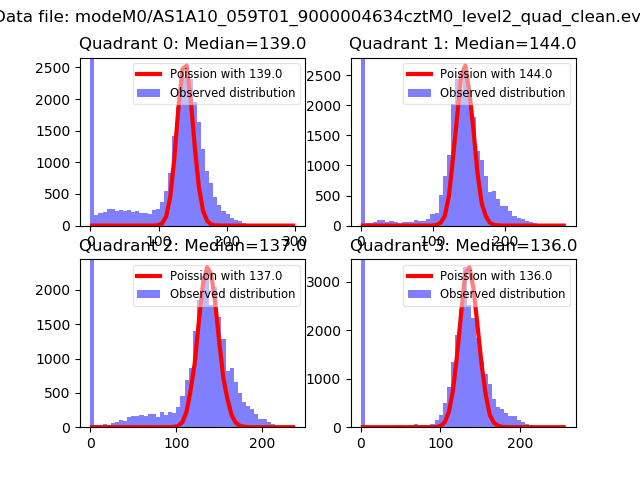 |
 |
| Quadrant-wise count rates Data is divided into 100 sec bins |
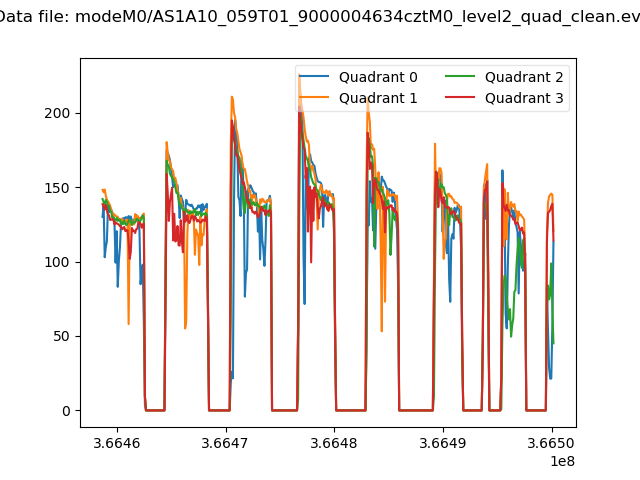 |
|
| Module-wise count rates for Quadrant A Data is divided into 100 sec bins |
 |
 |
| Module-wise count rates for Quadrant B Data is divided into 100 sec bins |
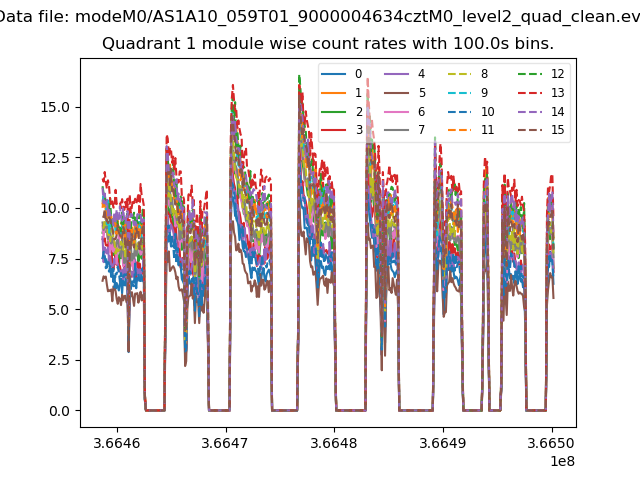 |
 |
| Module-wise count rates for Quadrant C Data is divided into 100 sec bins |
 |
 |
| Module-wise count rates for Quadrant D Data is divided into 100 sec bins |
 |
 |
| Parameter | Plot |
|---|---|
| CZT HV Monitor |  |
| D_VDD |  |
| Temperature 1 |  |
| Veto HV Monitor |  |
| Veto LLD | 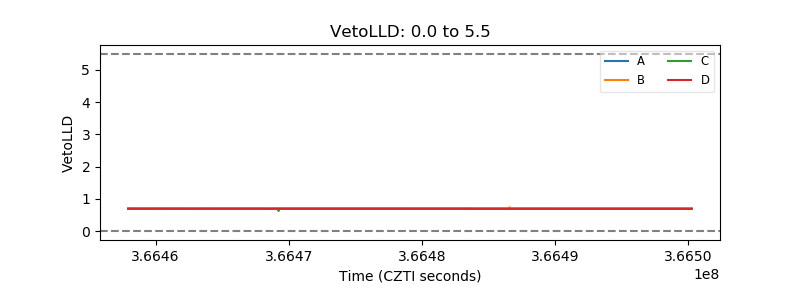 |
| Alpha Counter |  |
| _CPM_Rate |  |
| CZT Counter | 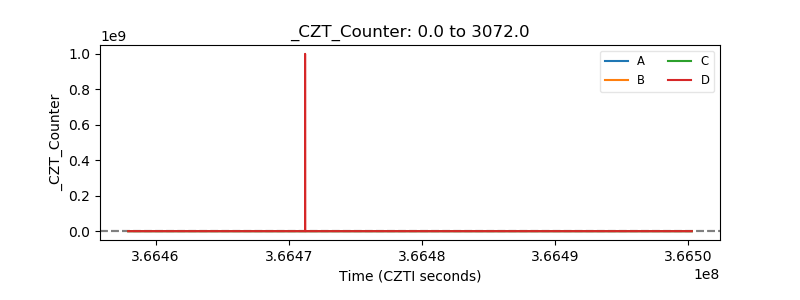 |
| +2.5 Volts monitor | 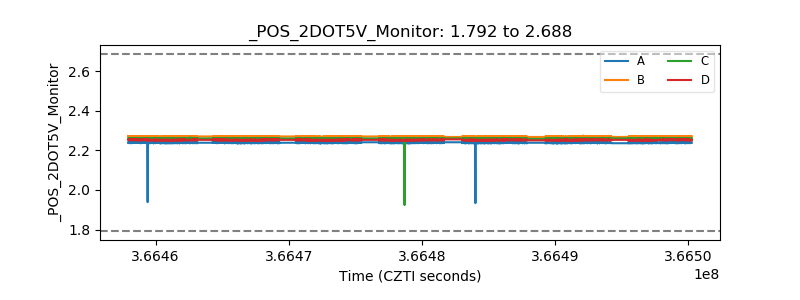 |
| +5 Volts monitor |  |
| _ROLL_ROT | 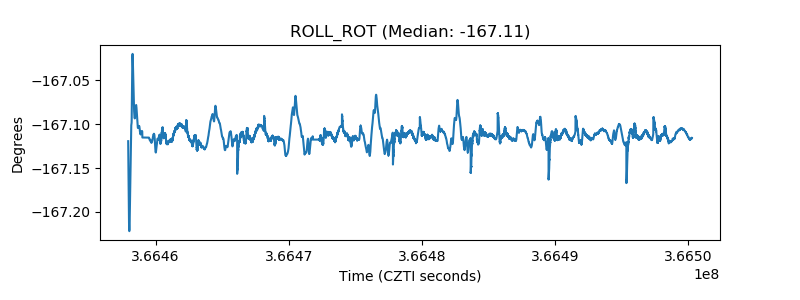 |
| _Roll_DEC |  |
| _Roll_RA |  |
| Veto Counter | 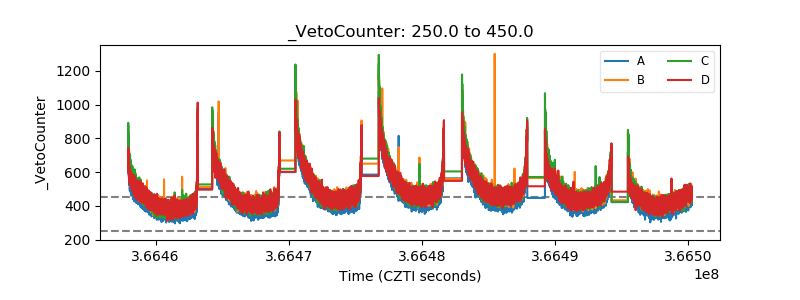 |