| Param | Original file | Final file |
|---|---|---|
| Filename | modeM0/AS1A10_059T01_9000004634_31755cztM0_level2.evt | modeM0/AS1A10_059T01_9000004634_31755cztM0_level2_quad_clean.evt |
| Size (bytes) | 573,324,480 | 71,222,400 |
| Size | 546.8 MB | 67.9 MB |
| Events in quadrant A | 5,466,966 | 435,462 |
| Events in quadrant B | 3,980,697 | 478,761 |
| Events in quadrant C | 3,230,497 | 466,913 |
| Events in quadrant D | 4,352,611 | 430,574 |
| Mode M9 | |||
|---|---|---|---|
| Quadrant | BADHDUFLAG | Total packets | Discarded packets |
| A | 0 | 10 | 0 |
| B | 0 | 10 | 0 |
| C | 0 | 10 | 0 |
| D | 0 | 11 | 1 |
| Mode SS | |||
|---|---|---|---|
| Quadrant | BADHDUFLAG | Total packets | Discarded packets |
| A | 0 | 108 | 4 |
| B | 0 | 109 | 5 |
| C | 0 | 109 | 5 |
| D | 0 | 111 | 7 |
| Mode M0 | |||
|---|---|---|---|
| Quadrant | BADHDUFLAG | Total packets | Discarded packets |
| A | 0 | 20703 | 963 |
| B | 0 | 16098 | 914 |
| C | 0 | 13608 | 669 |
| D | 0 | 17105 | 954 |
| Quadrant | Total seconds | Saturated seconds | Saturation percentage |
|---|---|---|---|
| A | 4891 | 1270 | 25.966060% |
| B | 4901 | 150 | 3.060600% |
| C | 4910 | 280 | 5.702648% |
| D | 4889 | 583 | 11.924729% |
Noise dominated data is calculated using 1-second bins in cleaned event files. If a bin has >2000 counts, and if more than 50% of those come from <1% of pixels, then it is considered to be noise-dominated and hence unusable.
| Quadrant | # 1 sec bins | Bins with >0 counts | Bins with >2000 counts | High rate bins dominated by noise | Noise dominated (total time) | Noise dominated (detector-on time) | Marked lightcurve |
|---|---|---|---|---|---|---|---|
| A | 7717 | 4922 | 660 | 660 | 8.55% | 13.41% | 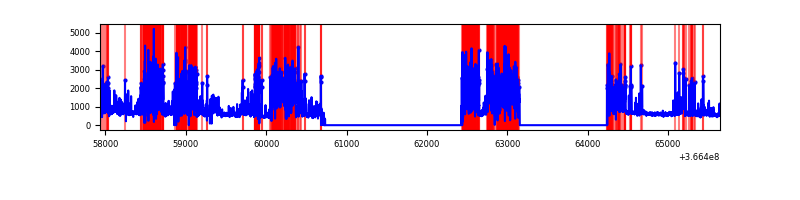 |
| B | 7717 | 4932 | 8 | 8 | 0.10% | 0.16% | 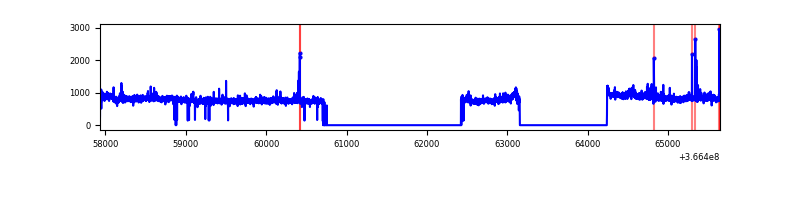 |
| C | 7717 | 4936 | 57 | 57 | 0.74% | 1.15% | 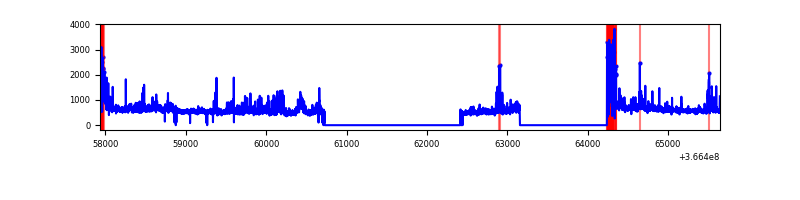 |
| D | 7716 | 4928 | 322 | 322 | 4.17% | 6.53% |  |
Top three noisy pixels from each quadrant. If the there are fewer than three noisy pixels in the level2.evt file, extra rows are filled as -1
| Pixel properties | Quadrant properties | ||||||
|---|---|---|---|---|---|---|---|
| Quadrant | DetID | PixID | Counts | Sigma | Mean | Median | Sigma |
| A | 0 | 13 | 3193987 | 27046.24 | 589 | 579 | 118.1 |
| A | 13 | 254 | 7339 | 57.25 | 589 | 579 | 118.1 |
| A | 3 | 137 | 5580 | 42.36 | 589 | 579 | 118.1 |
| B | 6 | 159 | 1292300 | 10371.36 | 654 | 636 | 124.5 |
| B | 10 | 245 | 50360 | 399.26 | 654 | 636 | 124.5 |
| B | 0 | 229 | 20293 | 157.84 | 654 | 636 | 124.5 |
| C | 0 | 10 | 492756 | 3368.65 | 629 | 633 | 146.1 |
| C | 3 | 233 | 149618 | 1019.82 | 629 | 633 | 146.1 |
| C | 14 | 238 | 102463 | 697.04 | 629 | 633 | 146.1 |
| D | 12 | 218 | 1015767 | 6889.73 | 623 | 608 | 147.3 |
| D | 8 | 195 | 713186 | 4836.16 | 623 | 608 | 147.3 |
| D | 12 | 233 | 87703 | 591.1 | 623 | 608 | 147.3 |
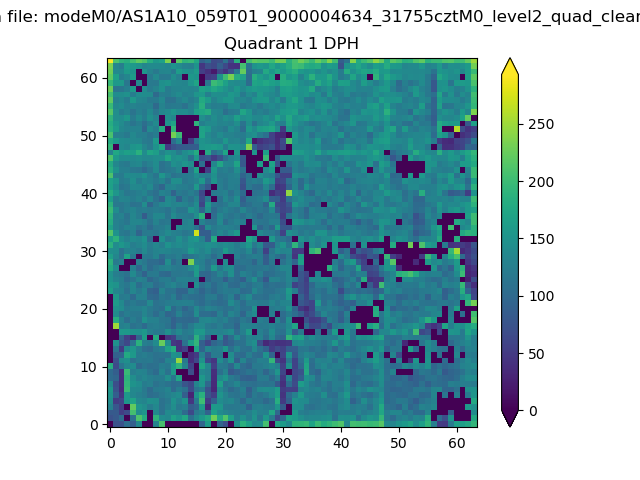
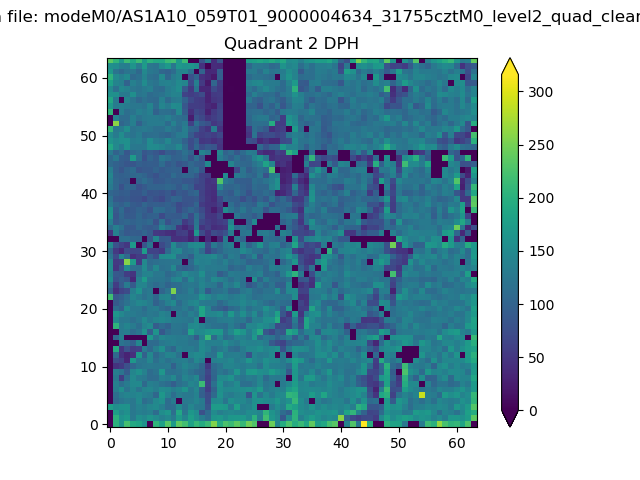
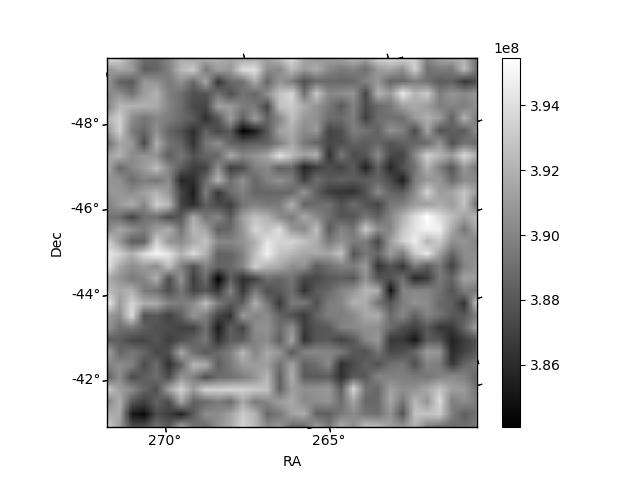
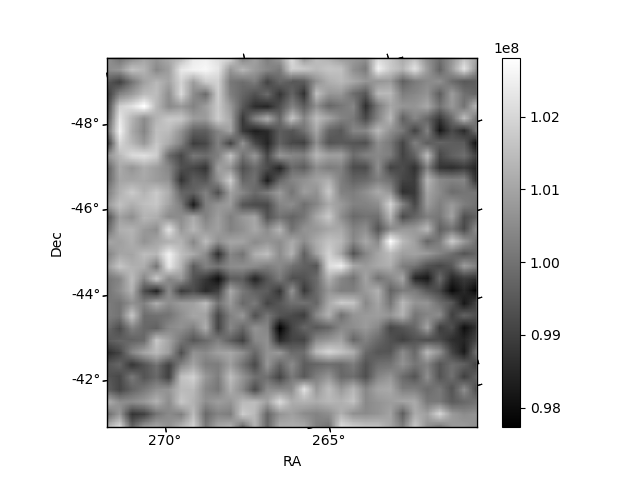
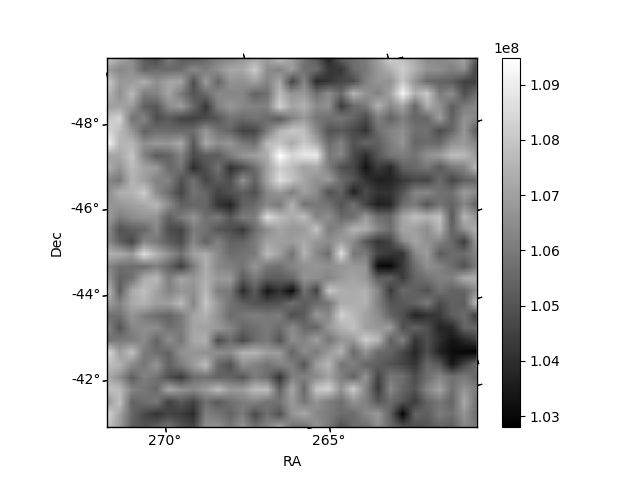
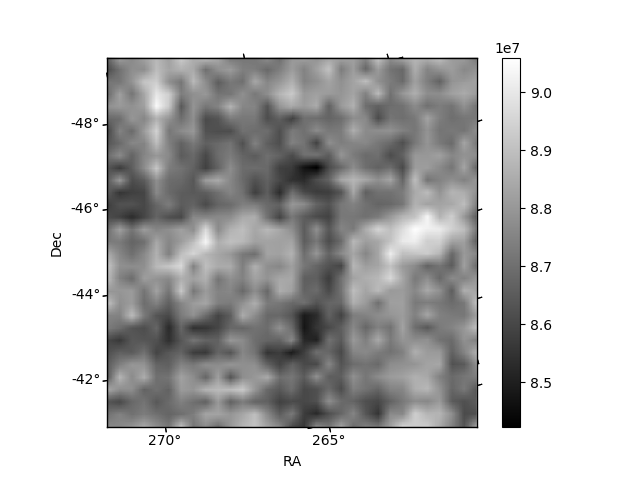
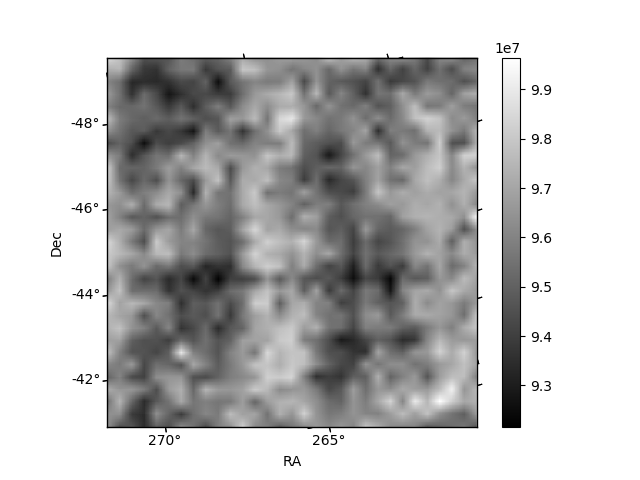
Histogram calculated using DETX and DETY for each event in the final _common_clean file
| Quadrant A | 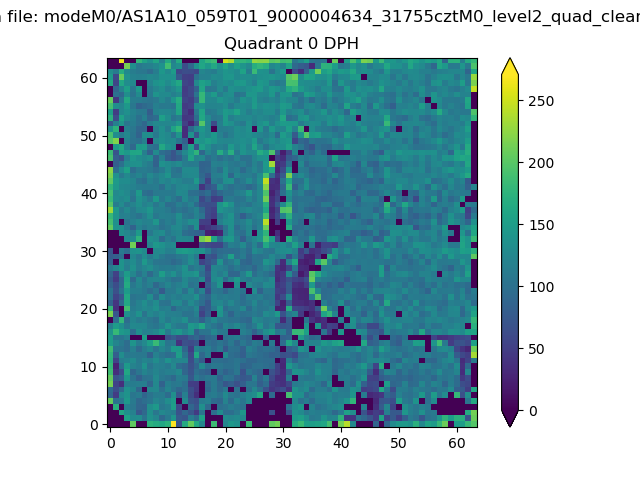 |
 |
Quadrant B |
|---|---|---|---|
| Quadrant D | 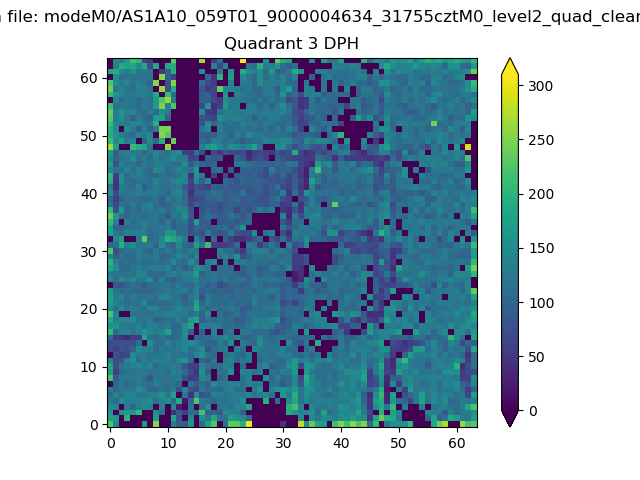 |
 |
Quadrant C |
| Plot type | Count rate plots | Images |
|---|---|---|
| Comparison with Poisson distribution Blue bars denote a histogram of data divided into 1 sec bins. Red curve is a Poisson curve with rate = median count rate of data. |
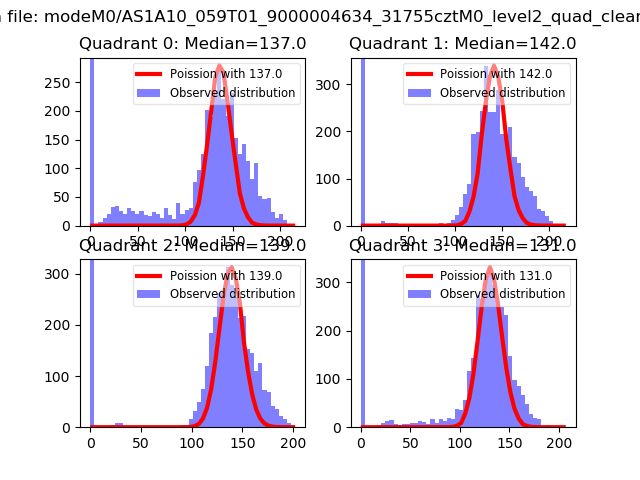 |
 |
| Quadrant-wise count rates Data is divided into 100 sec bins |
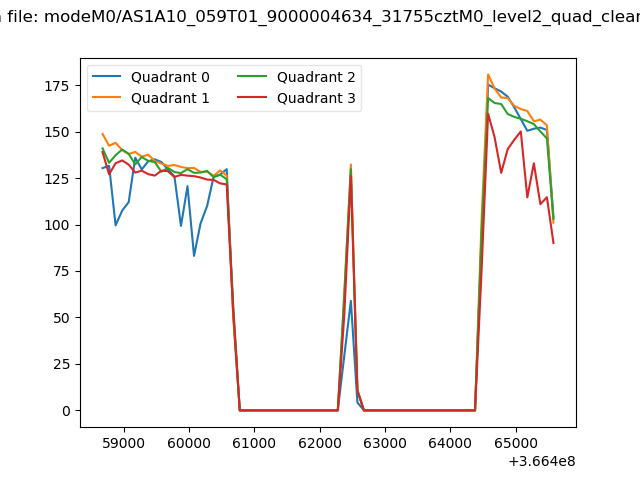 |
|
| Module-wise count rates for Quadrant A Data is divided into 100 sec bins |
 |
 |
| Module-wise count rates for Quadrant B Data is divided into 100 sec bins |
 |
 |
| Module-wise count rates for Quadrant C Data is divided into 100 sec bins |
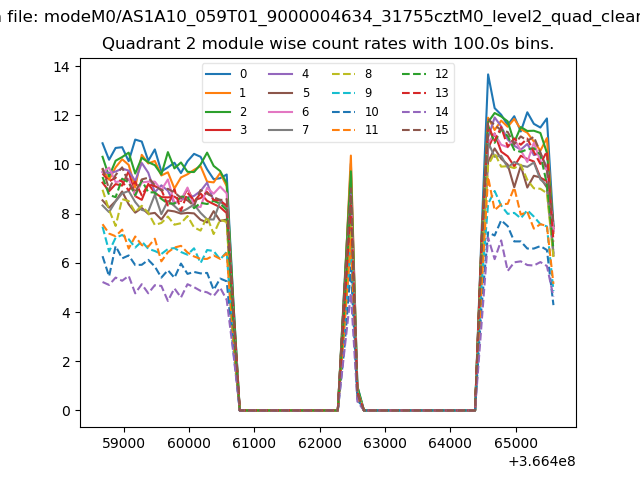 |
 |
| Module-wise count rates for Quadrant D Data is divided into 100 sec bins |
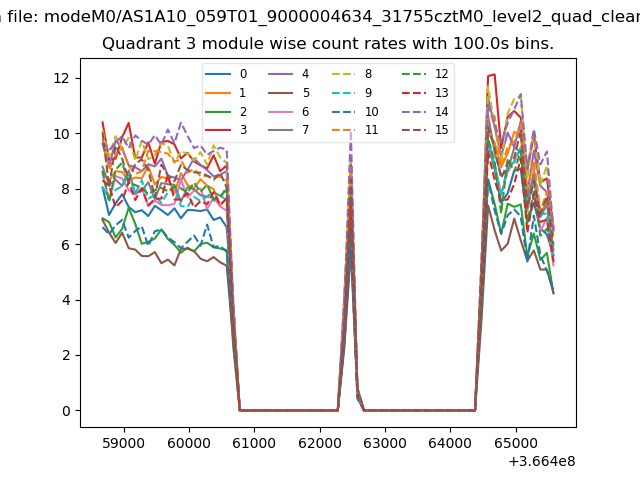 |
 |
| Parameter | Plot |
|---|---|
| CZT HV Monitor | 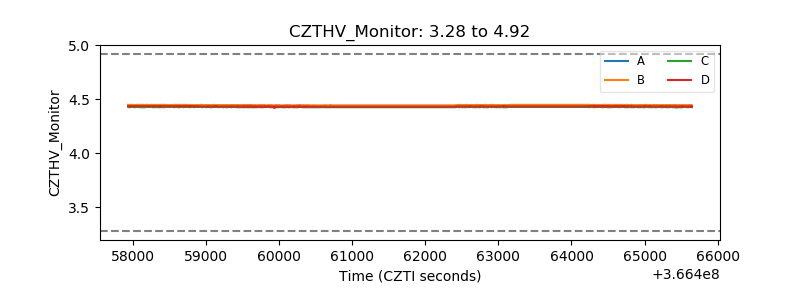 |
| D_VDD | 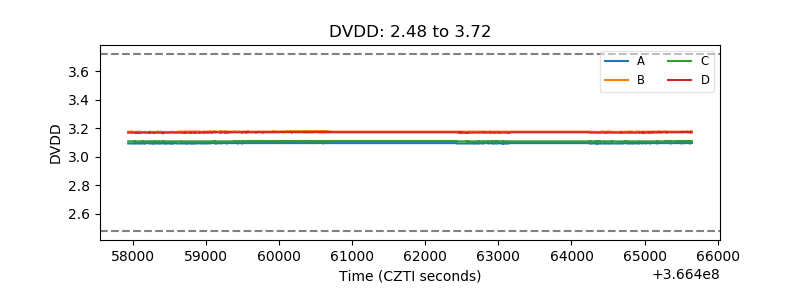 |
| Temperature 1 | 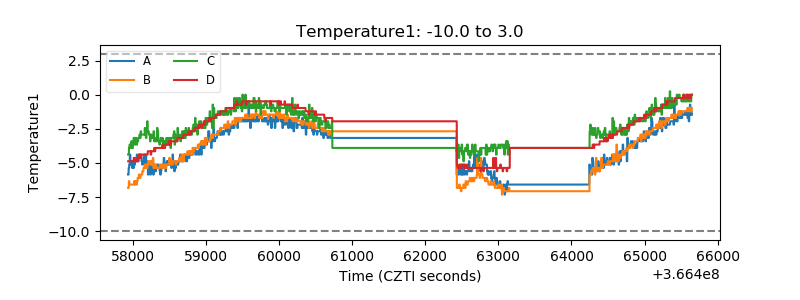 |
| Veto HV Monitor | 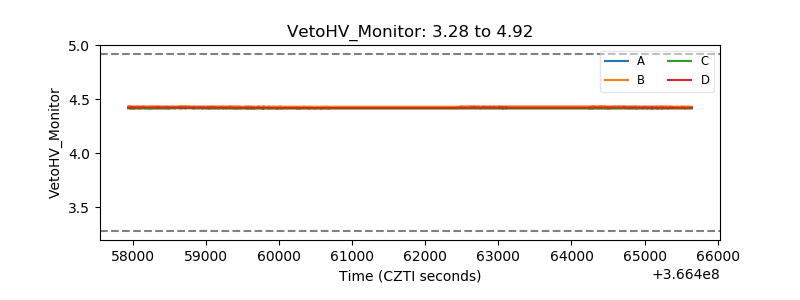 |
| Veto LLD |  |
| Alpha Counter | 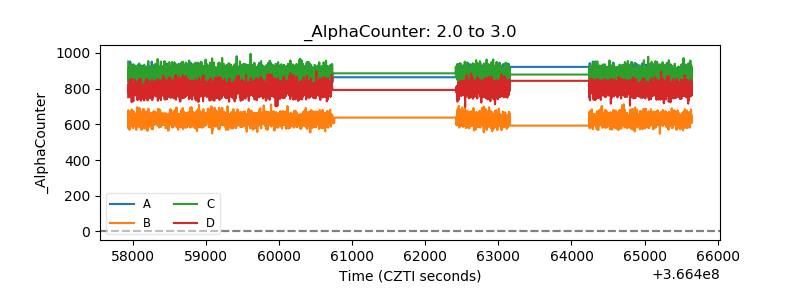 |
| _CPM_Rate | 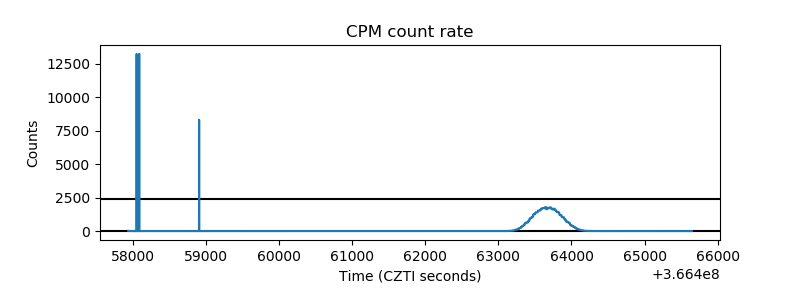 |
| CZT Counter | 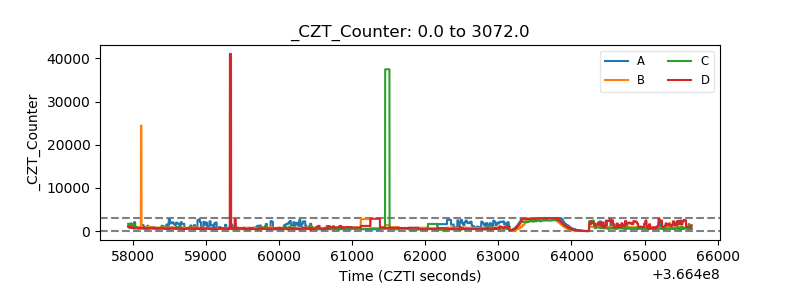 |
| +2.5 Volts monitor |  |
| +5 Volts monitor |  |
| _ROLL_ROT |  |
| _Roll_DEC | 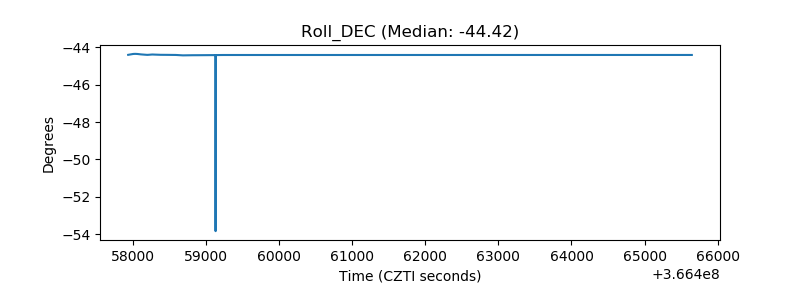 |
| _Roll_RA | 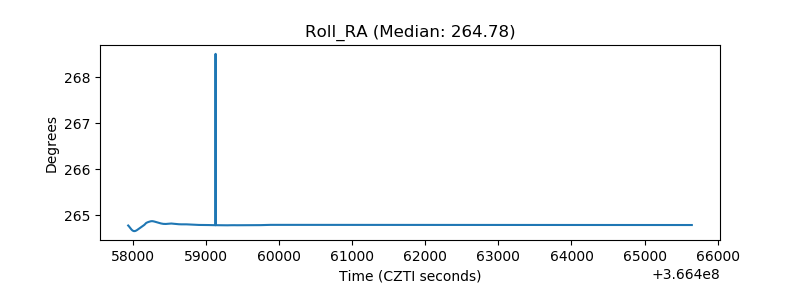 |
| Veto Counter |  |