| Param | Original file | Final file |
|---|---|---|
| Filename | modeM0/AS1A10_059T01_9000004634_31758cztM0_level2.evt | modeM0/AS1A10_059T01_9000004634_31758cztM0_level2_quad_clean.evt |
| Size (bytes) | 766,468,800 | 107,023,680 |
| Size | 731.0 MB | 102.1 MB |
| Events in quadrant A | 6,399,237 | 674,503 |
| Events in quadrant B | 6,067,496 | 742,408 |
| Events in quadrant C | 4,688,952 | 704,754 |
| Events in quadrant D | 5,641,391 | 688,071 |
| Mode M9 | |||
|---|---|---|---|
| Quadrant | BADHDUFLAG | Total packets | Discarded packets |
| A | 0 | 13 | 0 |
| B | 0 | 13 | 0 |
| C | 0 | 13 | 0 |
| D | 0 | 13 | 0 |
| Mode SS | |||
|---|---|---|---|
| Quadrant | BADHDUFLAG | Total packets | Discarded packets |
| A | 0 | 124 | 0 |
| B | 0 | 124 | 0 |
| C | 0 | 124 | 0 |
| D | 0 | 124 | 0 |
| Mode M0 | |||
|---|---|---|---|
| Quadrant | BADHDUFLAG | Total packets | Discarded packets |
| A | 0 | 23202 | 1 |
| B | 0 | 22255 | 1 |
| C | 0 | 18101 | 1 |
| D | 0 | 20841 | 1 |
| Quadrant | Total seconds | Saturated seconds | Saturation percentage |
|---|---|---|---|
| A | 6169 | 1307 | 21.186578% |
| B | 6169 | 532 | 8.623764% |
| C | 6169 | 435 | 7.051386% |
| D | 6169 | 381 | 6.176041% |
Noise dominated data is calculated using 1-second bins in cleaned event files. If a bin has >2000 counts, and if more than 50% of those come from <1% of pixels, then it is considered to be noise-dominated and hence unusable.
| Quadrant | # 1 sec bins | Bins with >0 counts | Bins with >2000 counts | High rate bins dominated by noise | Noise dominated (total time) | Noise dominated (detector-on time) | Marked lightcurve |
|---|---|---|---|---|---|---|---|
| A | 7524 | 6170 | 722 | 722 | 9.60% | 11.70% | 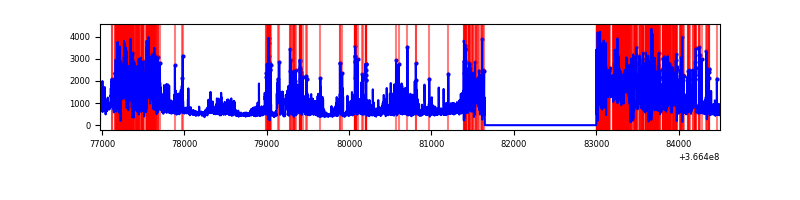 |
| B | 7524 | 6170 | 289 | 289 | 3.84% | 4.68% | 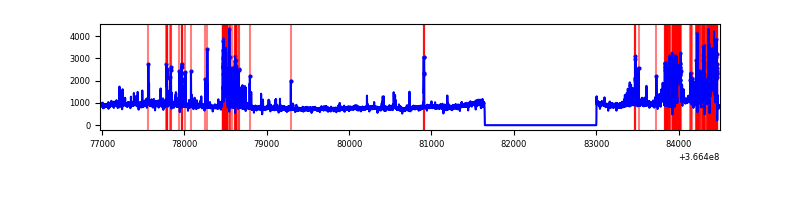 |
| C | 7524 | 6170 | 212 | 212 | 2.82% | 3.44% | 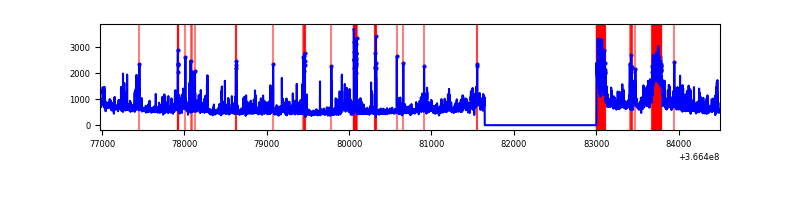 |
| D | 7524 | 6170 | 271 | 271 | 3.60% | 4.39% | 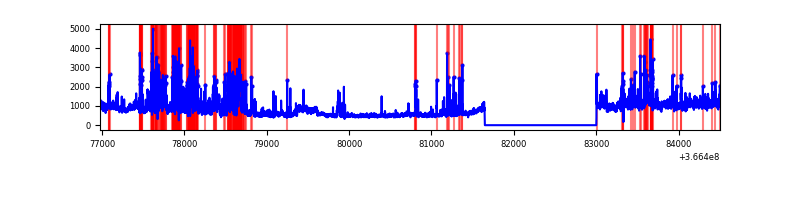 |
Top three noisy pixels from each quadrant. If the there are fewer than three noisy pixels in the level2.evt file, extra rows are filled as -1
| Pixel properties | Quadrant properties | ||||||
|---|---|---|---|---|---|---|---|
| Quadrant | DetID | PixID | Counts | Sigma | Mean | Median | Sigma |
| A | 0 | 13 | 3394750 | 22417.05 | 766 | 756 | 151.4 |
| A | 14 | 238 | 44082 | 286.16 | 766 | 756 | 151.4 |
| A | 13 | 254 | 11134 | 68.55 | 766 | 756 | 151.4 |
| B | 6 | 159 | 1747274 | 11524.07 | 817 | 802 | 151.5 |
| B | 5 | 172 | 970927 | 6401.35 | 817 | 802 | 151.5 |
| B | 0 | 229 | 82785 | 540.96 | 817 | 802 | 151.5 |
| C | 0 | 10 | 1079548 | 6079.75 | 773 | 779 | 177.4 |
| C | 3 | 233 | 220717 | 1239.53 | 773 | 779 | 177.4 |
| C | 10 | 22 | 195313 | 1096.36 | 773 | 779 | 177.4 |
| D | 8 | 195 | 1232942 | 6632.58 | 792 | 773 | 185.8 |
| D | 12 | 218 | 949097 | 5104.69 | 792 | 773 | 185.8 |
| D | 12 | 233 | 141655 | 758.35 | 792 | 773 | 185.8 |
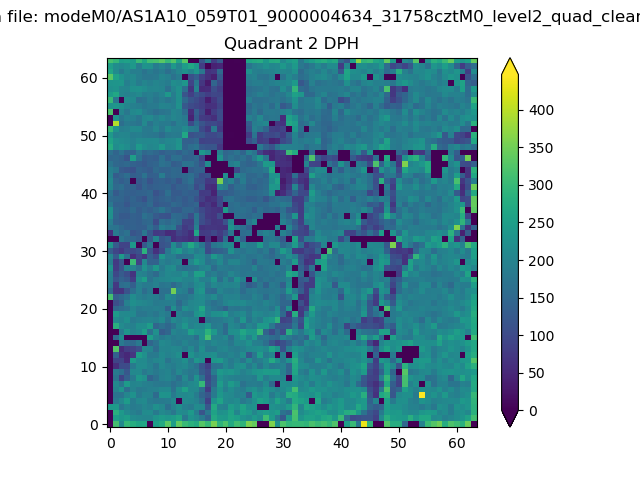
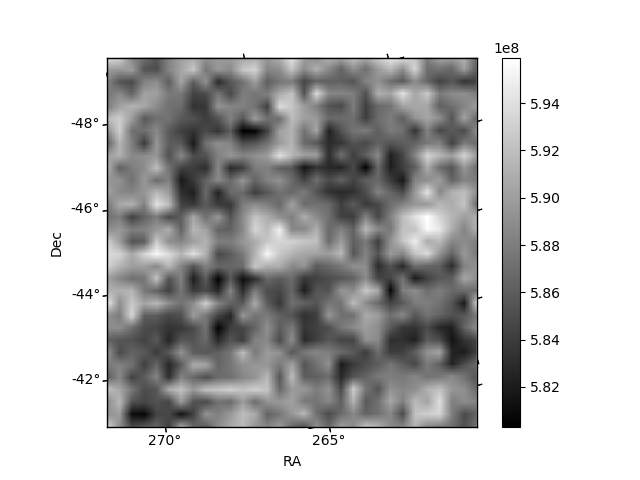
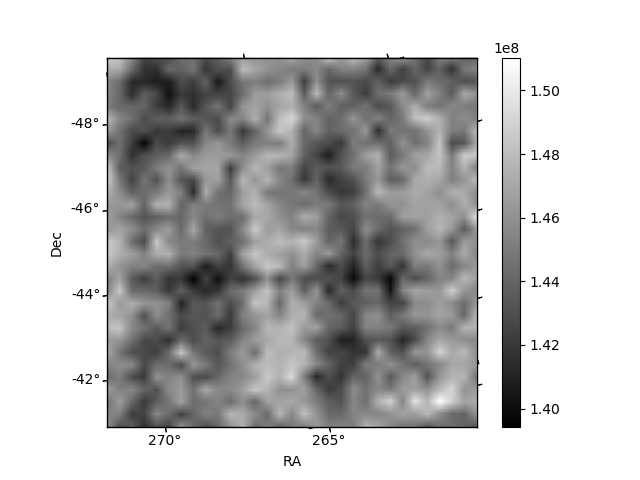
Histogram calculated using DETX and DETY for each event in the final _common_clean file
| Quadrant A | 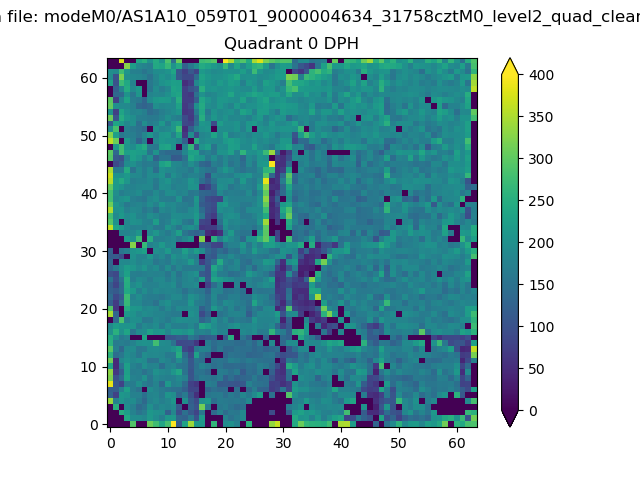 |
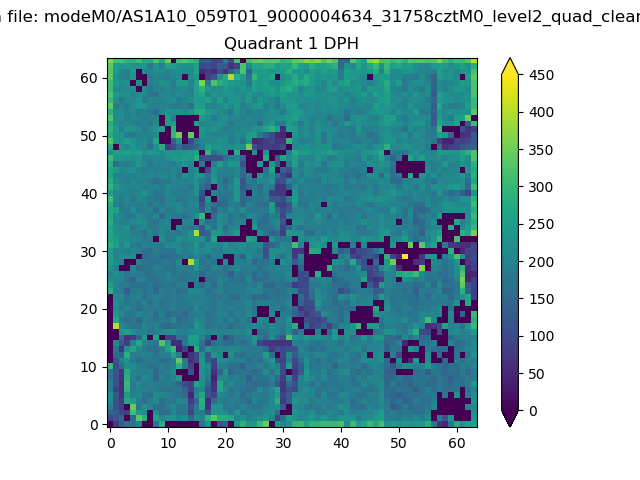 |
Quadrant B |
|---|---|---|---|
| Quadrant D | 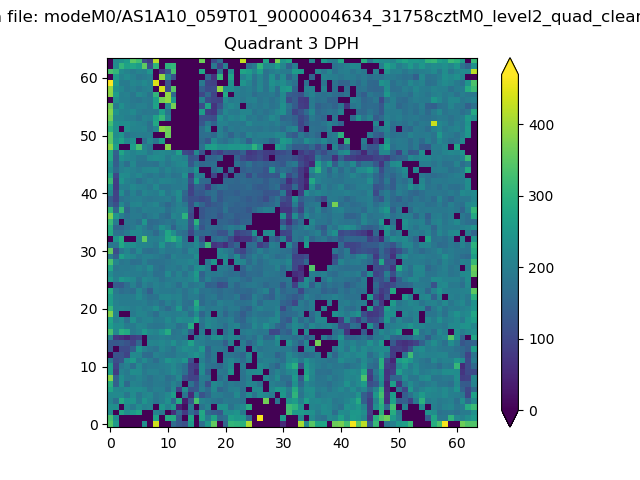 |
 |
Quadrant C |
| Plot type | Count rate plots | Images |
|---|---|---|
| Comparison with Poisson distribution Blue bars denote a histogram of data divided into 1 sec bins. Red curve is a Poisson curve with rate = median count rate of data. |
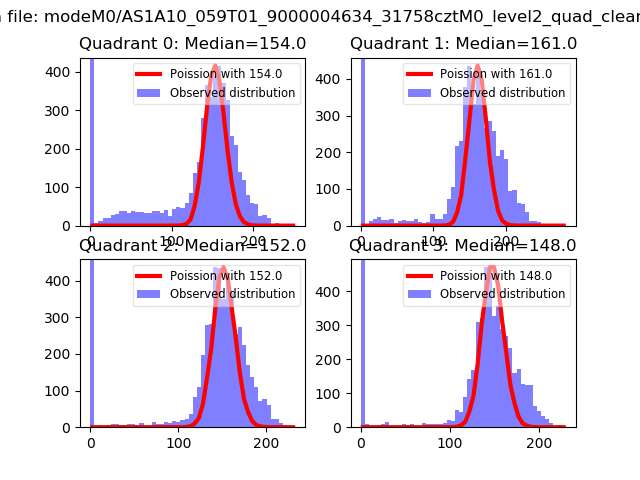 |
 |
| Quadrant-wise count rates Data is divided into 100 sec bins |
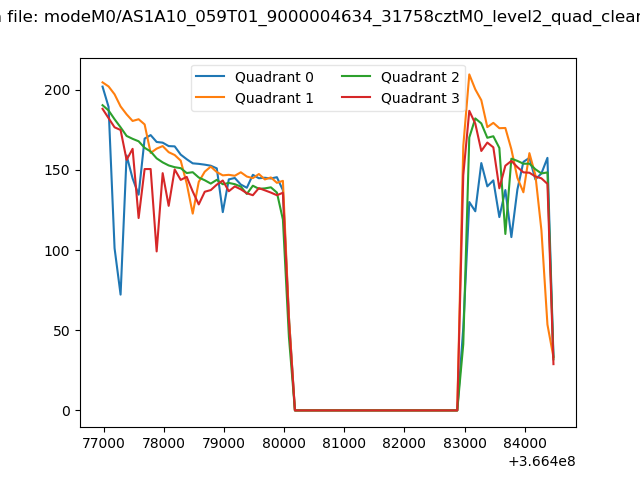 |
|
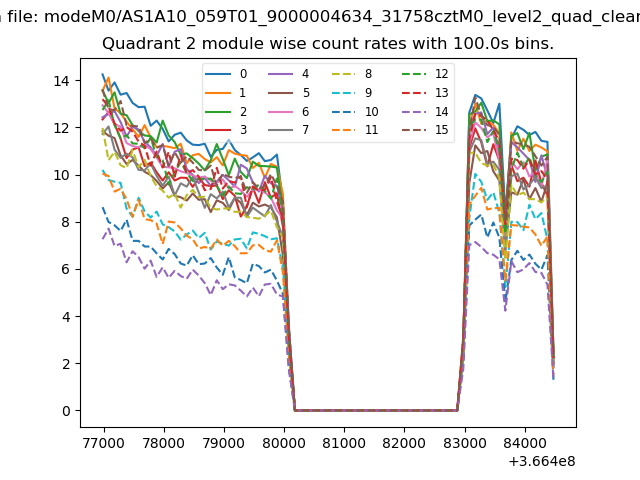
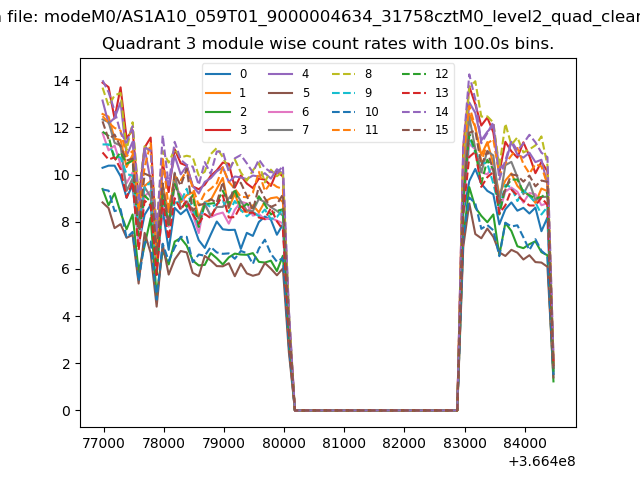
| Module-wise count rates for Quadrant A Data is divided into 100 sec bins |
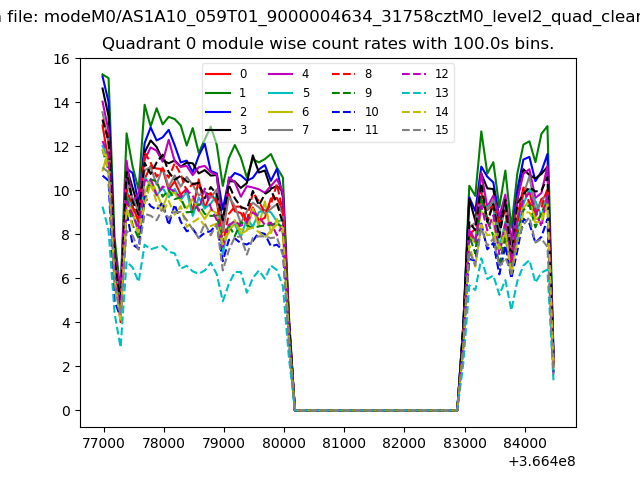 |
 |
| Module-wise count rates for Quadrant B Data is divided into 100 sec bins |
 |
 |
| Module-wise count rates for Quadrant C Data is divided into 100 sec bins |
 |
 |
| Module-wise count rates for Quadrant D Data is divided into 100 sec bins |
 |
 |
| Parameter | Plot |
|---|---|
| CZT HV Monitor | 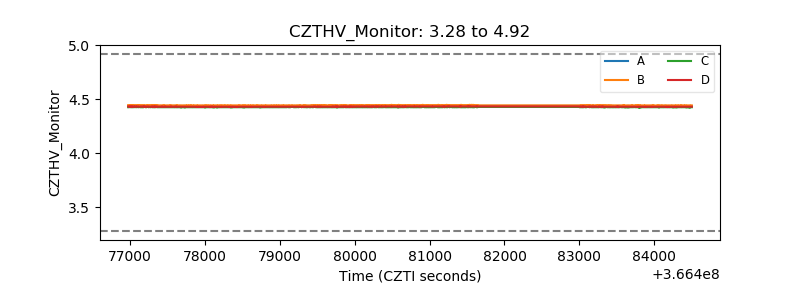 |
| D_VDD | 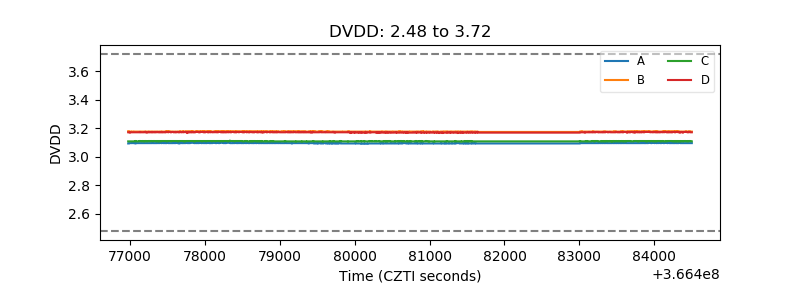 |
| Temperature 1 | 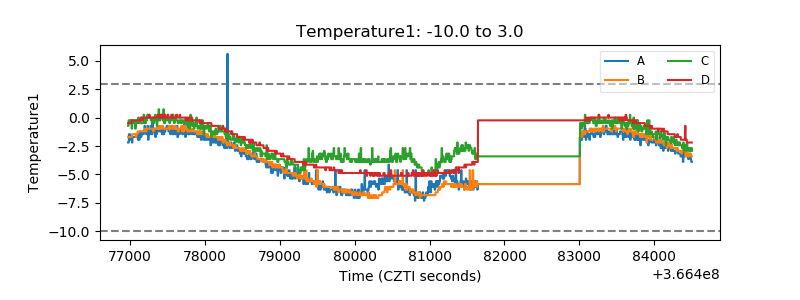 |
| Veto HV Monitor | 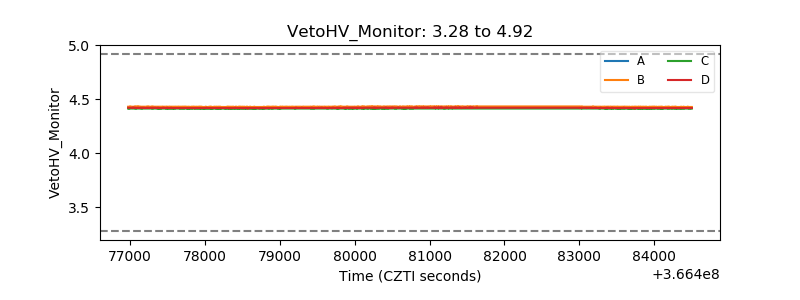 |
| Veto LLD | 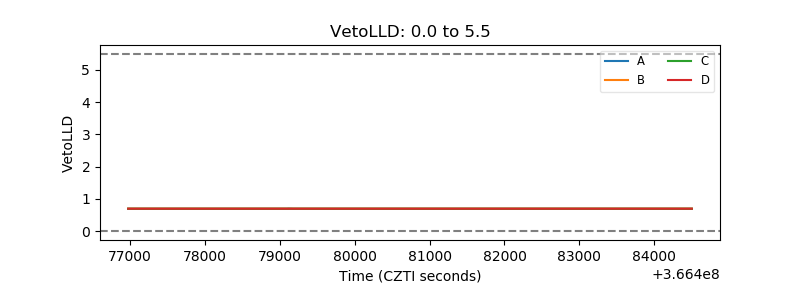 |
| Alpha Counter | 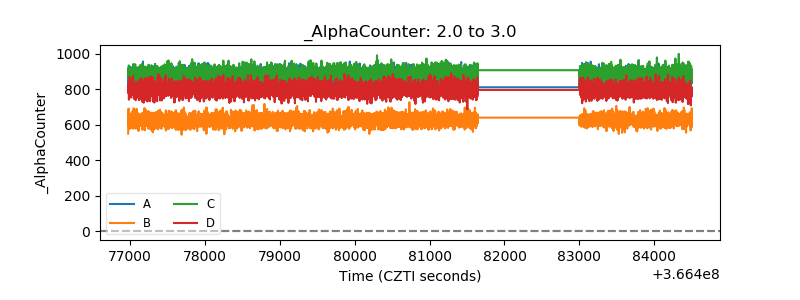 |
| _CPM_Rate | 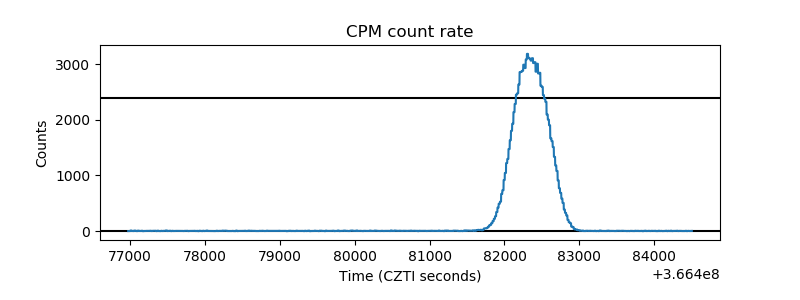 |
| CZT Counter | 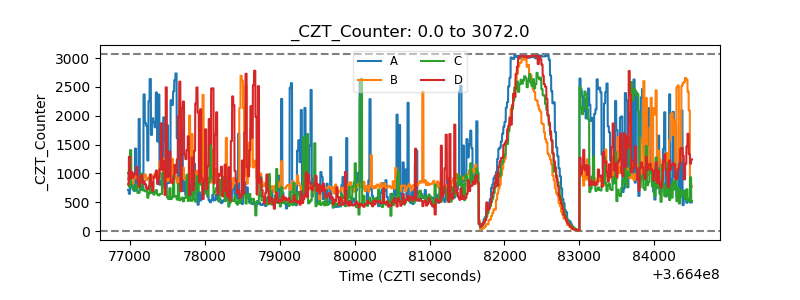 |
| +2.5 Volts monitor |  |
| +5 Volts monitor |  |
| _ROLL_ROT | 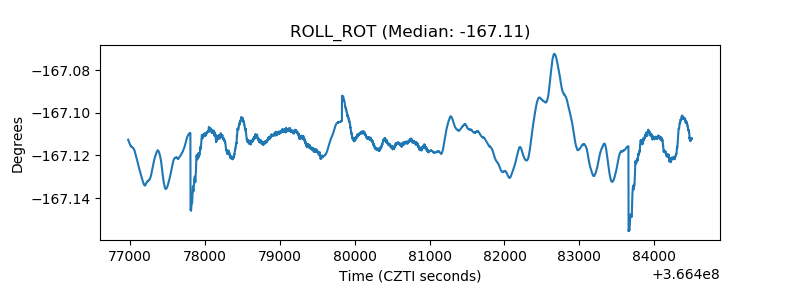 |
| _Roll_DEC | 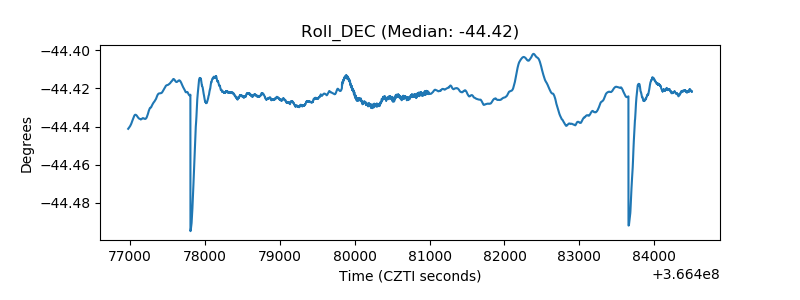 |
| _Roll_RA | 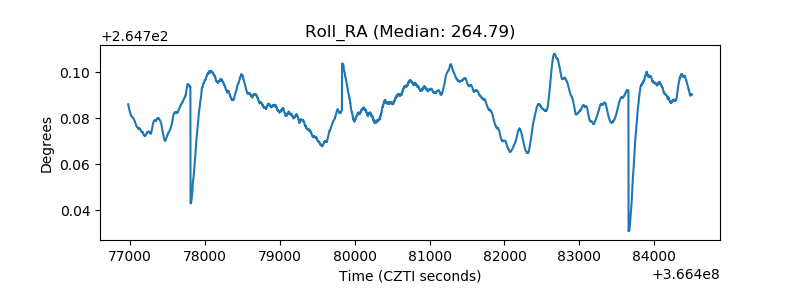 |
| Veto Counter | 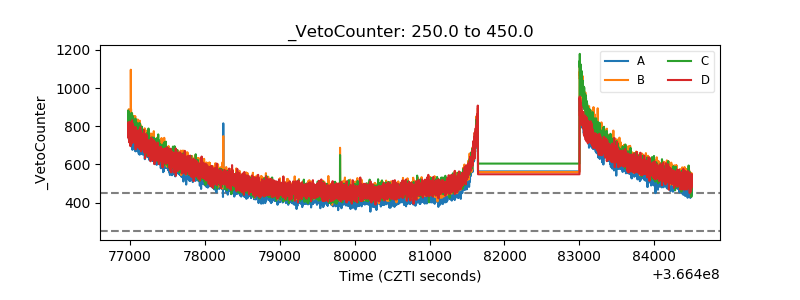 |