| Param | Original file | Final file |
|---|---|---|
| Filename | modeM0/AS1A10_059T01_9000004634_31760cztM0_level2.evt | modeM0/AS1A10_059T01_9000004634_31760cztM0_level2_quad_clean.evt |
| Size (bytes) | 865,517,760 | 86,889,600 |
| Size | 825.4 MB | 82.9 MB |
| Events in quadrant A | 7,596,753 | 540,435 |
| Events in quadrant B | 6,152,777 | 591,061 |
| Events in quadrant C | 7,532,863 | 489,664 |
| Events in quadrant D | 4,515,945 | 578,803 |
| Mode M9 | |||
|---|---|---|---|
| Quadrant | BADHDUFLAG | Total packets | Discarded packets |
| A | 0 | 13 | 0 |
| B | 0 | 13 | 0 |
| C | 0 | 13 | 0 |
| D | 0 | 13 | 0 |
| Mode SS | |||
|---|---|---|---|
| Quadrant | BADHDUFLAG | Total packets | Discarded packets |
| A | 0 | 124 | 0 |
| B | 0 | 124 | 0 |
| C | 0 | 124 | 0 |
| D | 0 | 124 | 0 |
| Mode M0 | |||
|---|---|---|---|
| Quadrant | BADHDUFLAG | Total packets | Discarded packets |
| A | 0 | 26834 | 1 |
| B | 0 | 22641 | 1 |
| C | 0 | 26598 | 1 |
| D | 0 | 17528 | 1 |
| Quadrant | Total seconds | Saturated seconds | Saturation percentage |
|---|---|---|---|
| A | 6159 | 1551 | 25.182660% |
| B | 6159 | 641 | 10.407534% |
| C | 6159 | 1773 | 28.787141% |
| D | 6160 | 81 | 1.314935% |
Noise dominated data is calculated using 1-second bins in cleaned event files. If a bin has >2000 counts, and if more than 50% of those come from <1% of pixels, then it is considered to be noise-dominated and hence unusable.
| Quadrant | # 1 sec bins | Bins with >0 counts | Bins with >2000 counts | High rate bins dominated by noise | Noise dominated (total time) | Noise dominated (detector-on time) | Marked lightcurve |
|---|---|---|---|---|---|---|---|
| A | 7389 | 6160 | 1101 | 1101 | 14.90% | 17.87% | 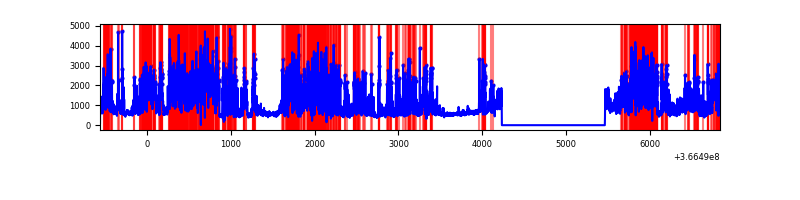 |
| B | 7389 | 6160 | 355 | 355 | 4.80% | 5.76% | 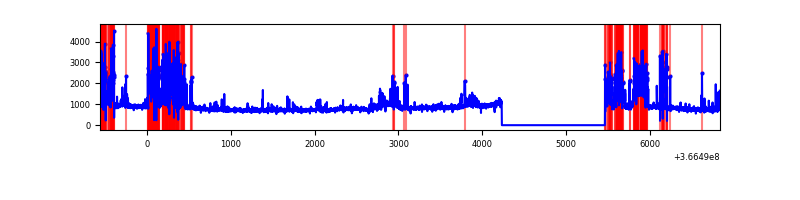 |
| C | 7389 | 6160 | 1329 | 1329 | 17.99% | 21.57% | 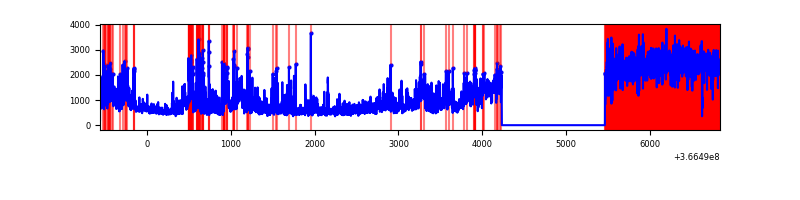 |
| D | 7390 | 6161 | 71 | 71 | 0.96% | 1.15% | 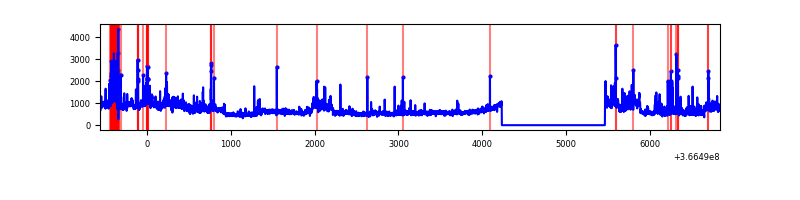 |
Top three noisy pixels from each quadrant. If the there are fewer than three noisy pixels in the level2.evt file, extra rows are filled as -1
| Pixel properties | Quadrant properties | ||||||
|---|---|---|---|---|---|---|---|
| Quadrant | DetID | PixID | Counts | Sigma | Mean | Median | Sigma |
| A | 0 | 13 | 4862066 | 34249.41 | 708 | 697 | 141.9 |
| A | 13 | 254 | 10797 | 71.16 | 708 | 697 | 141.9 |
| A | 3 | 137 | 6625 | 41.76 | 708 | 697 | 141.9 |
| B | 6 | 159 | 1811883 | 12799.66 | 748 | 732 | 141.5 |
| B | 5 | 172 | 1141878 | 8064.64 | 748 | 732 | 141.5 |
| B | 0 | 229 | 89161 | 624.94 | 748 | 732 | 141.5 |
| C | 3 | 233 | 3151334 | 20519.14 | 660 | 665 | 153.5 |
| C | 0 | 10 | 1305908 | 8500.56 | 660 | 665 | 153.5 |
| C | 10 | 22 | 368611 | 2396.3 | 660 | 665 | 153.5 |
| D | 8 | 195 | 1159123 | 6641.92 | 744 | 726 | 174.4 |
| D | 12 | 218 | 162803 | 929.3 | 744 | 726 | 174.4 |
| D | 12 | 233 | 99283 | 565.1 | 744 | 726 | 174.4 |
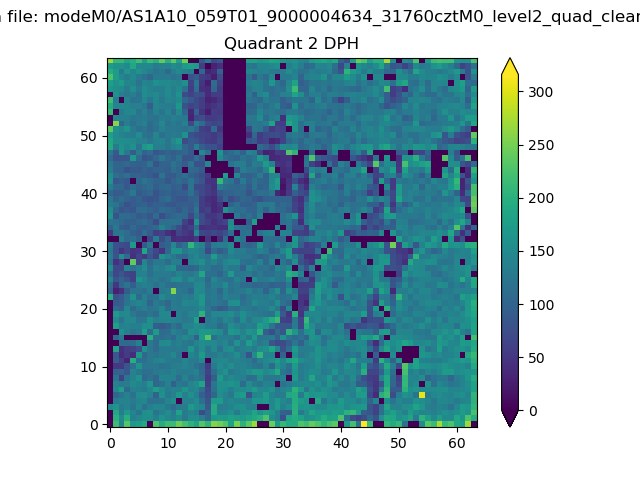
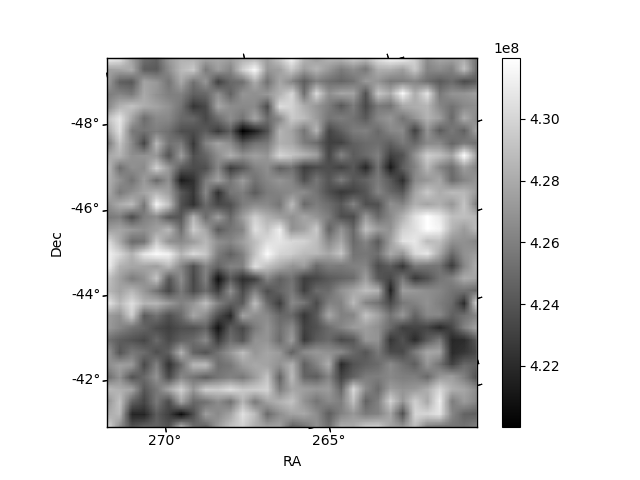
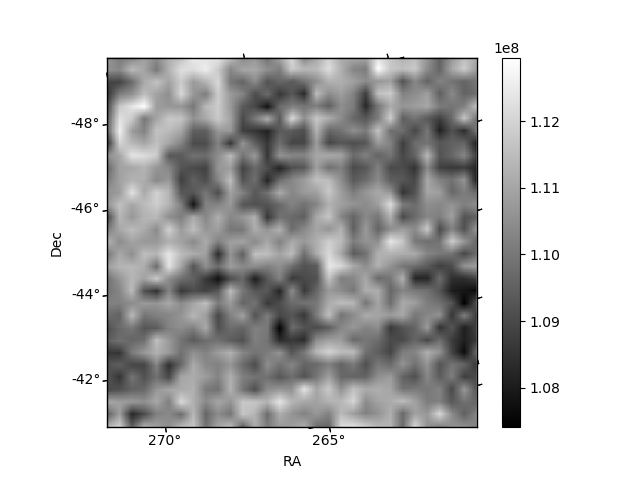
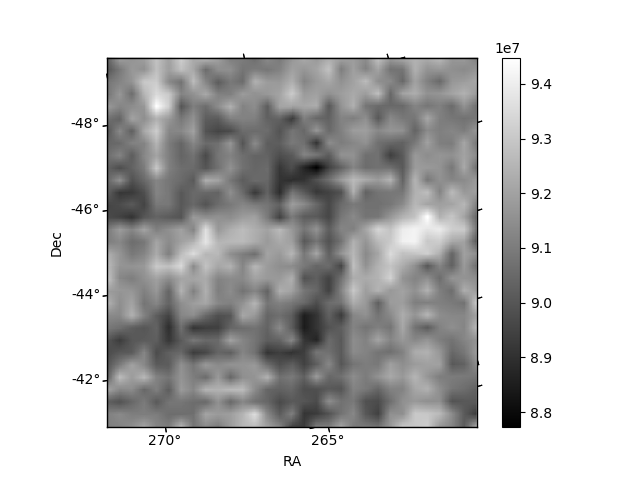
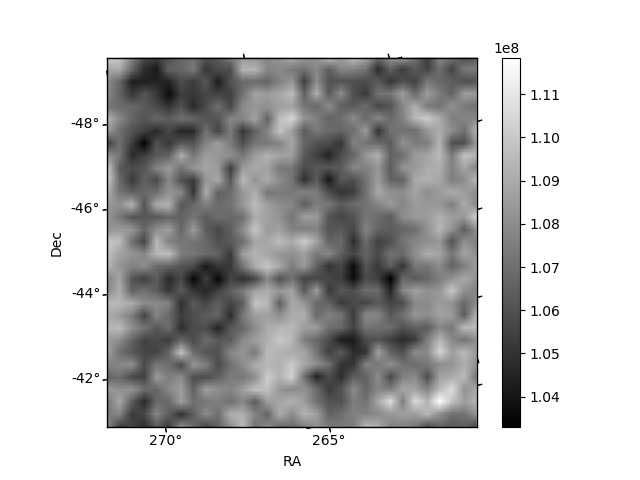
Histogram calculated using DETX and DETY for each event in the final _common_clean file
| Quadrant A | 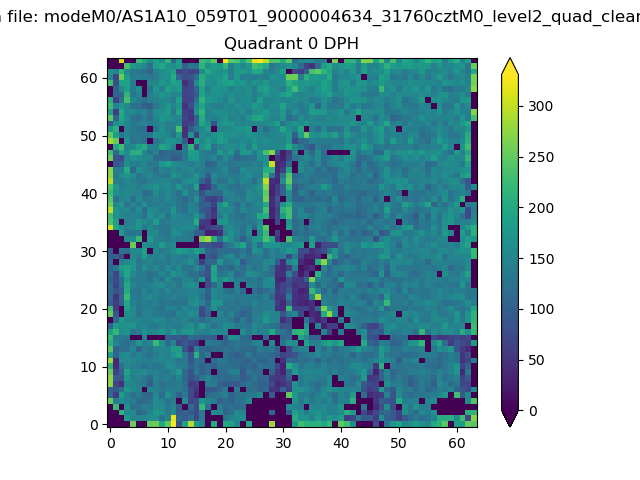 |
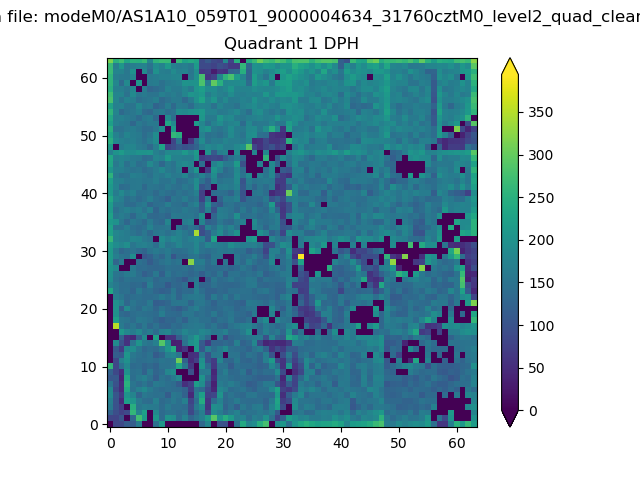 |
Quadrant B |
|---|---|---|---|
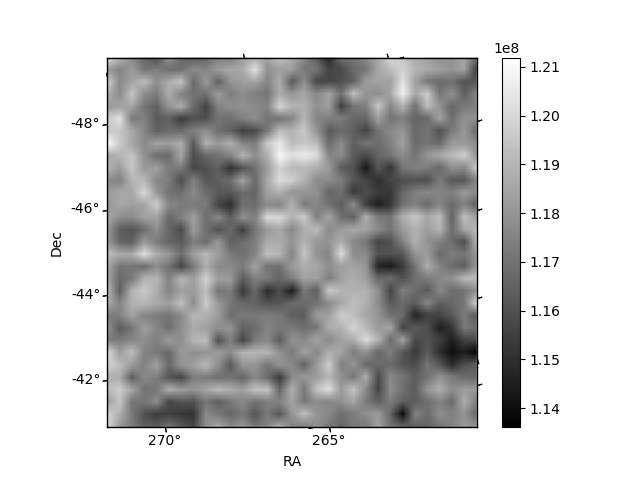
| Quadrant D | 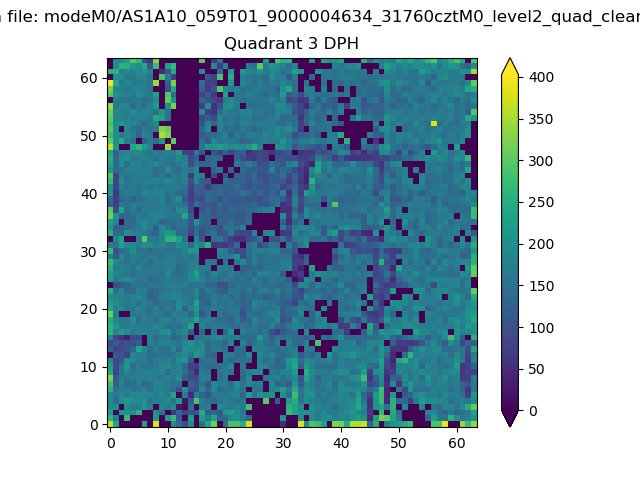 |
 |
Quadrant C |
| Plot type | Count rate plots | Images |
|---|---|---|
| Comparison with Poisson distribution Blue bars denote a histogram of data divided into 1 sec bins. Red curve is a Poisson curve with rate = median count rate of data. |
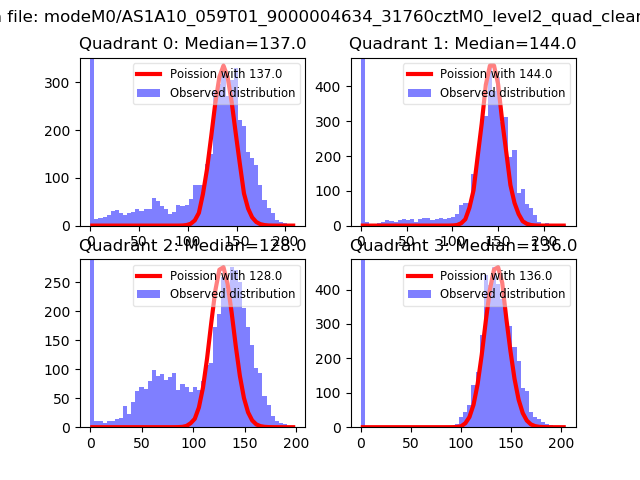 |
 |
| Quadrant-wise count rates Data is divided into 100 sec bins |
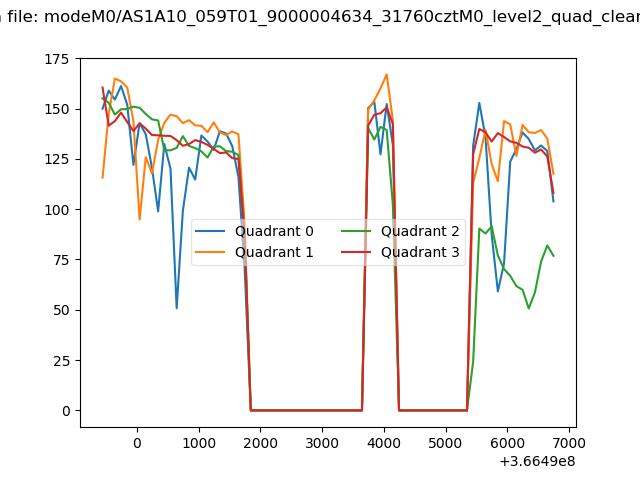 |
|
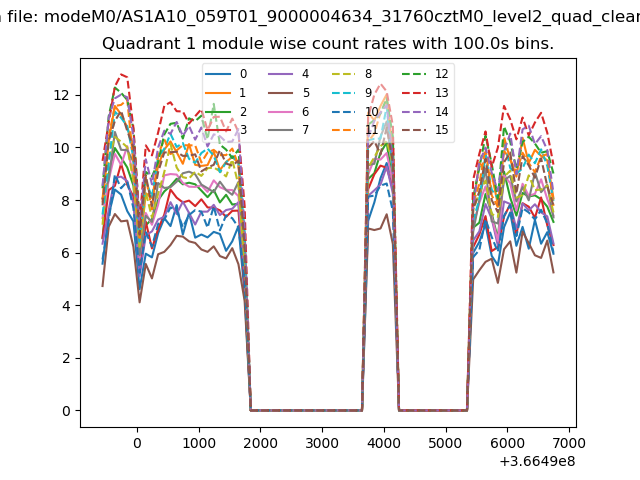
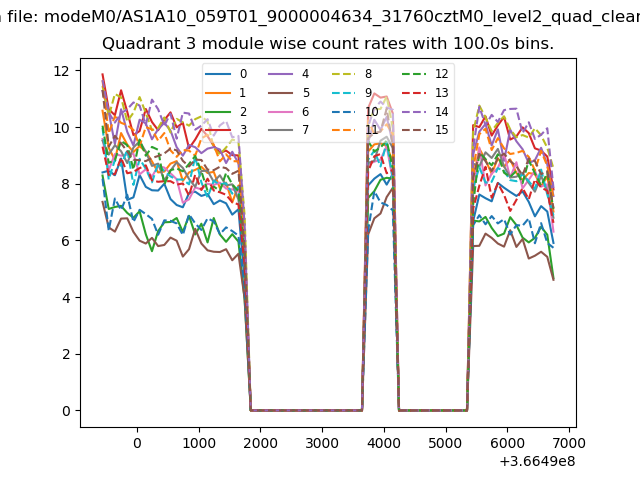
| Module-wise count rates for Quadrant A Data is divided into 100 sec bins |
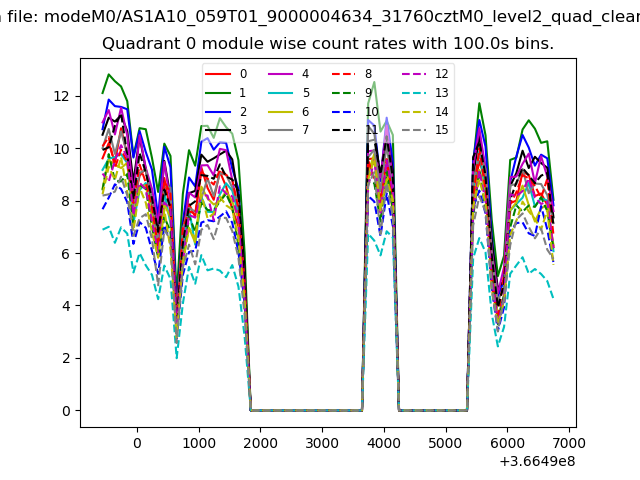 |
 |
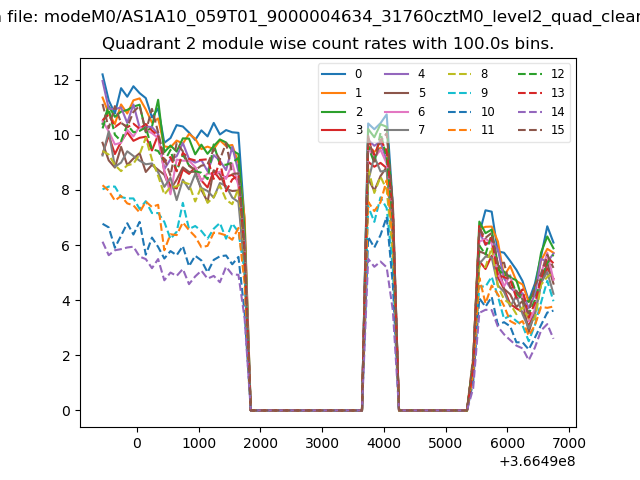
| Module-wise count rates for Quadrant B Data is divided into 100 sec bins |
 |
 |
| Module-wise count rates for Quadrant C Data is divided into 100 sec bins |
 |
 |
| Module-wise count rates for Quadrant D Data is divided into 100 sec bins |
 |
 |
| Parameter | Plot |
|---|---|
| CZT HV Monitor | 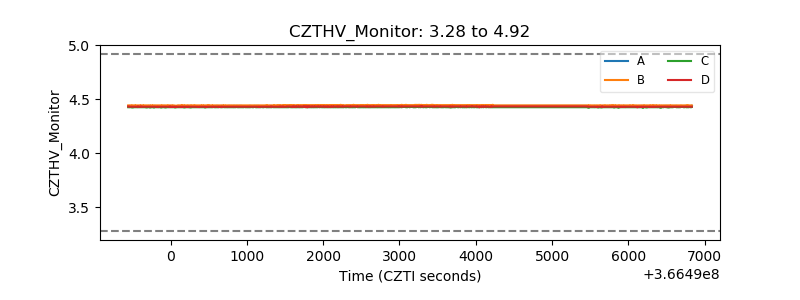 |
| D_VDD | 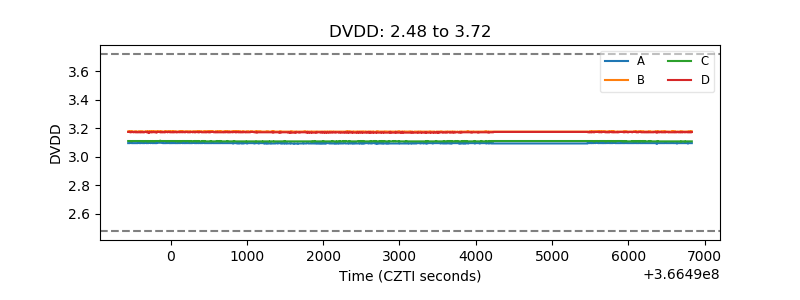 |
| Temperature 1 | 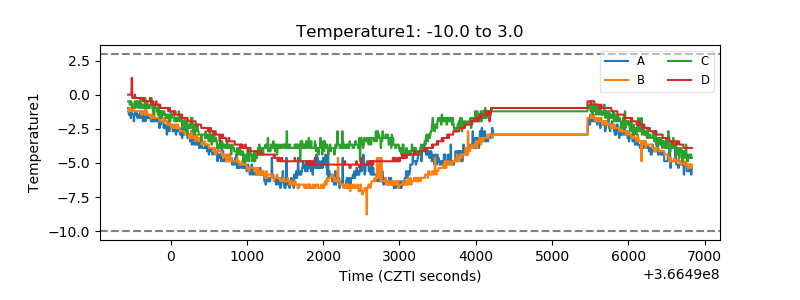 |
| Veto HV Monitor | 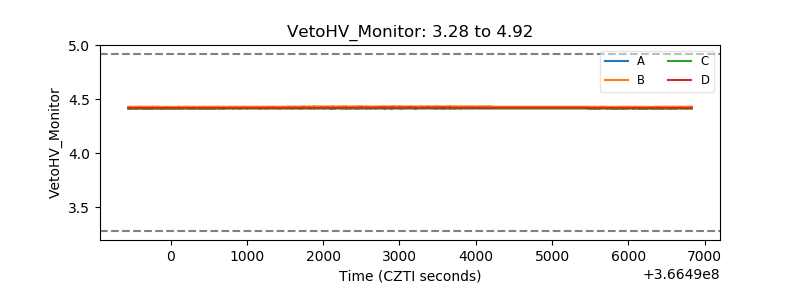 |
| Veto LLD | 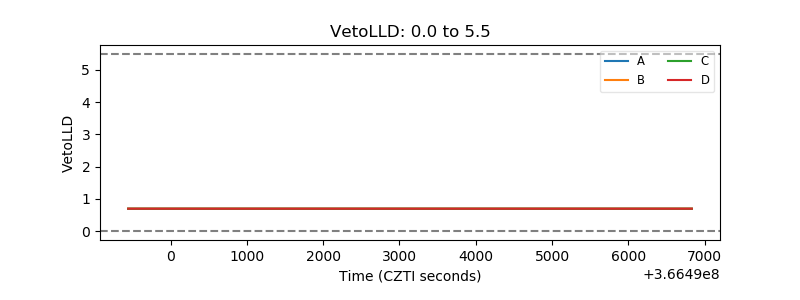 |
| Alpha Counter | 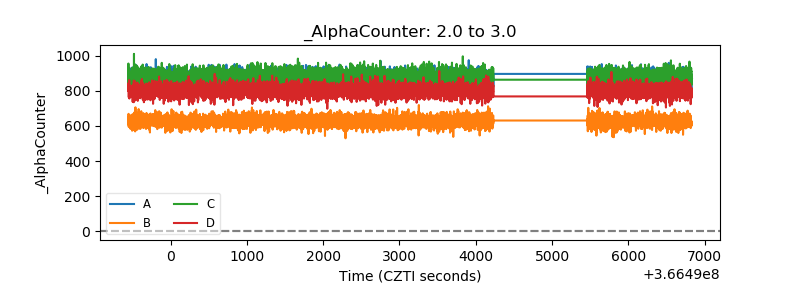 |
| _CPM_Rate | 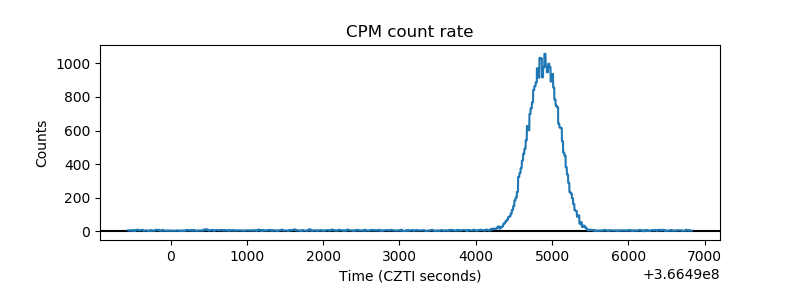 |
| CZT Counter | 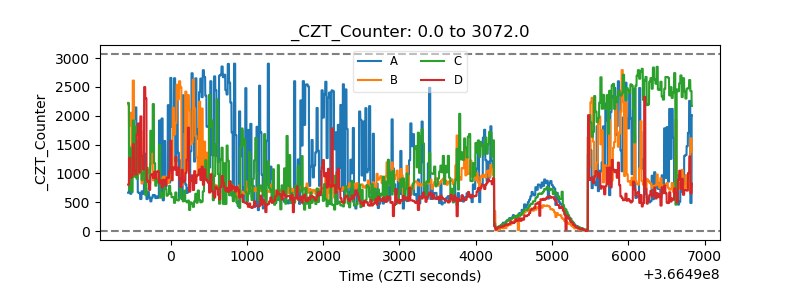 |
| +2.5 Volts monitor |  |
| +5 Volts monitor |  |
| _ROLL_ROT |  |
| _Roll_DEC | 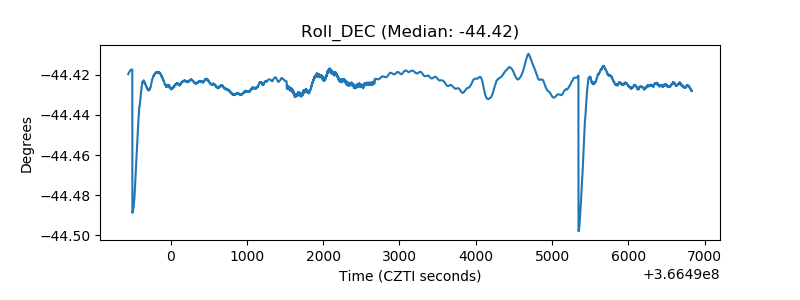 |
| _Roll_RA | 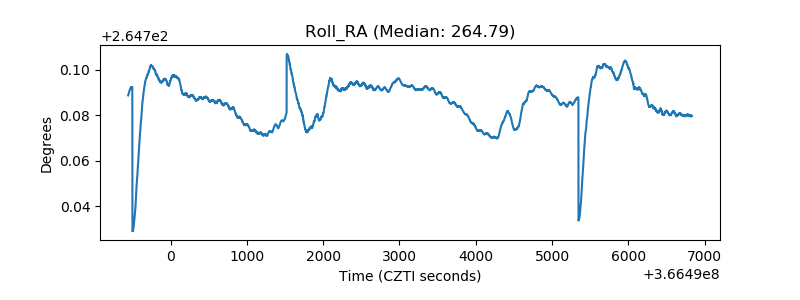 |
| Veto Counter |  |