| Param | Original file | Final file |
|---|---|---|
| Filename | modeM0/AS1A10_059T01_9000004634_31761cztM0_level2.evt | modeM0/AS1A10_059T01_9000004634_31761cztM0_level2_quad_clean.evt |
| Size (bytes) | 750,867,840 | 48,162,240 |
| Size | 716.1 MB | 45.9 MB |
| Events in quadrant A | 6,653,833 | 246,678 |
| Events in quadrant B | 3,804,000 | 345,284 |
| Events in quadrant C | 9,249,117 | 216,075 |
| Events in quadrant D | 2,730,757 | 332,843 |
| Mode SS | |||
|---|---|---|---|
| Quadrant | BADHDUFLAG | Total packets | Discarded packets |
| A | 0 | 90 | 0 |
| B | 0 | 90 | 0 |
| C | 0 | 90 | 0 |
| D | 0 | 90 | 0 |
| Mode M0 | |||
|---|---|---|---|
| Quadrant | BADHDUFLAG | Total packets | Discarded packets |
| A | 0 | 22888 | 0 |
| B | 0 | 14627 | 0 |
| C | 0 | 30551 | 0 |
| D | 0 | 11061 | 0 |
| Quadrant | Total seconds | Saturated seconds | Saturation percentage |
|---|---|---|---|
| A | 4488 | 1919 | 42.758467% |
| B | 4488 | 150 | 3.342246% |
| C | 4488 | 3153 | 70.254011% |
| D | 4488 | 13 | 0.289661% |
Noise dominated data is calculated using 1-second bins in cleaned event files. If a bin has >2000 counts, and if more than 50% of those come from <1% of pixels, then it is considered to be noise-dominated and hence unusable.
| Quadrant | # 1 sec bins | Bins with >0 counts | Bins with >2000 counts | High rate bins dominated by noise | Noise dominated (total time) | Noise dominated (detector-on time) | Marked lightcurve |
|---|---|---|---|---|---|---|---|
| A | 4488 | 4488 | 1284 | 1284 | 28.61% | 28.61% | 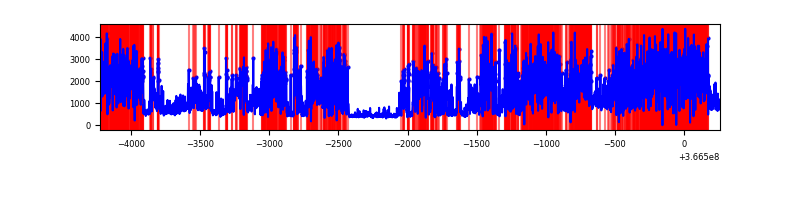 |
| B | 4488 | 4488 | 101 | 101 | 2.25% | 2.25% | 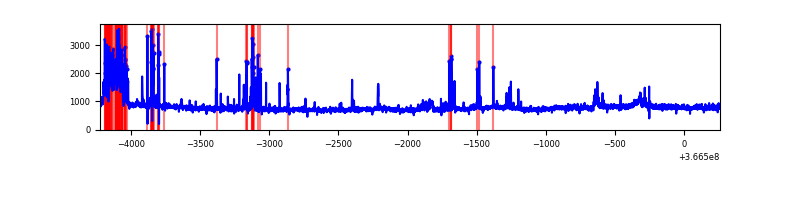 |
| C | 4488 | 4488 | 2783 | 2783 | 62.01% | 62.01% | 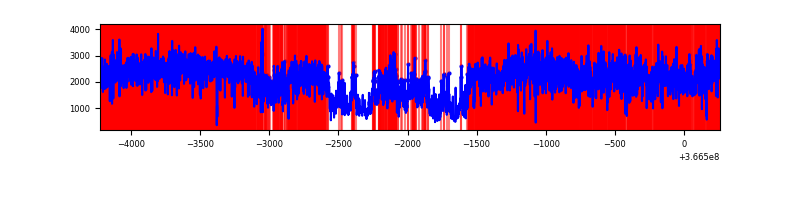 |
| D | 4488 | 4488 | 13 | 13 | 0.29% | 0.29% | 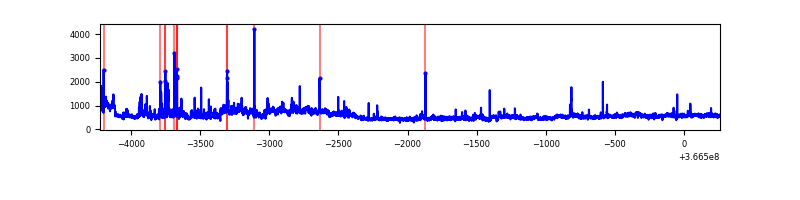 |
Top three noisy pixels from each quadrant. If the there are fewer than three noisy pixels in the level2.evt file, extra rows are filled as -1
| Pixel properties | Quadrant properties | ||||||
|---|---|---|---|---|---|---|---|
| Quadrant | DetID | PixID | Counts | Sigma | Mean | Median | Sigma |
| A | 0 | 13 | 5081025 | 61515.82 | 407 | 401 | 82.6 |
| A | 13 | 254 | 7077 | 80.83 | 407 | 401 | 82.6 |
| A | 3 | 137 | 3871 | 42.01 | 407 | 401 | 82.6 |
| B | 6 | 159 | 1286101 | 12873.43 | 523 | 512 | 99.9 |
| B | 5 | 172 | 286840 | 2867.19 | 523 | 512 | 99.9 |
| B | 5 | 255 | 123038 | 1226.93 | 523 | 512 | 99.9 |
| C | 3 | 233 | 7037789 | 81881.73 | 367 | 369 | 85.9 |
| C | 0 | 10 | 358614 | 4168.25 | 367 | 369 | 85.9 |
| C | 10 | 22 | 353386 | 4107.42 | 367 | 369 | 85.9 |
| D | 8 | 195 | 597167 | 4874.14 | 510 | 496 | 122.4 |
| D | 13 | 249 | 45898 | 370.88 | 510 | 496 | 122.4 |
| D | 2 | 250 | 45816 | 370.21 | 510 | 496 | 122.4 |
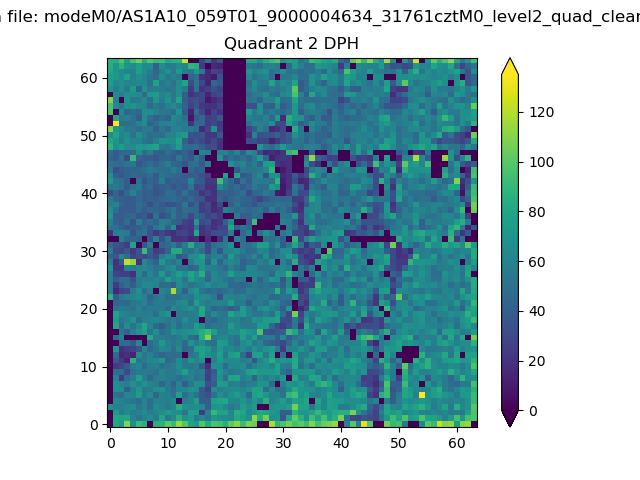
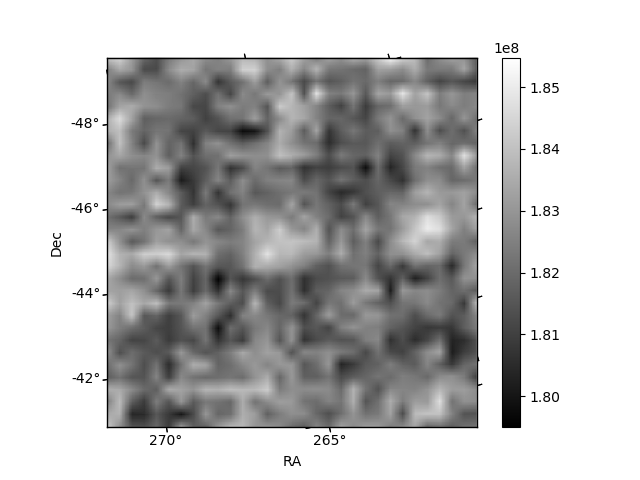
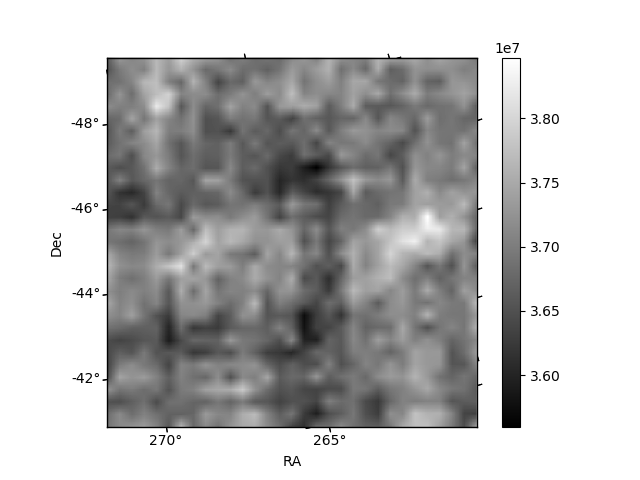
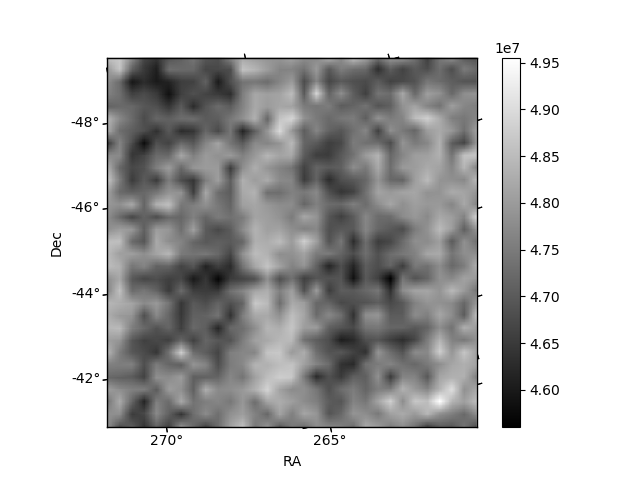
Histogram calculated using DETX and DETY for each event in the final _common_clean file
| Quadrant A | 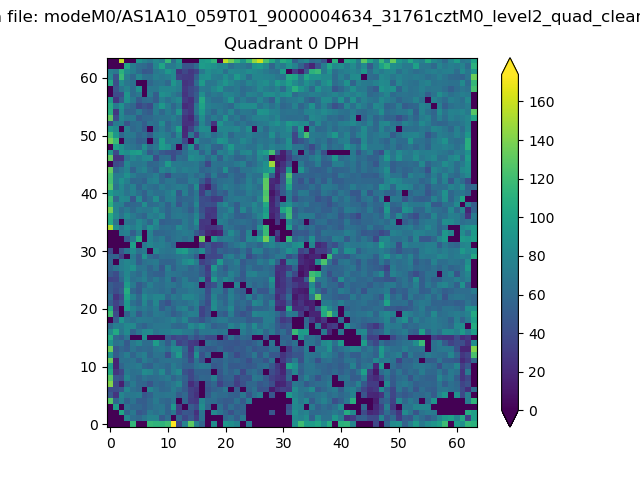 |
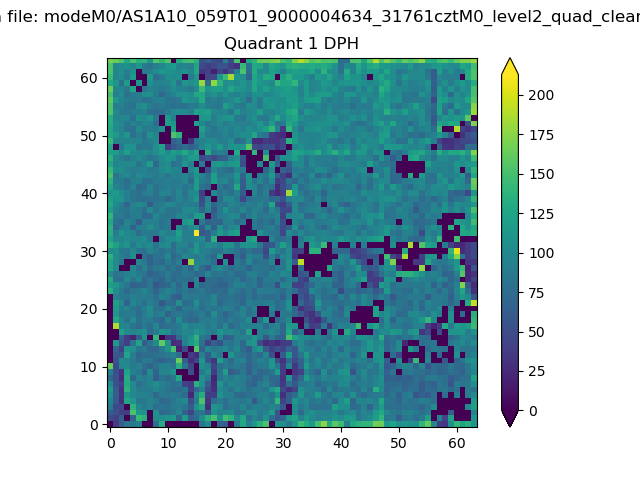 |
Quadrant B |
|---|---|---|---|
| Quadrant D | 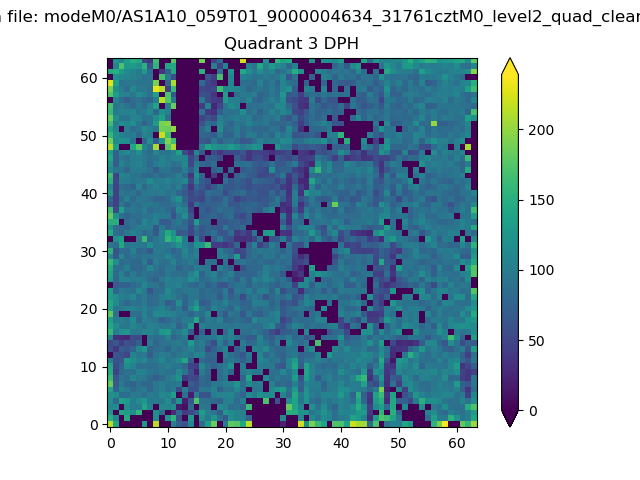 |
 |
Quadrant C |
| Plot type | Count rate plots | Images |
|---|---|---|
| Comparison with Poisson distribution Blue bars denote a histogram of data divided into 1 sec bins. Red curve is a Poisson curve with rate = median count rate of data. |
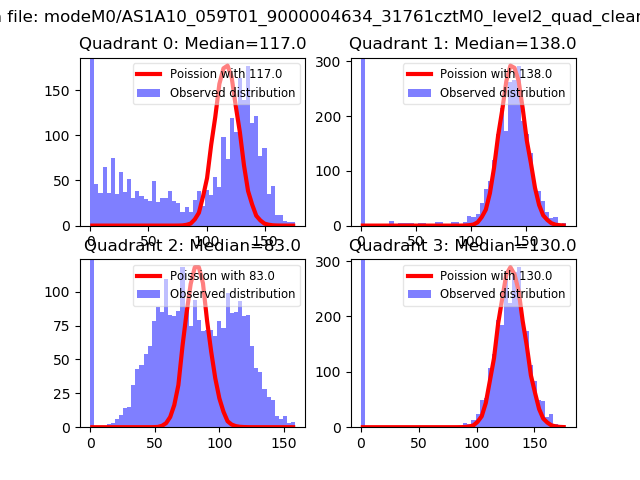 |
 |
| Quadrant-wise count rates Data is divided into 100 sec bins |
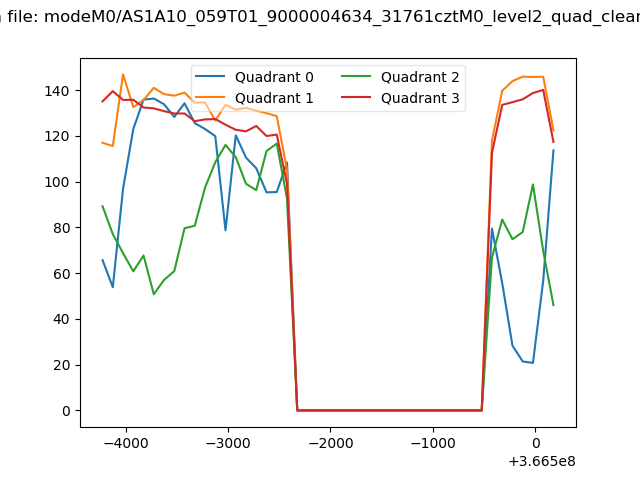 |
|
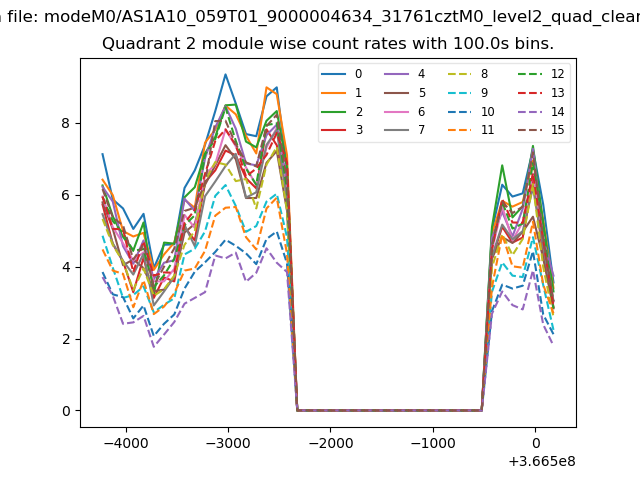
| Module-wise count rates for Quadrant A Data is divided into 100 sec bins |
 |
 |
| Module-wise count rates for Quadrant B Data is divided into 100 sec bins |
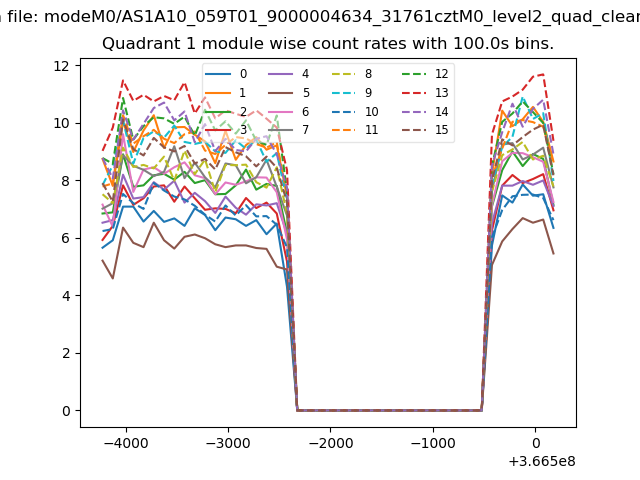 |
 |
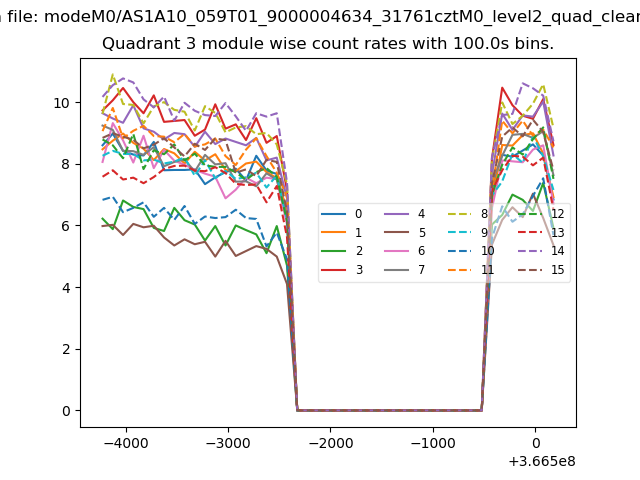
| Module-wise count rates for Quadrant C Data is divided into 100 sec bins |
 |
 |
| Module-wise count rates for Quadrant D Data is divided into 100 sec bins |
 |
 |
| Parameter | Plot |
|---|---|
| CZT HV Monitor | 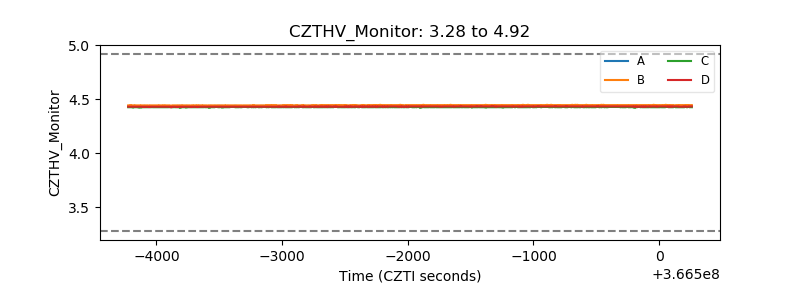 |
| D_VDD | 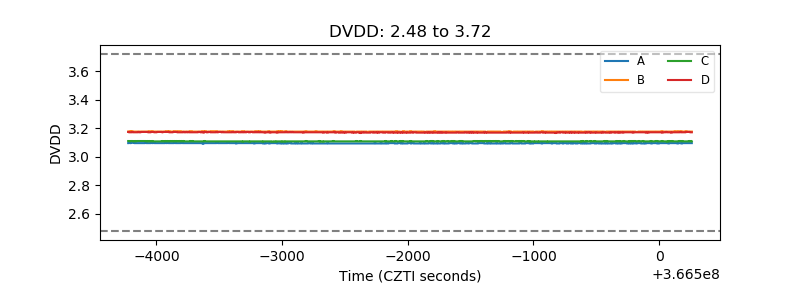 |
| Temperature 1 |  |
| Veto HV Monitor | 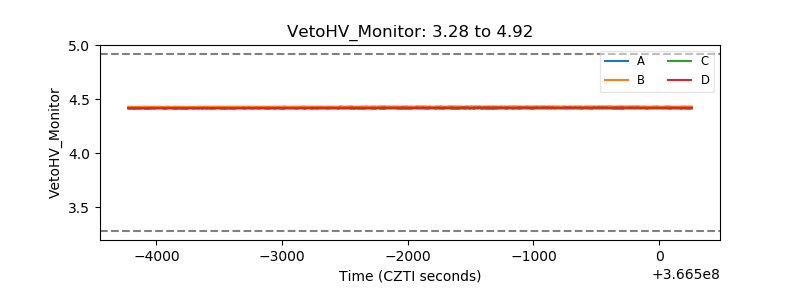 |
| Veto LLD | 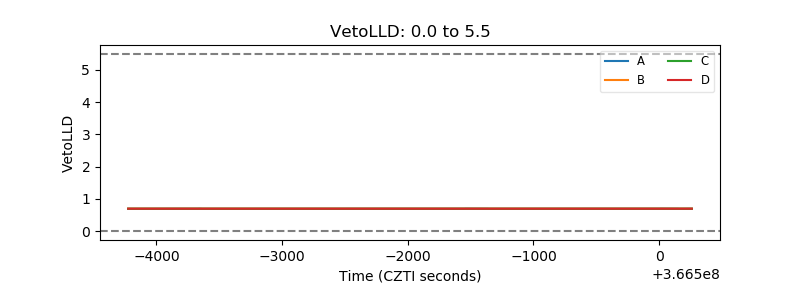 |
| Alpha Counter | 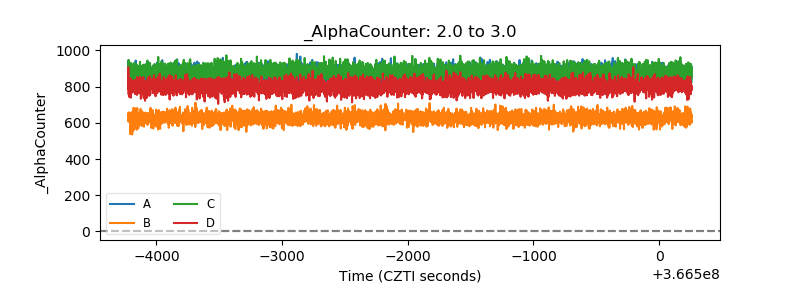 |
| _CPM_Rate | 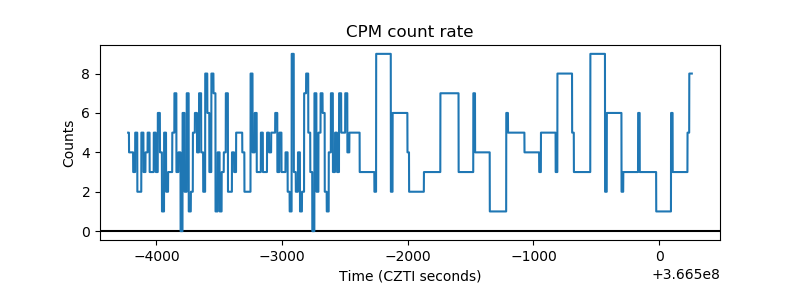 |
| CZT Counter | 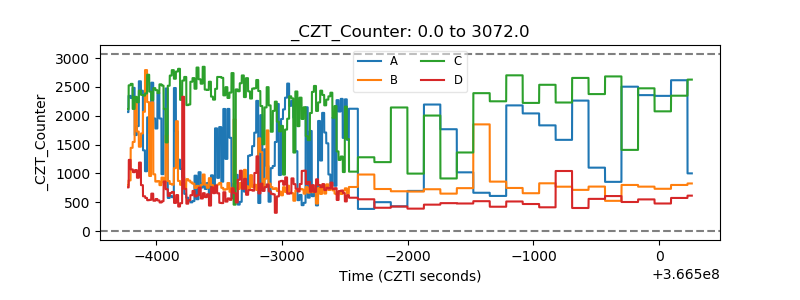 |
| +2.5 Volts monitor |  |
| +5 Volts monitor |  |
| _ROLL_ROT | 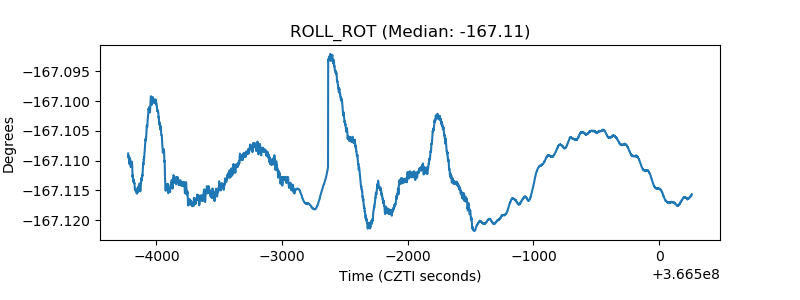 |
| _Roll_DEC |  |
| _Roll_RA | 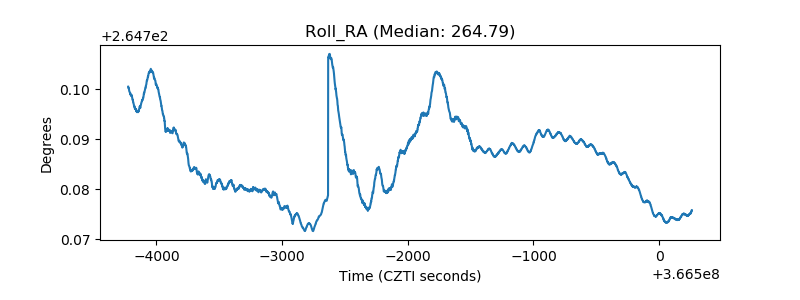 |
| Veto Counter | 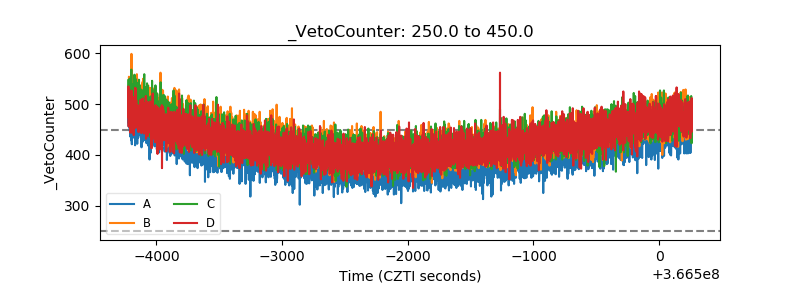 |