| Param | Original file | Final file |
|---|---|---|
| Filename | modeM0/AS1A10_059T02_9000004636cztM0_level2.fits | modeM0/AS1A10_059T02_9000004636cztM0_level2_quad_clean.evt |
| Size (bytes) | 346,072,320 | 255,833,280 |
| Size | 330.0 MB | 244.0 MB |
| Events in quadrant A | 1,847,576 | 1,030,093 |
| Events in quadrant B | 2,074,022 | 1,448,859 |
| Events in quadrant C | 2,049,492 | 1,337,268 |
| Events in quadrant D | 1,874,636 | 1,302,855 |
| Mode M9 | |||
|---|---|---|---|
| Quadrant | BADHDUFLAG | Total packets | Discarded packets |
| A | 0 | 39 | 0 |
| B | 0 | 40 | 0 |
| C | 0 | 41 | 0 |
| D | 0 | 37 | 0 |
| Mode SS | |||
|---|---|---|---|
| Quadrant | BADHDUFLAG | Total packets | Discarded packets |
| A | 0 | 794 | 0 |
| B | 0 | 776 | 0 |
| C | 0 | 802 | 0 |
| D | 0 | 800 | 0 |
| Mode M0 | |||
|---|---|---|---|
| Quadrant | BADHDUFLAG | Total packets | Discarded packets |
| A | 0 | 153556 | 0 |
| B | 0 | 124374 | 0 |
| C | 0 | 116720 | 0 |
| D | 0 | 102872 | 0 |
| Quadrant | Total seconds | Saturated seconds | Saturation percentage |
|---|---|---|---|
| A | 38644 | 12160 | 31.466722% |
| B | 38494 | 1986 | 5.159246% |
| C | 37803 | 3690 | 9.761130% |
| D | 37826 | 1526 | 4.034262% |
Noise dominated data is calculated using 1-second bins in cleaned event files. If a bin has >2000 counts, and if more than 50% of those come from <1% of pixels, then it is considered to be noise-dominated and hence unusable.
| Quadrant | # 1 sec bins | Bins with >0 counts | Bins with >2000 counts | High rate bins dominated by noise | Noise dominated (total time) | Noise dominated (detector-on time) | Marked lightcurve |
|---|---|---|---|---|---|---|---|
| A | 41358 | 37079 | 0 | 0 | 0.00% | 0.00% | 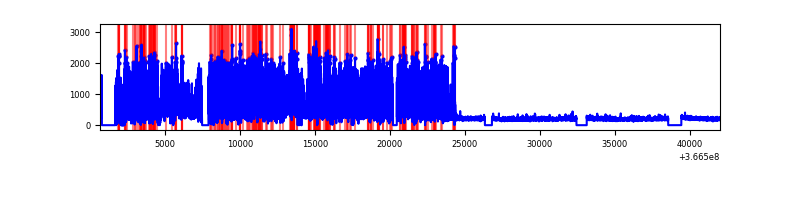 |
| B | 41358 | 37459 | 0 | 0 | 0.00% | 0.00% |  |
| C | 41358 | 36720 | 0 | 0 | 0.00% | 0.00% | 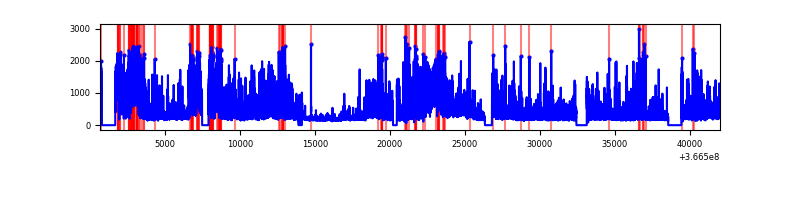 |
| D | 41358 | 36637 | 0 | 0 | 0.00% | 0.00% |  |
Top three noisy pixels from each quadrant. If the there are fewer than three noisy pixels in the level2.evt file, extra rows are filled as -1
| Pixel properties | Quadrant properties | ||||||
|---|---|---|---|---|---|---|---|
| Quadrant | DetID | PixID | Counts | Sigma | Mean | Median | Sigma |
| A | 0 | 29 | 1601 | 9.68 | 481 | 453 | 118.6 |
| A | 7 | 110 | 1499 | 8.82 | 481 | 453 | 118.6 |
| A | 9 | 19 | 1377 | 7.79 | 481 | 453 | 118.6 |
| B | 2 | 9 | 1707 | 10.76 | 550 | 525 | 109.8 |
| B | 2 | 8 | 1439 | 8.32 | 550 | 525 | 109.8 |
| B | 3 | 17 | 1402 | 7.98 | 550 | 525 | 109.8 |
| C | 12 | 241 | 1466 | 7.0 | 543 | 508 | 136.9 |
| C | 3 | 187 | 1445 | 6.84 | 543 | 508 | 136.9 |
| C | 9 | 209 | 1428 | 6.72 | 543 | 508 | 136.9 |
| D | 3 | 14 | 1395 | 6.37 | 535 | 486 | 142.6 |
| D | 15 | 47 | 1362 | 6.14 | 535 | 486 | 142.6 |
| D | 6 | 67 | 1312 | 5.79 | 535 | 486 | 142.6 |
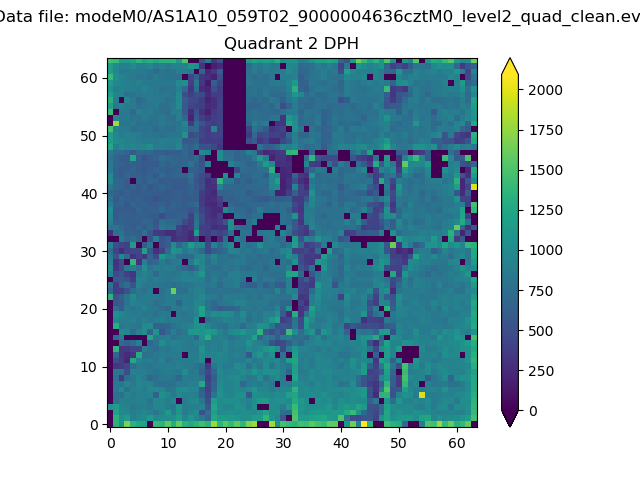
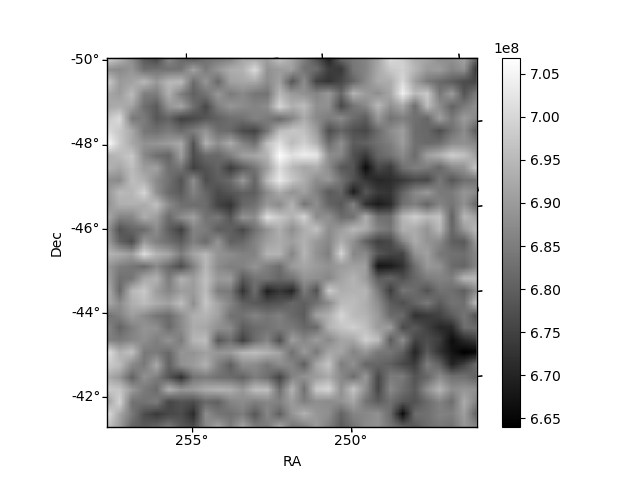
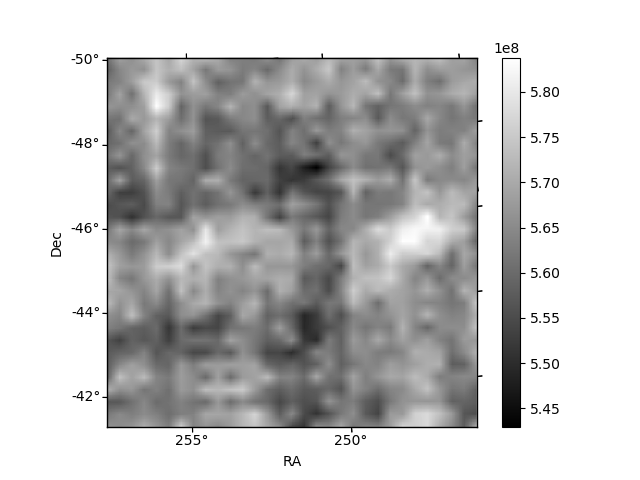
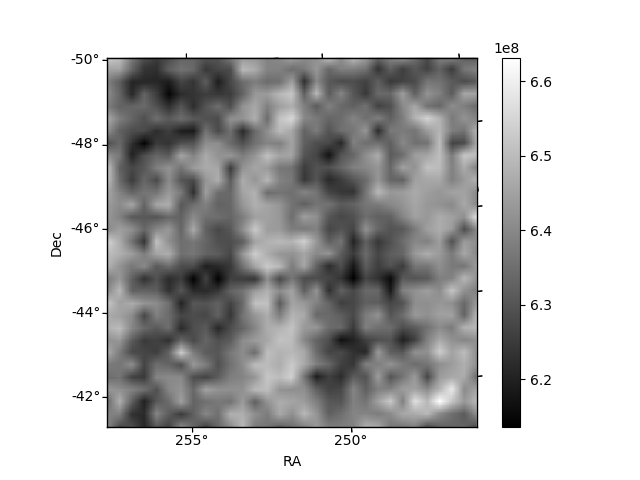
Histogram calculated using DETX and DETY for each event in the final _common_clean file
| Quadrant A | 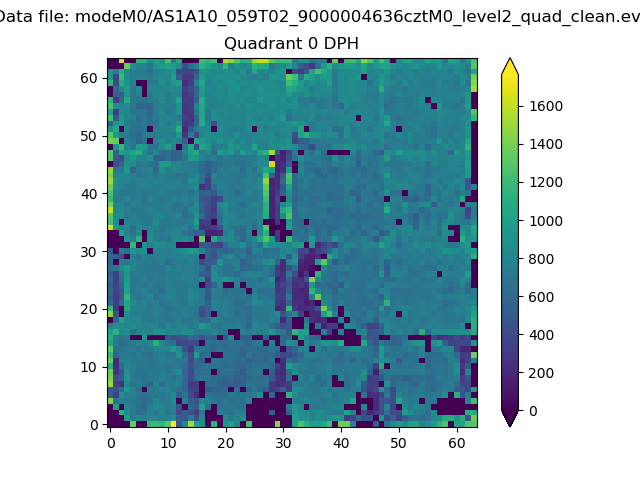 |
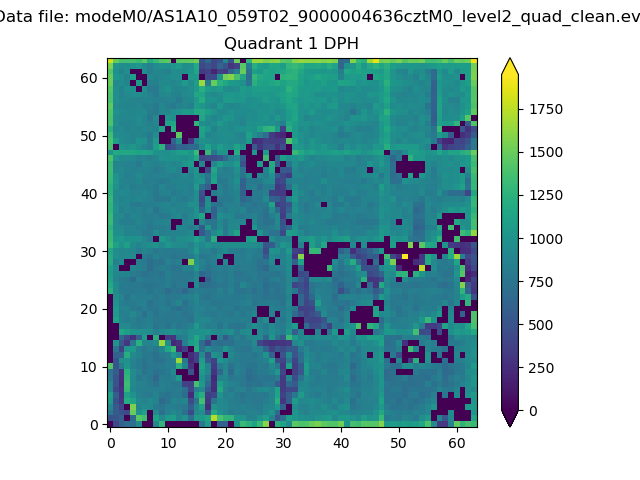 |
Quadrant B |
|---|---|---|---|
| Quadrant D | 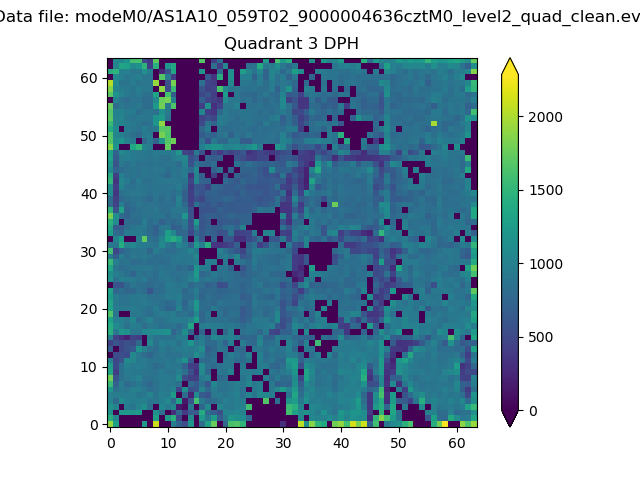 |
 |
Quadrant C |
| Plot type | Count rate plots | Images |
|---|---|---|
| Comparison with Poisson distribution Blue bars denote a histogram of data divided into 1 sec bins. Red curve is a Poisson curve with rate = median count rate of data. |
 |
 |
| Quadrant-wise count rates Data is divided into 100 sec bins |
 |
|
| Module-wise count rates for Quadrant A Data is divided into 100 sec bins |
 |
 |
| Module-wise count rates for Quadrant B Data is divided into 100 sec bins |
 |
 |
| Module-wise count rates for Quadrant C Data is divided into 100 sec bins |
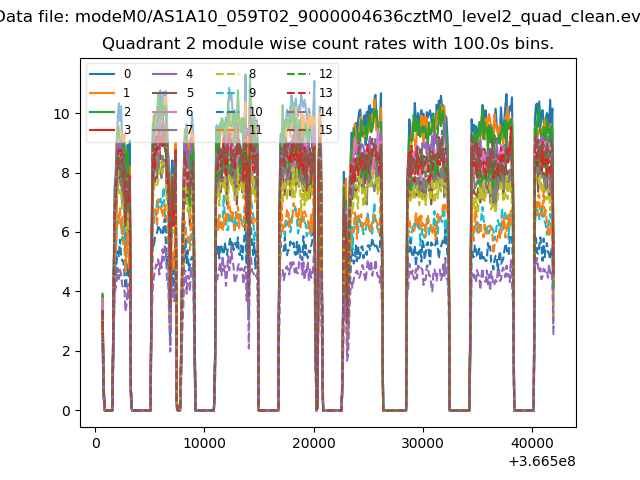 |
 |
| Module-wise count rates for Quadrant D Data is divided into 100 sec bins |
 |
 |
| Parameter | Plot |
|---|---|
| CZT HV Monitor |  |
| D_VDD |  |
| Temperature 1 | 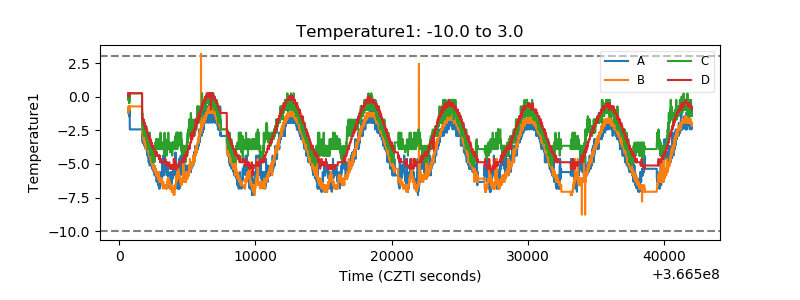 |
| Veto HV Monitor | 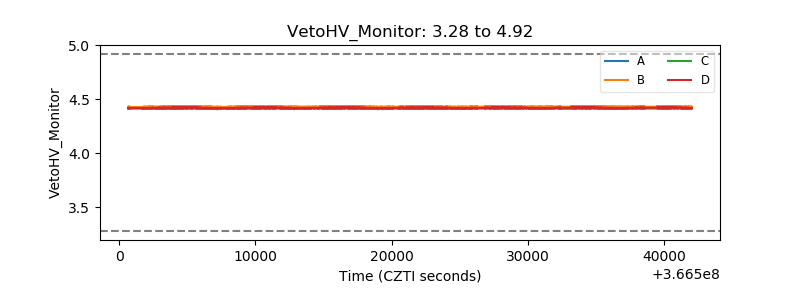 |
| Veto LLD | 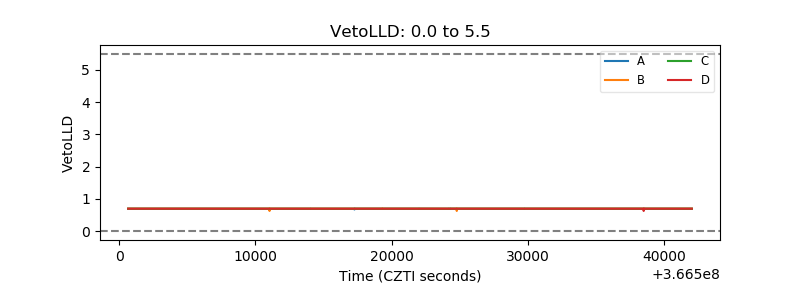 |
| Alpha Counter |  |
| _CPM_Rate | 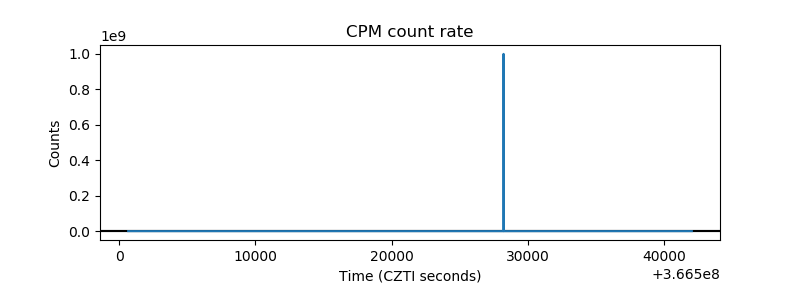 |
| CZT Counter |  |
| +2.5 Volts monitor |  |
| +5 Volts monitor |  |
| _ROLL_ROT |  |
| _Roll_DEC | 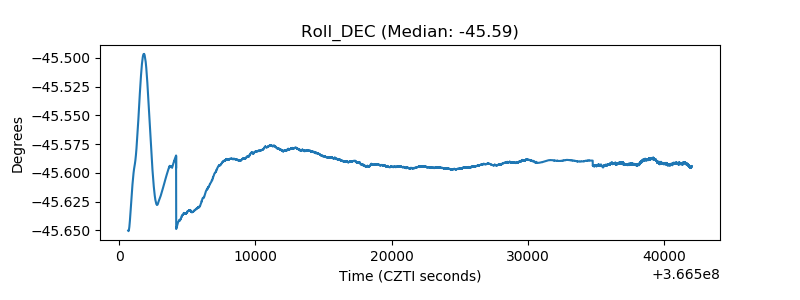 |
| _Roll_RA | 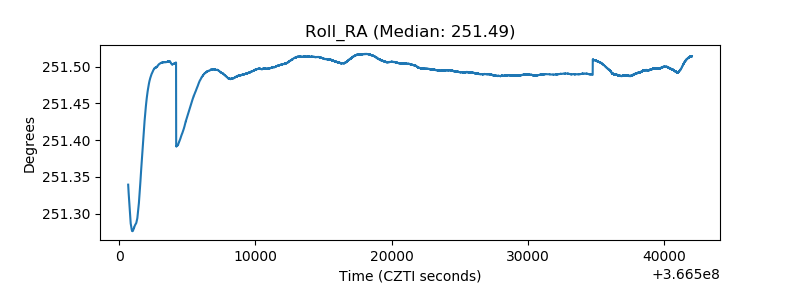 |
| Veto Counter |  |