| Param | Original file | Final file |
|---|---|---|
| Filename | modeM0/AS1A10_059T02_9000004636_31761cztM0_level2.evt | modeM0/AS1A10_059T02_9000004636_31761cztM0_level2_quad_clean.evt |
| Size (bytes) | 256,556,160 | 25,139,520 |
| Size | 244.7 MB | 24.0 MB |
| Events in quadrant A | 2,326,759 | 106,883 |
| Events in quadrant B | 1,420,949 | 195,443 |
| Events in quadrant C | 2,356,608 | 158,823 |
| Events in quadrant D | 1,561,567 | 187,187 |
| Mode M9 | |||
|---|---|---|---|
| Quadrant | BADHDUFLAG | Total packets | Discarded packets |
| A | 0 | 9 | 0 |
| B | 0 | 9 | 0 |
| C | 0 | 9 | 0 |
| D | 0 | 9 | 0 |
| Mode SS | |||
|---|---|---|---|
| Quadrant | BADHDUFLAG | Total packets | Discarded packets |
| A | 0 | 32 | 0 |
| B | 0 | 32 | 0 |
| C | 0 | 32 | 0 |
| D | 0 | 32 | 0 |
| Mode M0 | |||
|---|---|---|---|
| Quadrant | BADHDUFLAG | Total packets | Discarded packets |
| A | 0 | 7950 | 1 |
| B | 0 | 5335 | 1 |
| C | 0 | 8057 | 1 |
| D | 0 | 5779 | 1 |
| Quadrant | Total seconds | Saturated seconds | Saturation percentage |
|---|---|---|---|
| A | 1509 | 987 | 65.407555% |
| B | 1509 | 183 | 12.127237% |
| C | 1509 | 531 | 35.188867% |
| D | 1508 | 123 | 8.156499% |
Noise dominated data is calculated using 1-second bins in cleaned event files. If a bin has >2000 counts, and if more than 50% of those come from <1% of pixels, then it is considered to be noise-dominated and hence unusable.
| Quadrant | # 1 sec bins | Bins with >0 counts | Bins with >2000 counts | High rate bins dominated by noise | Noise dominated (total time) | Noise dominated (detector-on time) | Marked lightcurve |
|---|---|---|---|---|---|---|---|
| A | 2404 | 1510 | 442 | 442 | 18.39% | 29.27% | 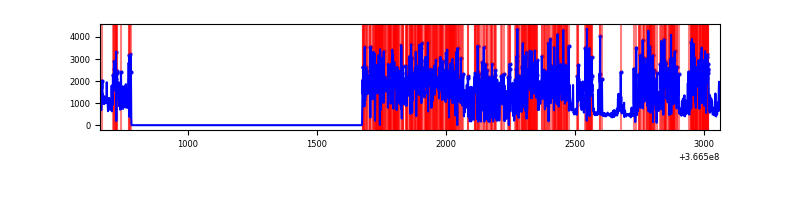 |
| B | 2404 | 1510 | 71 | 71 | 2.95% | 4.70% | 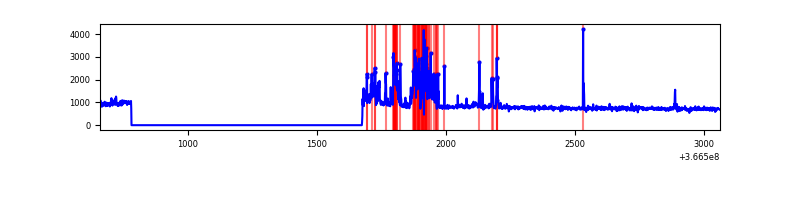 |
| C | 2404 | 1510 | 386 | 386 | 16.06% | 25.56% | 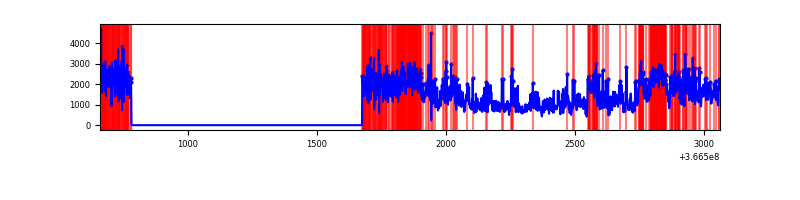 |
| D | 2403 | 1509 | 99 | 99 | 4.12% | 6.56% | 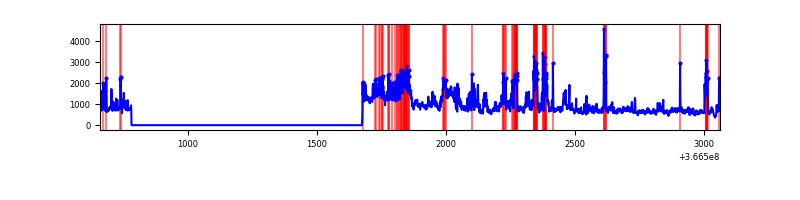 |
Top three noisy pixels from each quadrant. If the there are fewer than three noisy pixels in the level2.evt file, extra rows are filled as -1
| Pixel properties | Quadrant properties | ||||||
|---|---|---|---|---|---|---|---|
| Quadrant | DetID | PixID | Counts | Sigma | Mean | Median | Sigma |
| A | 0 | 13 | 1920643 | 83338.16 | 104 | 102 | 23.0 |
| A | 13 | 254 | 1879 | 77.11 | 104 | 102 | 23.0 |
| A | 3 | 137 | 1080 | 42.44 | 104 | 102 | 23.0 |
| B | 6 | 159 | 425564 | 11579.1 | 180 | 176 | 36.7 |
| B | 5 | 172 | 252949 | 6880.5 | 180 | 176 | 36.7 |
| B | 5 | 255 | 15845 | 426.51 | 180 | 176 | 36.7 |
| C | 3 | 233 | 1474654 | 41165.19 | 146 | 147 | 35.8 |
| C | 0 | 10 | 277378 | 7739.72 | 146 | 147 | 35.8 |
| C | 14 | 238 | 23299 | 646.36 | 146 | 147 | 35.8 |
| D | 8 | 195 | 427284 | 9848.6 | 175 | 169 | 43.4 |
| D | 12 | 218 | 348021 | 8020.92 | 175 | 169 | 43.4 |
| D | 2 | 250 | 40114 | 921.07 | 175 | 169 | 43.4 |
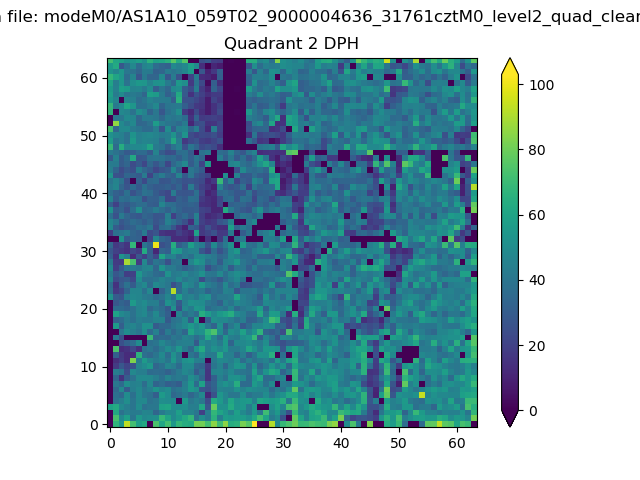
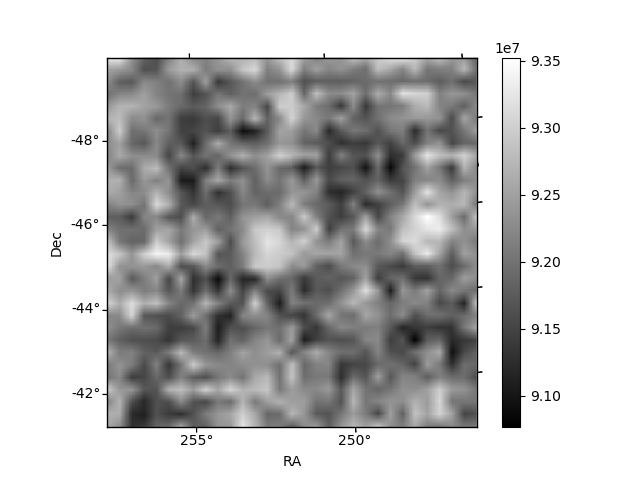
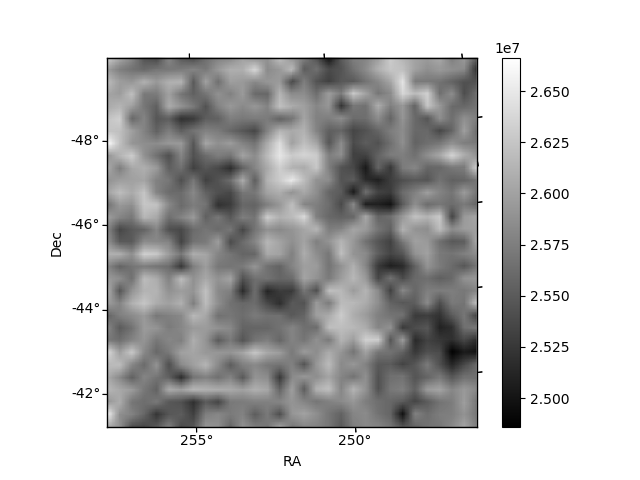
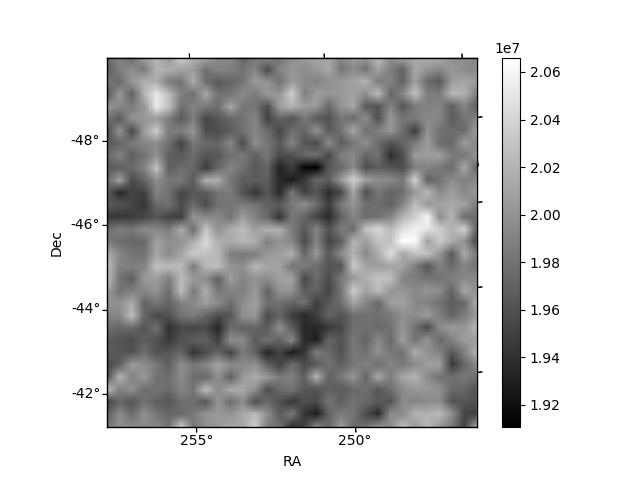
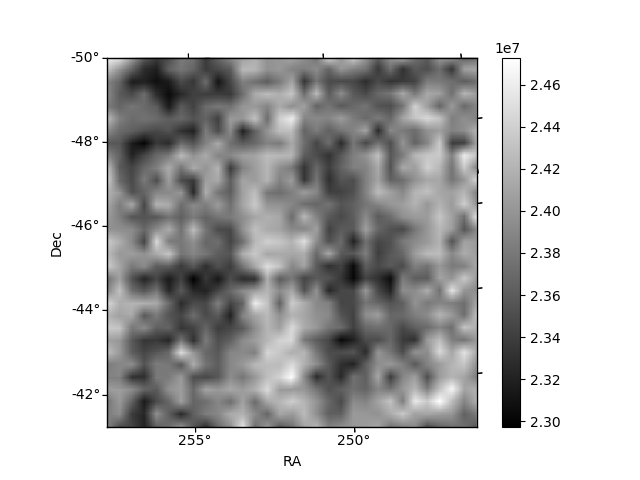
Histogram calculated using DETX and DETY for each event in the final _common_clean file
| Quadrant A | 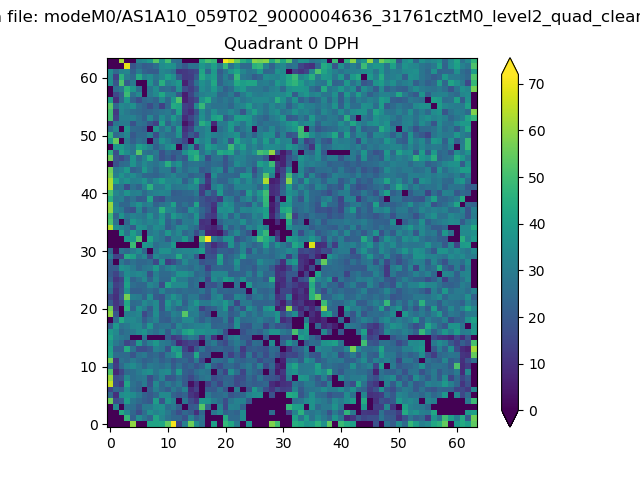 |
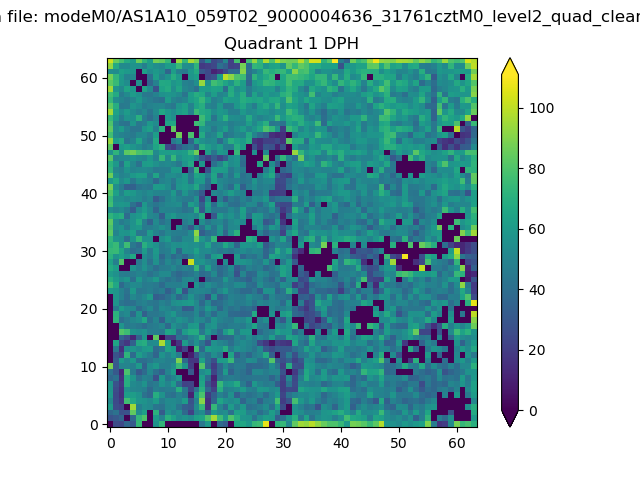 |
Quadrant B |
|---|---|---|---|
| Quadrant D | 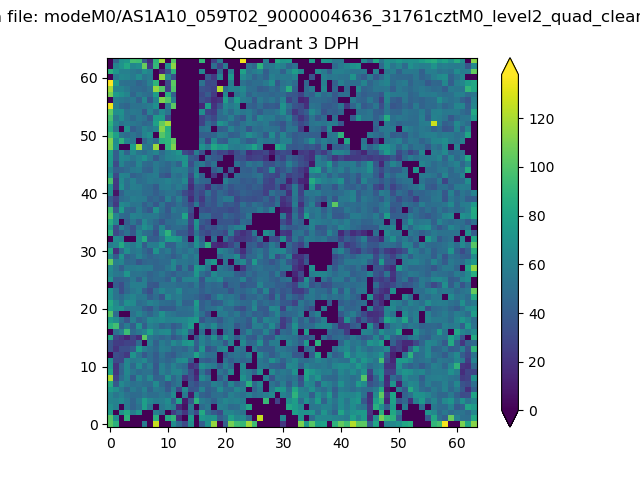 |
 |
Quadrant C |
| Plot type | Count rate plots | Images |
|---|---|---|
| Comparison with Poisson distribution Blue bars denote a histogram of data divided into 1 sec bins. Red curve is a Poisson curve with rate = median count rate of data. |
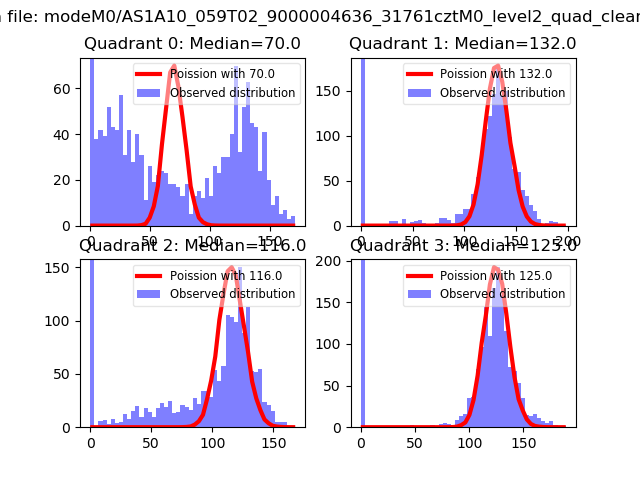 |
 |
| Quadrant-wise count rates Data is divided into 100 sec bins |
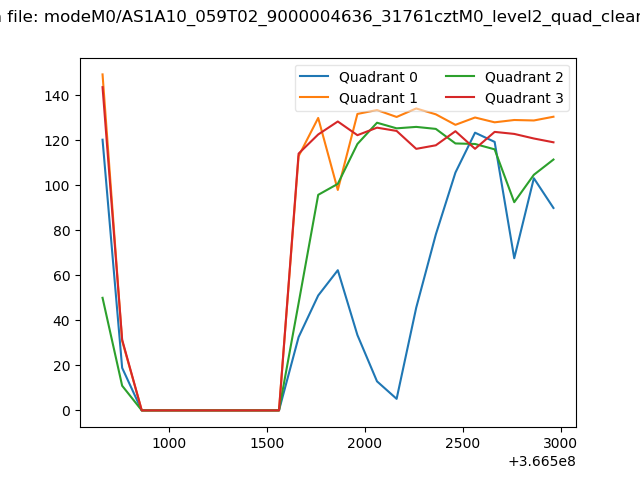 |
|
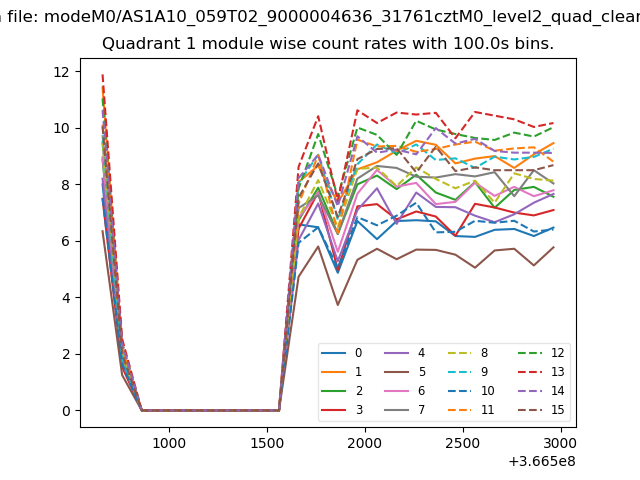
| Module-wise count rates for Quadrant A Data is divided into 100 sec bins |
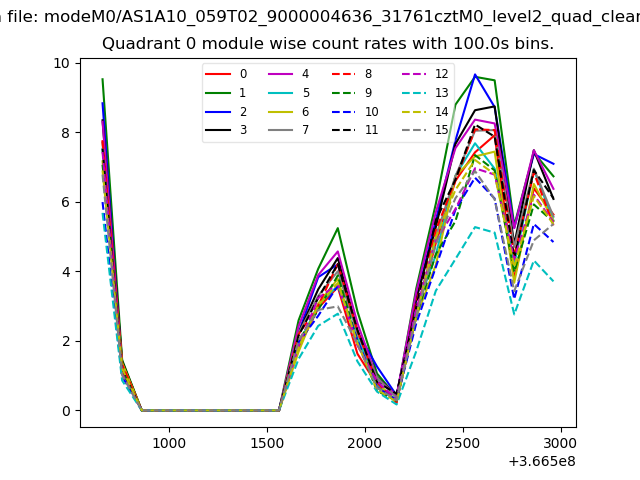 |
 |
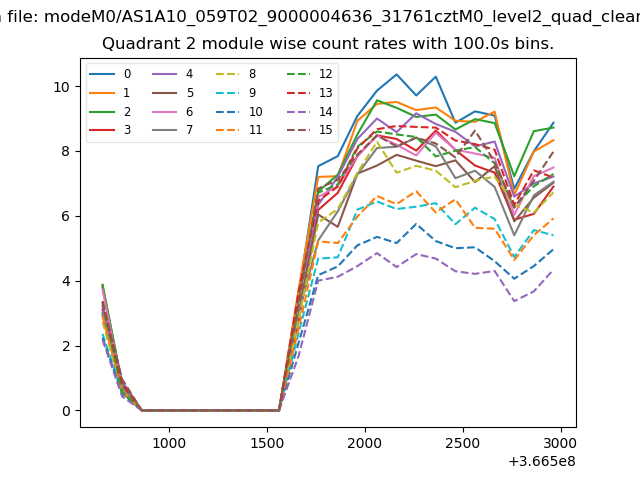
| Module-wise count rates for Quadrant B Data is divided into 100 sec bins |
 |
 |
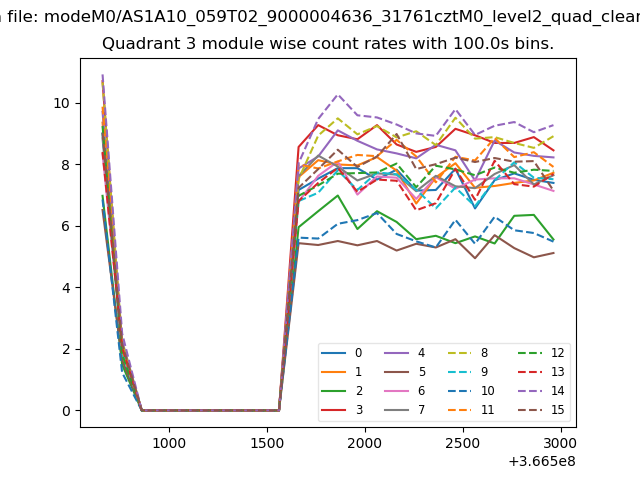
| Module-wise count rates for Quadrant C Data is divided into 100 sec bins |
 |
 |
| Module-wise count rates for Quadrant D Data is divided into 100 sec bins |
 |
 |
| Parameter | Plot |
|---|---|
| CZT HV Monitor | 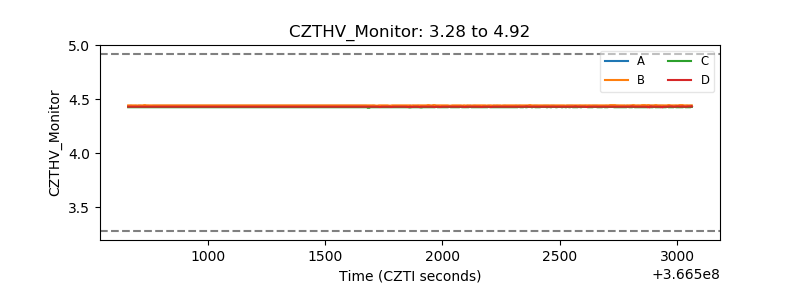 |
| D_VDD | 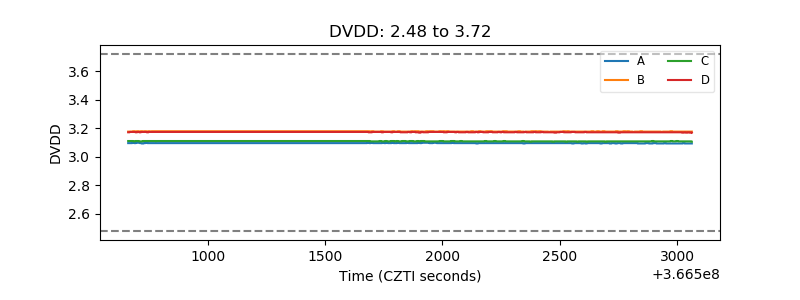 |
| Temperature 1 | 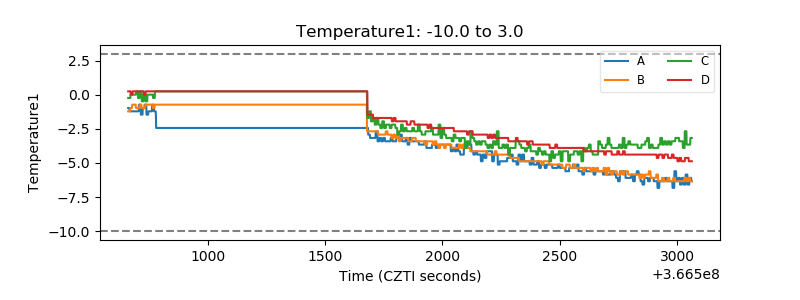 |
| Veto HV Monitor | 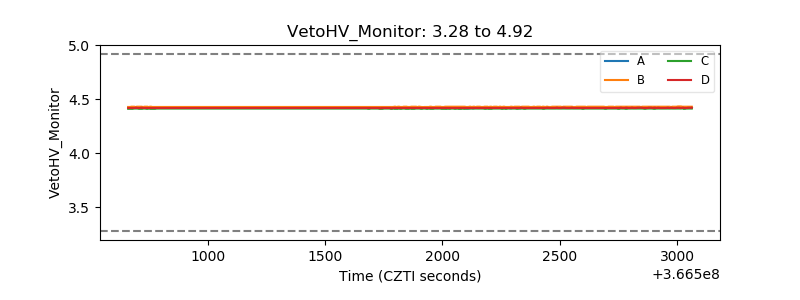 |
| Veto LLD | 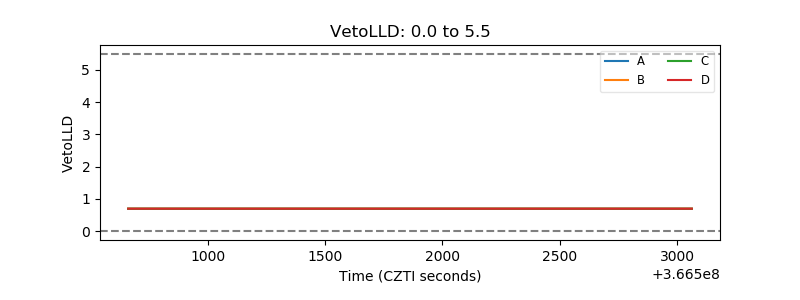 |
| Alpha Counter | 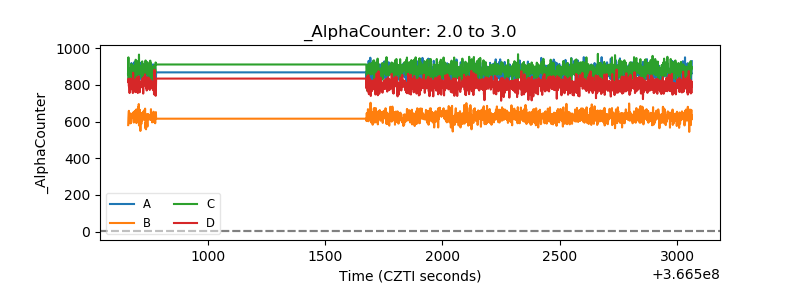 |
| _CPM_Rate | 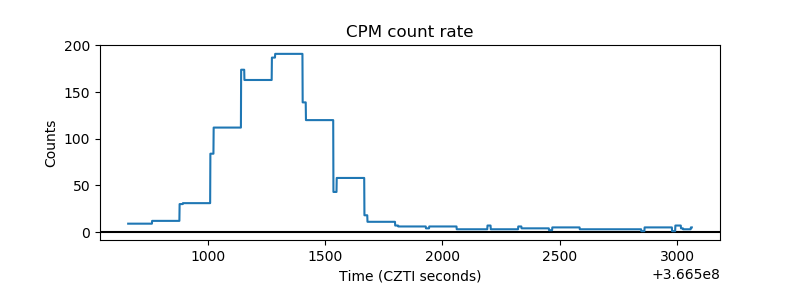 |
| CZT Counter | 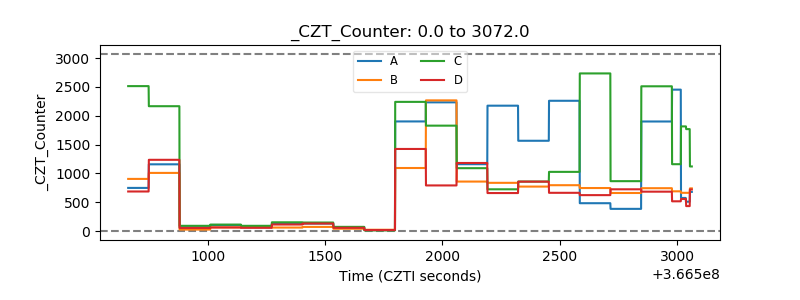 |
| +2.5 Volts monitor |  |
| +5 Volts monitor |  |
| _ROLL_ROT | 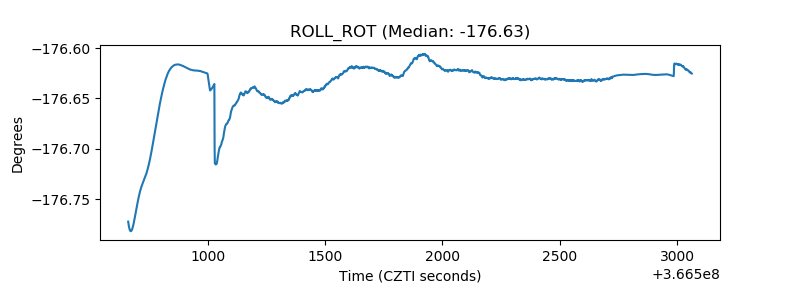 |
| _Roll_DEC | 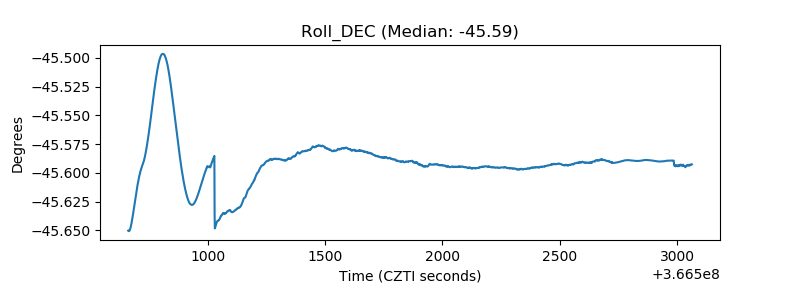 |
| _Roll_RA | 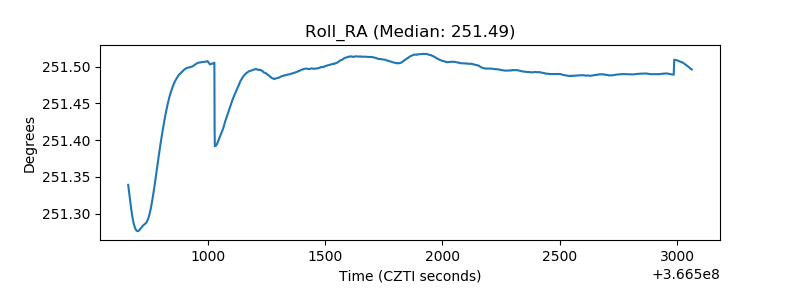 |
| Veto Counter |  |