| Param | Original file | Final file |
|---|---|---|
| Filename | modeM0/AS1A10_059T02_9000004636_31762cztM0_level2.evt | modeM0/AS1A10_059T02_9000004636_31762cztM0_level2_quad_clean.evt |
| Size (bytes) | 1,057,832,640 | 93,346,560 |
| Size | 1008.8 MB | 89.0 MB |
| Events in quadrant A | 11,859,859 | 452,450 |
| Events in quadrant B | 6,273,771 | 655,271 |
| Events in quadrant C | 7,979,105 | 579,829 |
| Events in quadrant D | 5,436,313 | 632,401 |
| Mode M9 | |||
|---|---|---|---|
| Quadrant | BADHDUFLAG | Total packets | Discarded packets |
| A | 0 | 11 | 0 |
| B | 0 | 12 | 0 |
| C | 0 | 12 | 0 |
| D | 0 | 12 | 0 |
| Mode SS | |||
|---|---|---|---|
| Quadrant | BADHDUFLAG | Total packets | Discarded packets |
| A | 0 | 148 | 0 |
| B | 0 | 148 | 0 |
| C | 0 | 148 | 0 |
| D | 0 | 148 | 0 |
| Mode M0 | |||
|---|---|---|---|
| Quadrant | BADHDUFLAG | Total packets | Discarded packets |
| A | 0 | 40295 | 2 |
| B | 0 | 24046 | 2 |
| C | 0 | 28616 | 3 |
| D | 0 | 21131 | 2 |
| Quadrant | Total seconds | Saturated seconds | Saturation percentage |
|---|---|---|---|
| A | 7246 | 4334 | 59.812310% |
| B | 7246 | 457 | 6.306928% |
| C | 7245 | 1361 | 18.785369% |
| D | 7245 | 282 | 3.892340% |
Noise dominated data is calculated using 1-second bins in cleaned event files. If a bin has >2000 counts, and if more than 50% of those come from <1% of pixels, then it is considered to be noise-dominated and hence unusable.
| Quadrant | # 1 sec bins | Bins with >0 counts | Bins with >2000 counts | High rate bins dominated by noise | Noise dominated (total time) | Noise dominated (detector-on time) | Marked lightcurve |
|---|---|---|---|---|---|---|---|
| A | 7676 | 7247 | 2476 | 2476 | 32.26% | 34.17% | 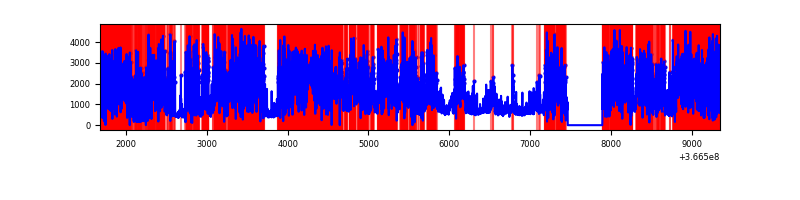 |
| B | 7676 | 7247 | 209 | 209 | 2.72% | 2.88% | 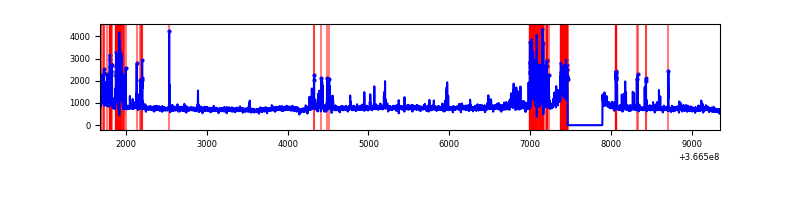 |
| C | 7675 | 7246 | 939 | 939 | 12.23% | 12.96% | 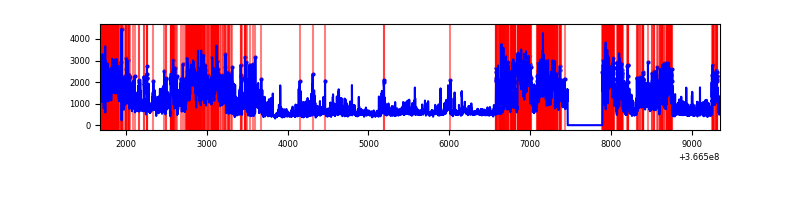 |
| D | 7675 | 7246 | 193 | 193 | 2.51% | 2.66% | 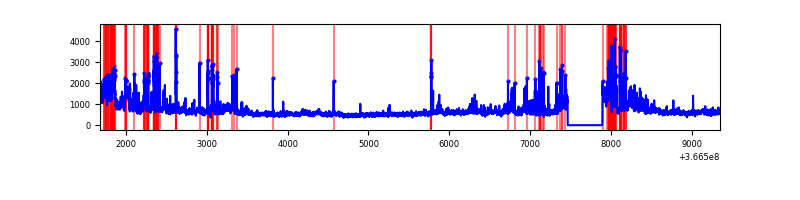 |
Top three noisy pixels from each quadrant. If the there are fewer than three noisy pixels in the level2.evt file, extra rows are filled as -1
| Pixel properties | Quadrant properties | ||||||
|---|---|---|---|---|---|---|---|
| Quadrant | DetID | PixID | Counts | Sigma | Mean | Median | Sigma |
| A | 0 | 13 | 9648559 | 83970.58 | 571 | 560 | 114.9 |
| A | 13 | 254 | 9867 | 81.0 | 571 | 560 | 114.9 |
| A | 3 | 137 | 5779 | 45.42 | 571 | 560 | 114.9 |
| B | 6 | 159 | 2013278 | 12429.79 | 843 | 822 | 161.9 |
| B | 5 | 172 | 716830 | 4422.37 | 843 | 822 | 161.9 |
| B | 5 | 255 | 100655 | 616.61 | 843 | 822 | 161.9 |
| C | 3 | 233 | 3397366 | 18965.86 | 769 | 772 | 179.1 |
| C | 0 | 10 | 1034399 | 5771.55 | 769 | 772 | 179.1 |
| C | 10 | 22 | 386123 | 2151.72 | 769 | 772 | 179.1 |
| D | 8 | 195 | 1160009 | 5794.22 | 834 | 810 | 200.1 |
| D | 12 | 218 | 369358 | 1842.18 | 834 | 810 | 200.1 |
| D | 13 | 249 | 187010 | 930.72 | 834 | 810 | 200.1 |
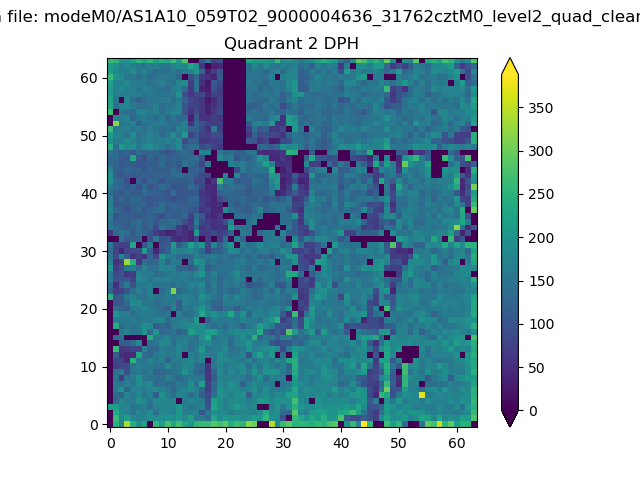
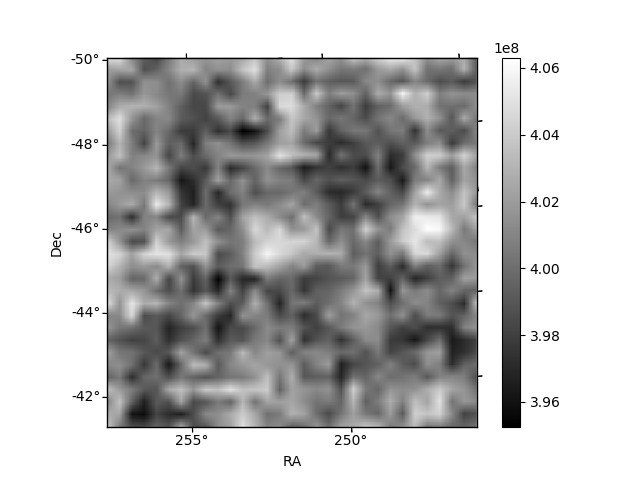
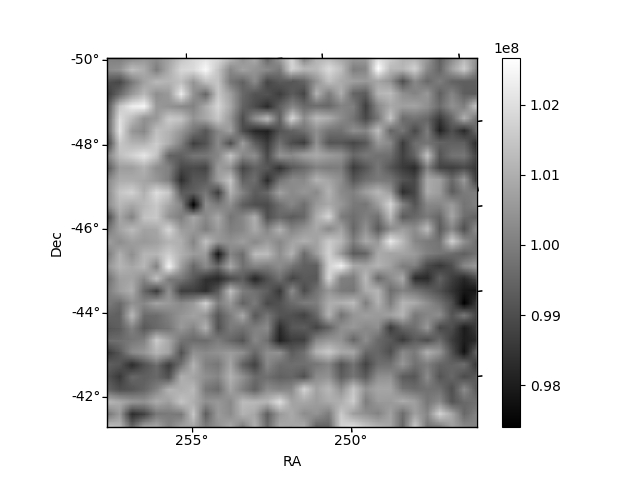
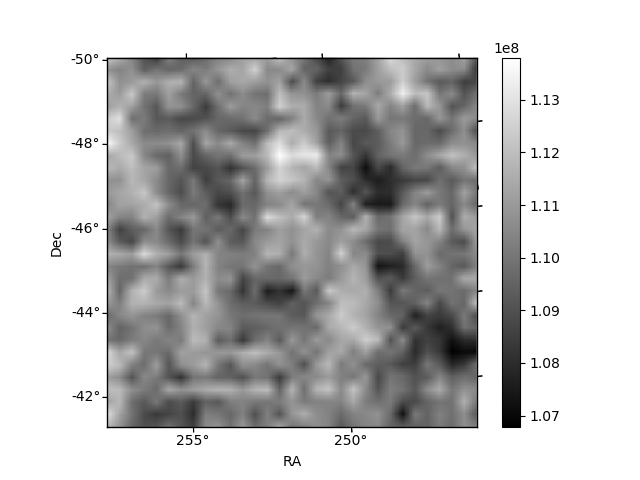
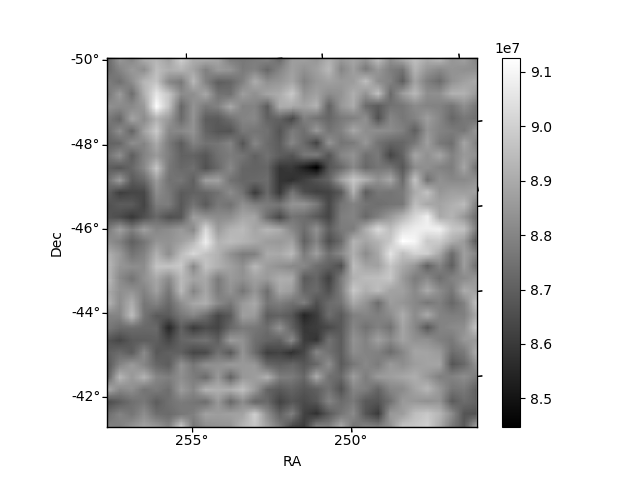
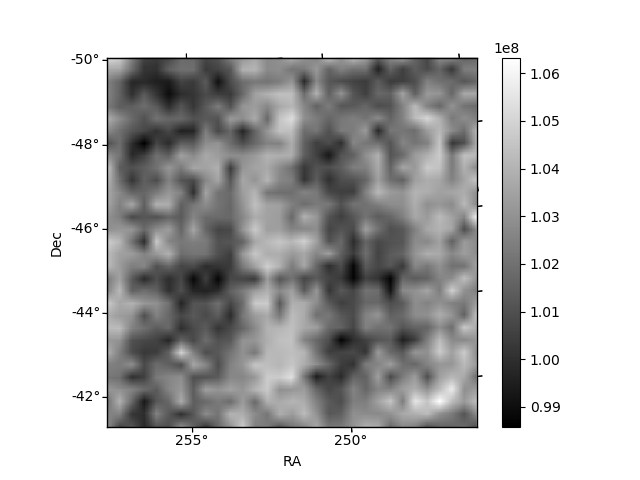
Histogram calculated using DETX and DETY for each event in the final _common_clean file
| Quadrant A | 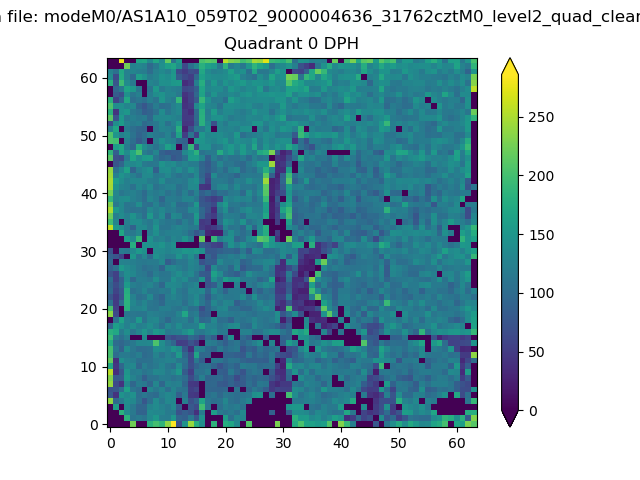 |
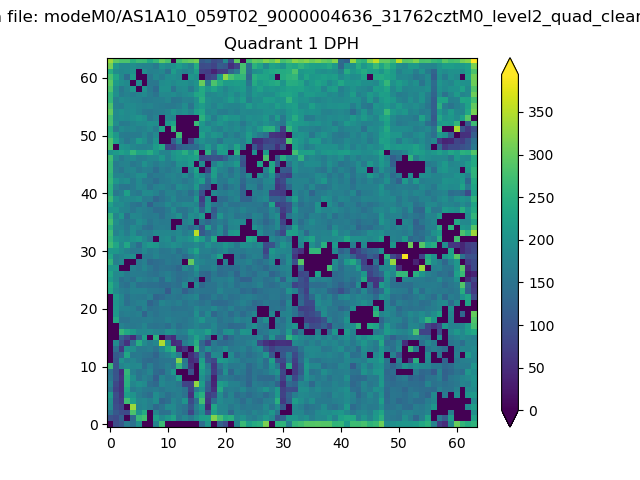 |
Quadrant B |
|---|---|---|---|
| Quadrant D | 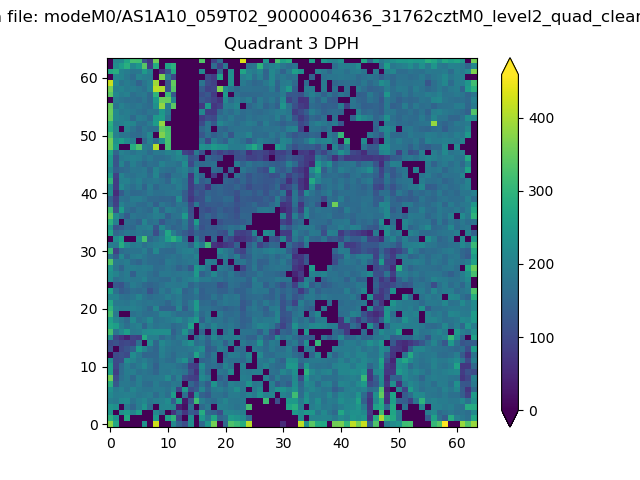 |
 |
Quadrant C |
| Plot type | Count rate plots | Images |
|---|---|---|
| Comparison with Poisson distribution Blue bars denote a histogram of data divided into 1 sec bins. Red curve is a Poisson curve with rate = median count rate of data. |
 |
 |
| Quadrant-wise count rates Data is divided into 100 sec bins |
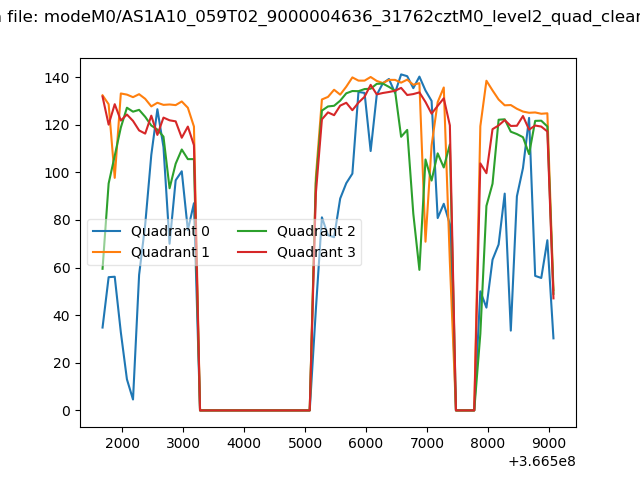 |
|
| Module-wise count rates for Quadrant A Data is divided into 100 sec bins |
 |
 |
| Module-wise count rates for Quadrant B Data is divided into 100 sec bins |
 |
 |
| Module-wise count rates for Quadrant C Data is divided into 100 sec bins |
 |
 |
| Module-wise count rates for Quadrant D Data is divided into 100 sec bins |
 |
 |
| Parameter | Plot |
|---|---|
| CZT HV Monitor | 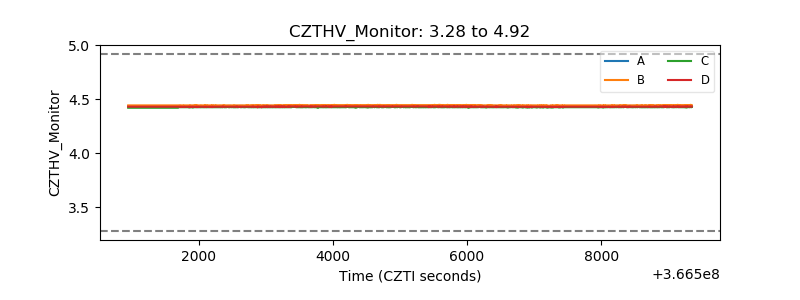 |
| D_VDD | 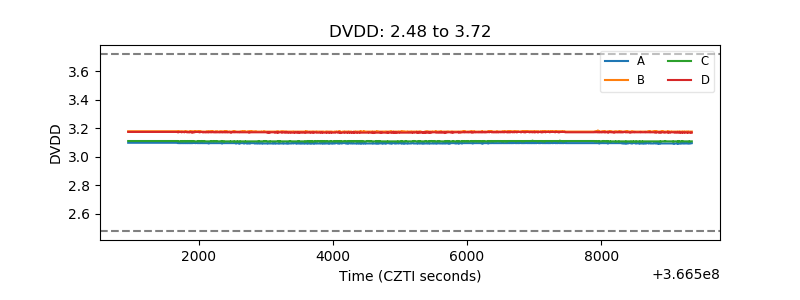 |
| Temperature 1 | 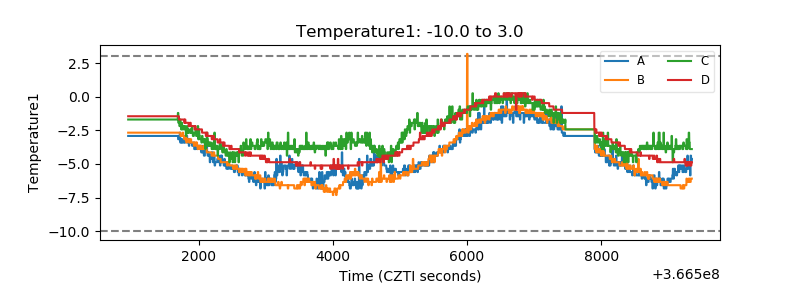 |
| Veto HV Monitor | 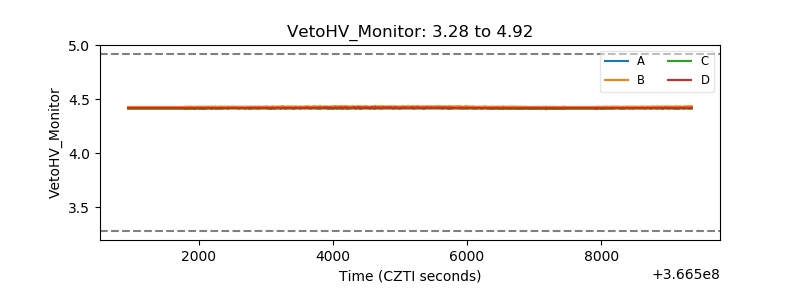 |
| Veto LLD |  |
| Alpha Counter |  |
| _CPM_Rate | 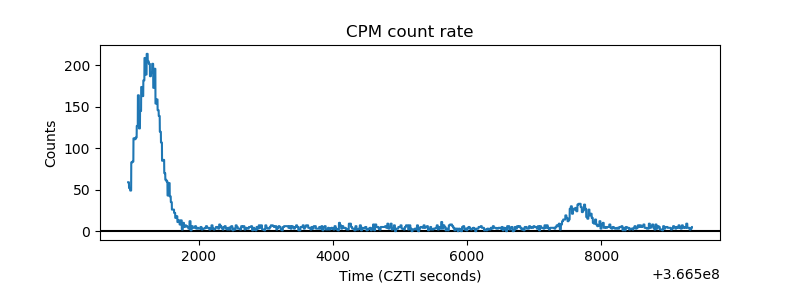 |
| CZT Counter | 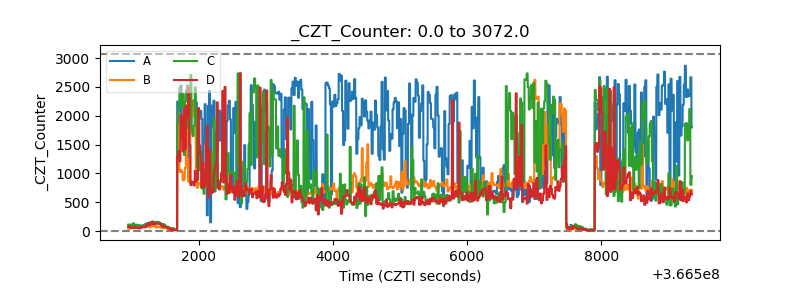 |
| +2.5 Volts monitor |  |
| +5 Volts monitor |  |
| _ROLL_ROT |  |
| _Roll_DEC | 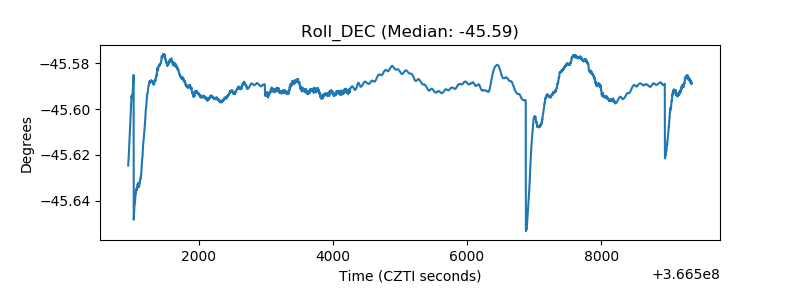 |
| _Roll_RA | 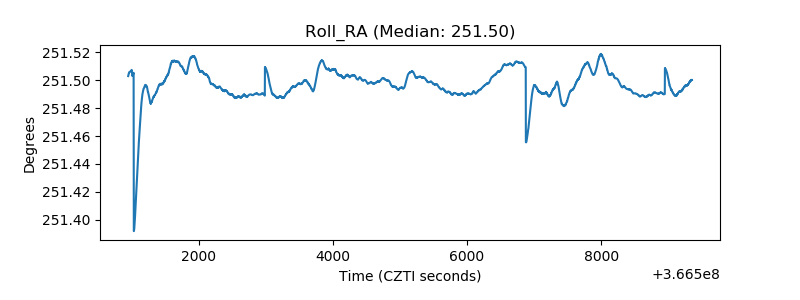 |
| Veto Counter |  |