| Param | Original file | Final file |
|---|---|---|
| Filename | modeM0/AS1A10_059T02_9000004636_31764cztM0_level2.evt | modeM0/AS1A10_059T02_9000004636_31764cztM0_level2_quad_clean.evt |
| Size (bytes) | 670,559,040 | 64,670,400 |
| Size | 639.5 MB | 61.7 MB |
| Events in quadrant A | 8,524,410 | 296,623 |
| Events in quadrant B | 4,146,902 | 450,647 |
| Events in quadrant C | 3,256,121 | 438,537 |
| Events in quadrant D | 4,026,223 | 404,189 |
| Mode M9 | |||
|---|---|---|---|
| Quadrant | BADHDUFLAG | Total packets | Discarded packets |
| A | 0 | 3 | 0 |
| B | 0 | 3 | 0 |
| C | 0 | 3 | 0 |
| D | 0 | 3 | 0 |
| Mode SS | |||
|---|---|---|---|
| Quadrant | BADHDUFLAG | Total packets | Discarded packets |
| A | 0 | 126 | 18 |
| B | 0 | 129 | 23 |
| C | 0 | 125 | 19 |
| D | 0 | 129 | 25 |
| Mode M0 | |||
|---|---|---|---|
| Quadrant | BADHDUFLAG | Total packets | Discarded packets |
| A | 0 | 35284 | 6360 |
| B | 0 | 19811 | 3451 |
| C | 0 | 16180 | 3067 |
| D | 0 | 18116 | 2689 |
| Quadrant | Total seconds | Saturated seconds | Saturation percentage |
|---|---|---|---|
| A | 5177 | 2976 | 57.485030% |
| B | 5225 | 209 | 4.000000% |
| C | 5281 | 239 | 4.525658% |
| D | 5270 | 516 | 9.791271% |
Noise dominated data is calculated using 1-second bins in cleaned event files. If a bin has >2000 counts, and if more than 50% of those come from <1% of pixels, then it is considered to be noise-dominated and hence unusable.
| Quadrant | # 1 sec bins | Bins with >0 counts | Bins with >2000 counts | High rate bins dominated by noise | Noise dominated (total time) | Noise dominated (detector-on time) | Marked lightcurve |
|---|---|---|---|---|---|---|---|
| A | 6325 | 5207 | 1711 | 1711 | 27.05% | 32.86% | 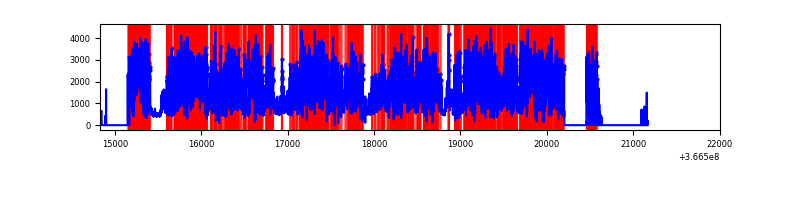 |
| B | 6315 | 5278 | 38 | 38 | 0.60% | 0.72% | 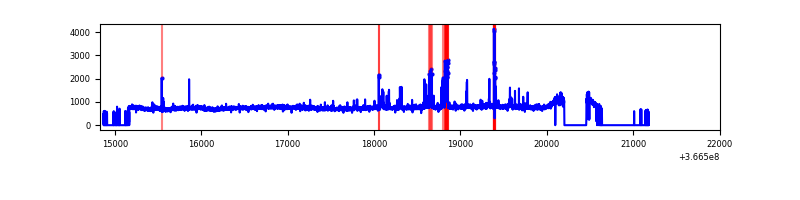 |
| C | 7120 | 5369 | 44 | 44 | 0.62% | 0.82% | 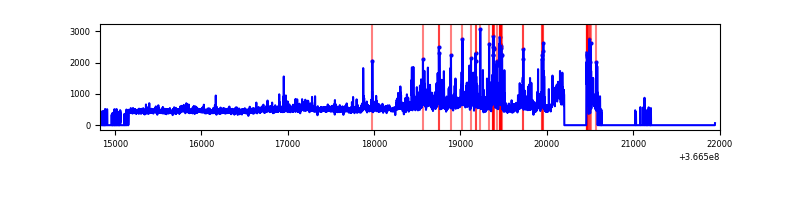 |
| D | 7147 | 5349 | 340 | 340 | 4.76% | 6.36% | 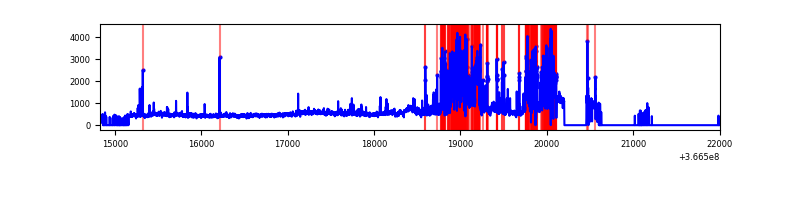 |
Top three noisy pixels from each quadrant. If the there are fewer than three noisy pixels in the level2.evt file, extra rows are filled as -1
| Pixel properties | Quadrant properties | ||||||
|---|---|---|---|---|---|---|---|
| Quadrant | DetID | PixID | Counts | Sigma | Mean | Median | Sigma |
| A | 0 | 13 | 6810692 | 74593.6 | 442 | 433 | 91.3 |
| A | 13 | 254 | 7005 | 71.98 | 442 | 433 | 91.3 |
| A | 14 | 238 | 6563 | 67.14 | 442 | 433 | 91.3 |
| B | 6 | 159 | 1447898 | 11705.41 | 627 | 609 | 123.6 |
| B | 5 | 172 | 148338 | 1194.8 | 627 | 609 | 123.6 |
| B | 0 | 229 | 37421 | 297.72 | 627 | 609 | 123.6 |
| C | 0 | 10 | 449141 | 3087.19 | 611 | 614 | 145.3 |
| C | 3 | 233 | 284855 | 1956.42 | 611 | 614 | 145.3 |
| C | 14 | 238 | 97961 | 670.03 | 611 | 614 | 145.3 |
| D | 13 | 249 | 949291 | 6583.1 | 596 | 578 | 144.1 |
| D | 8 | 195 | 402642 | 2789.91 | 596 | 578 | 144.1 |
| D | 12 | 218 | 232818 | 1611.51 | 596 | 578 | 144.1 |
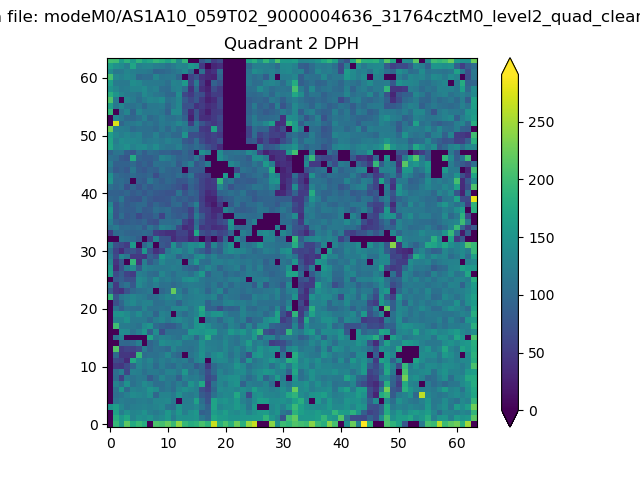
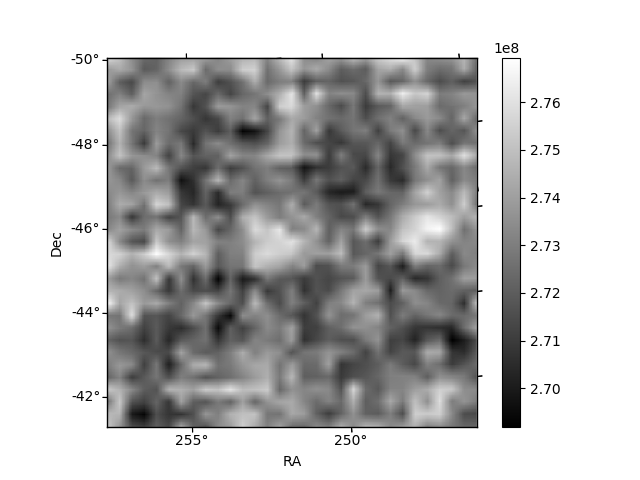
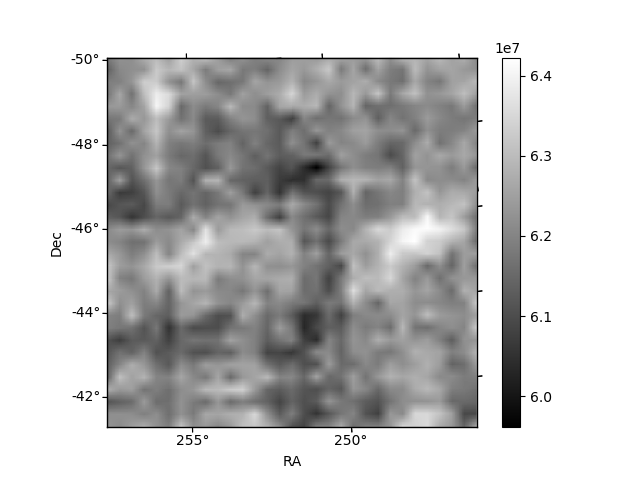
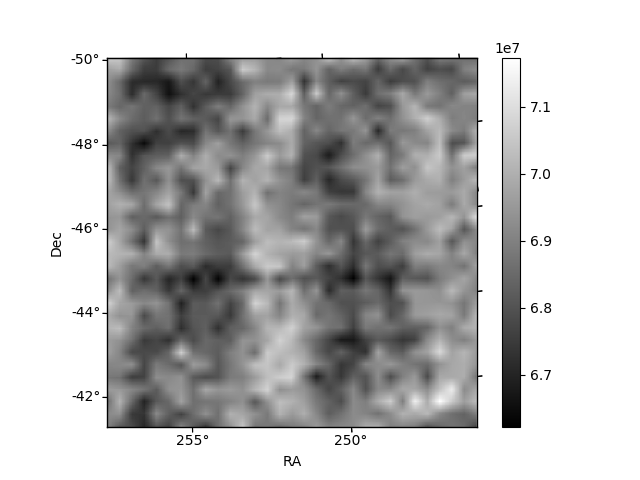
Histogram calculated using DETX and DETY for each event in the final _common_clean file
| Quadrant A | 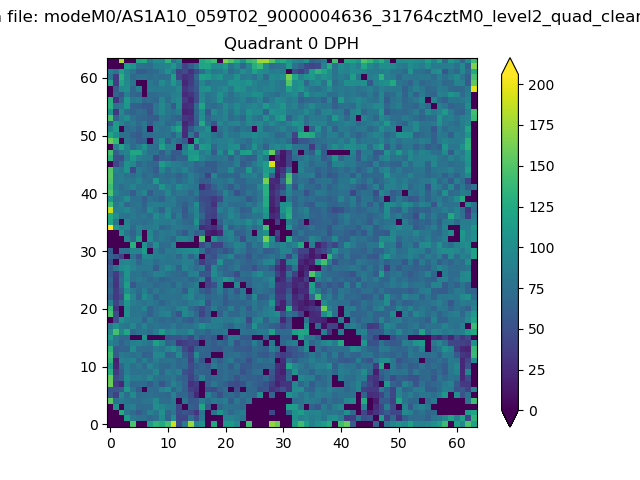 |
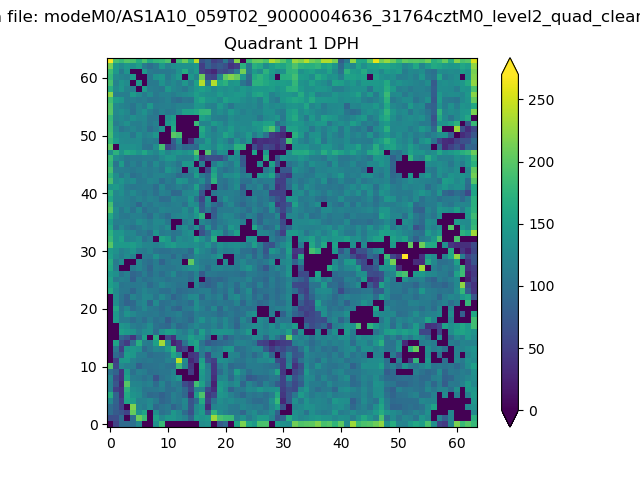 |
Quadrant B |
|---|---|---|---|
| Quadrant D | 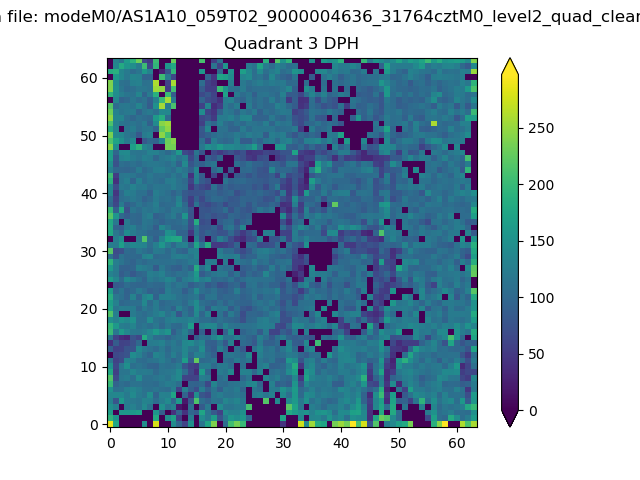 |
 |
Quadrant C |
| Plot type | Count rate plots | Images |
|---|---|---|
| Comparison with Poisson distribution Blue bars denote a histogram of data divided into 1 sec bins. Red curve is a Poisson curve with rate = median count rate of data. |
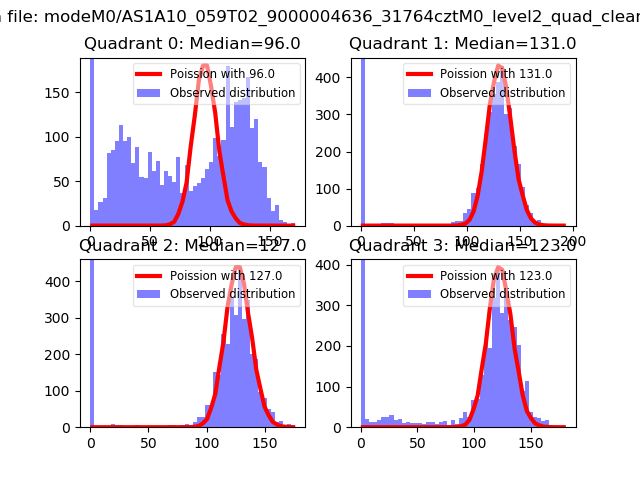 |
 |
| Quadrant-wise count rates Data is divided into 100 sec bins |
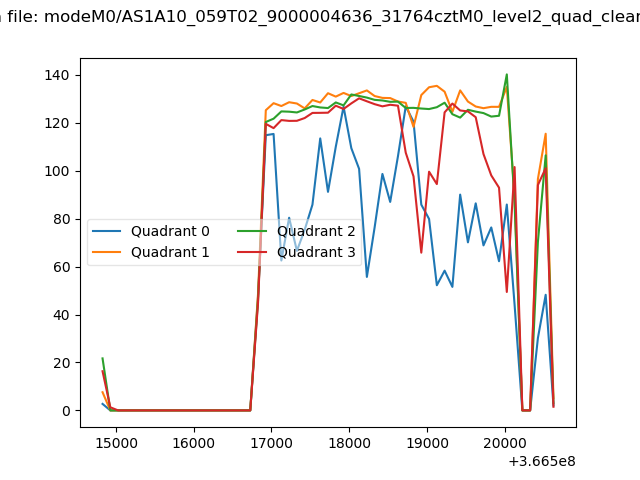 |
|
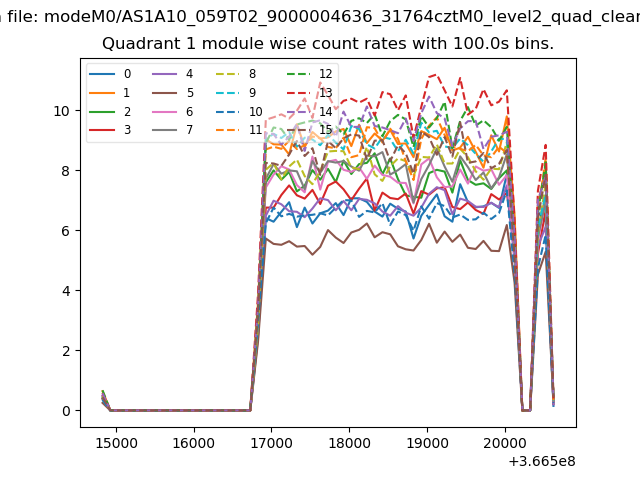
| Module-wise count rates for Quadrant A Data is divided into 100 sec bins |
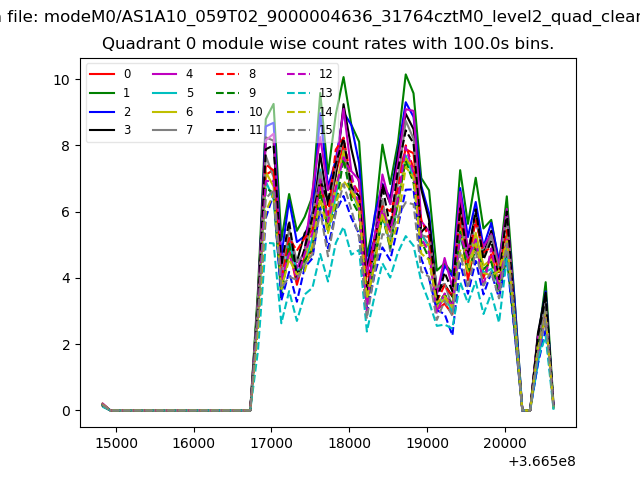 |
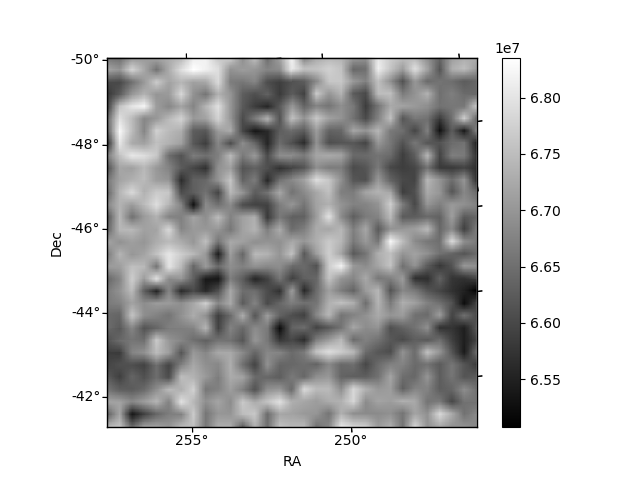 |
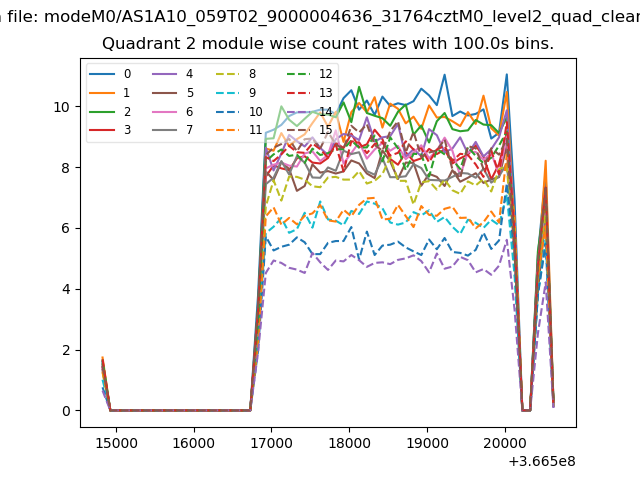
| Module-wise count rates for Quadrant B Data is divided into 100 sec bins |
 |
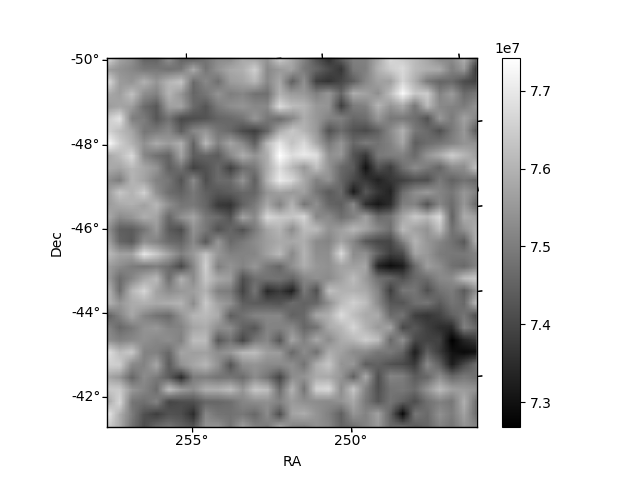 |
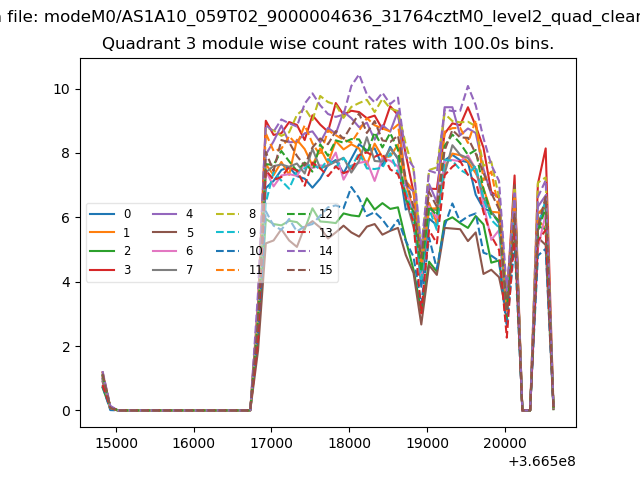
| Module-wise count rates for Quadrant C Data is divided into 100 sec bins |
 |
 |
| Module-wise count rates for Quadrant D Data is divided into 100 sec bins |
 |
 |
| Parameter | Plot |
|---|---|
| CZT HV Monitor | 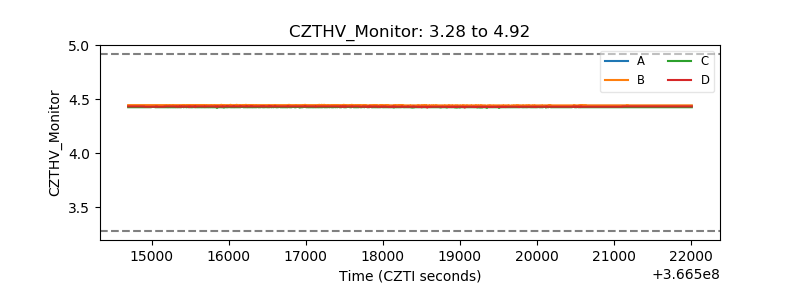 |
| D_VDD | 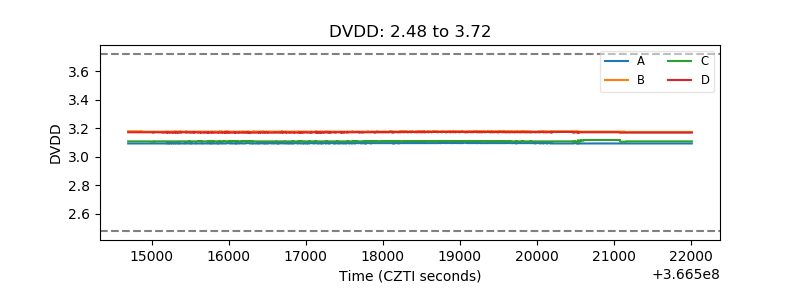 |
| Temperature 1 | 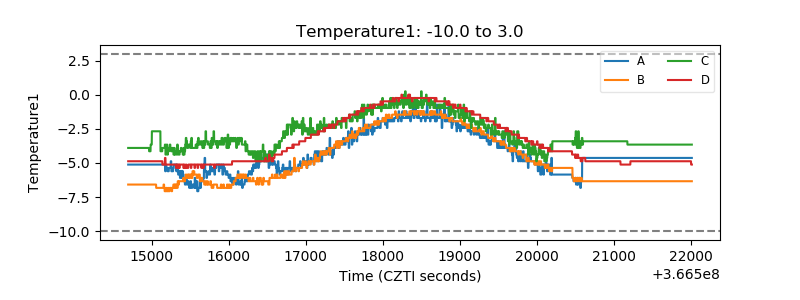 |
| Veto HV Monitor | 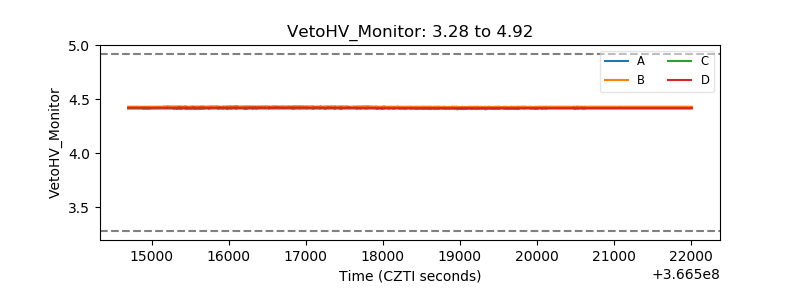 |
| Veto LLD | 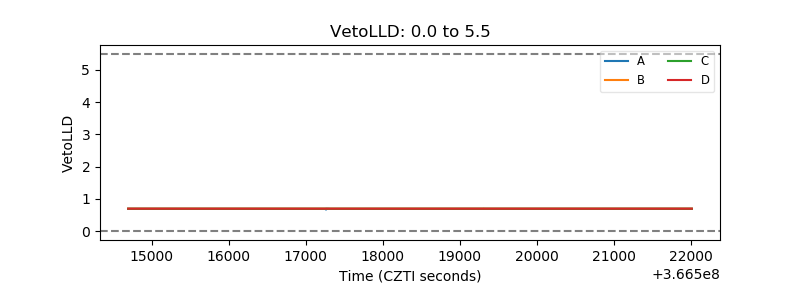 |
| Alpha Counter | 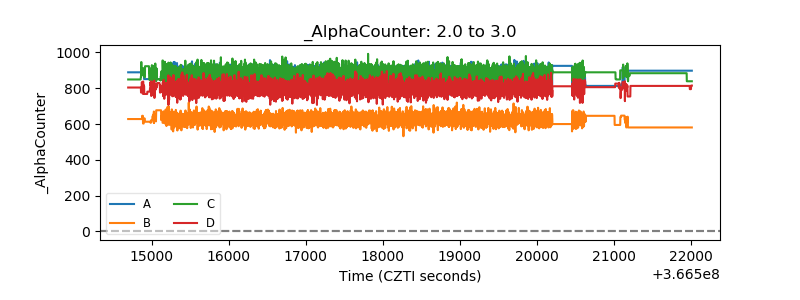 |
| _CPM_Rate | 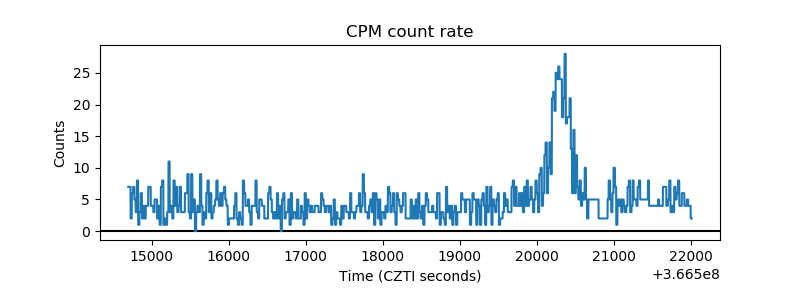 |
| CZT Counter | 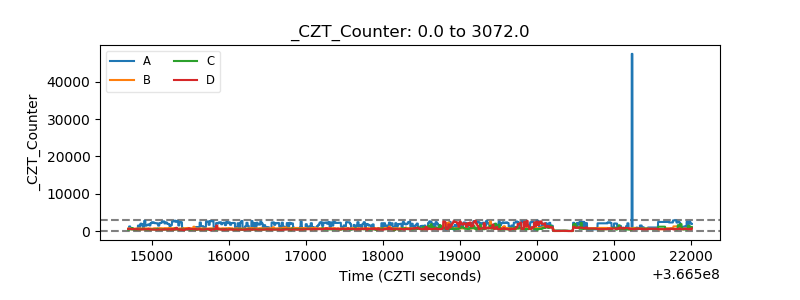 |
| +2.5 Volts monitor |  |
| +5 Volts monitor |  |
| _ROLL_ROT | 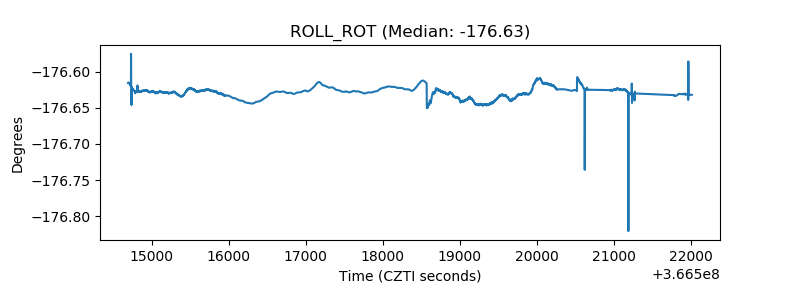 |
| _Roll_DEC | 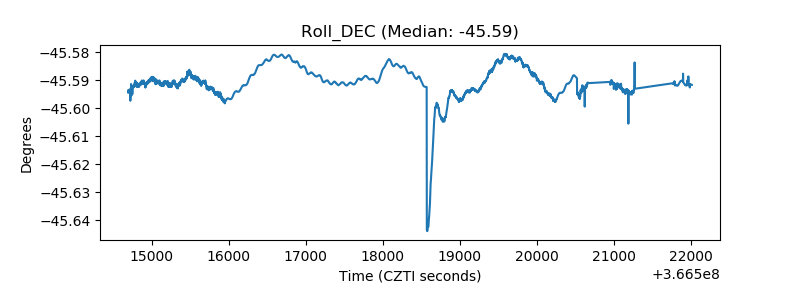 |
| _Roll_RA | 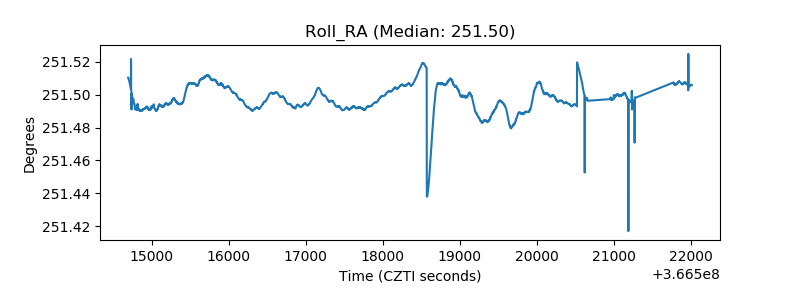 |
| Veto Counter | 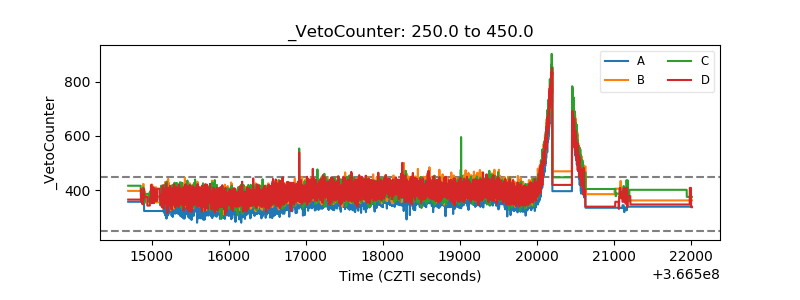 |