| Param | Original file | Final file |
|---|---|---|
| Filename | modeM0/AS1A10_059T02_9000004636_31767cztM0_level2.evt | modeM0/AS1A10_059T02_9000004636_31767cztM0_level2_quad_clean.evt |
| Size (bytes) | 341,087,040 | 47,871,360 |
| Size | 325.3 MB | 45.7 MB |
| Events in quadrant A | 1,978,028 | 295,833 |
| Events in quadrant B | 3,106,745 | 295,576 |
| Events in quadrant C | 2,685,383 | 286,984 |
| Events in quadrant D | 2,280,947 | 282,228 |
| Mode M9 | |||
|---|---|---|---|
| Quadrant | BADHDUFLAG | Total packets | Discarded packets |
| A | 0 | 8 | 0 |
| B | 0 | 8 | 0 |
| C | 0 | 9 | 1 |
| D | 0 | 8 | 0 |
| Mode SS | |||
|---|---|---|---|
| Quadrant | BADHDUFLAG | Total packets | Discarded packets |
| A | 0 | 90 | 2 |
| B | 0 | 90 | 4 |
| C | 0 | 90 | 2 |
| D | 0 | 91 | 3 |
| Mode M0 | |||
|---|---|---|---|
| Quadrant | BADHDUFLAG | Total packets | Discarded packets |
| A | 0 | 8734 | 407 |
| B | 0 | 12918 | 657 |
| C | 0 | 11095 | 423 |
| D | 0 | 9588 | 462 |
| Quadrant | Total seconds | Saturated seconds | Saturation percentage |
|---|---|---|---|
| A | 4082 | 27 | 0.661440% |
| B | 4071 | 64 | 1.572095% |
| C | 4092 | 205 | 5.009775% |
| D | 4083 | 22 | 0.538819% |
Noise dominated data is calculated using 1-second bins in cleaned event files. If a bin has >2000 counts, and if more than 50% of those come from <1% of pixels, then it is considered to be noise-dominated and hence unusable.
| Quadrant | # 1 sec bins | Bins with >0 counts | Bins with >2000 counts | High rate bins dominated by noise | Noise dominated (total time) | Noise dominated (detector-on time) | Marked lightcurve |
|---|---|---|---|---|---|---|---|
| A | 7281 | 4123 | 0 | 0 | 0.00% | 0.00% | 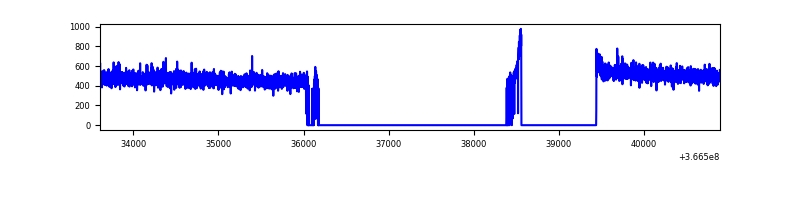 |
| B | 7281 | 4104 | 0 | 0 | 0.00% | 0.00% | 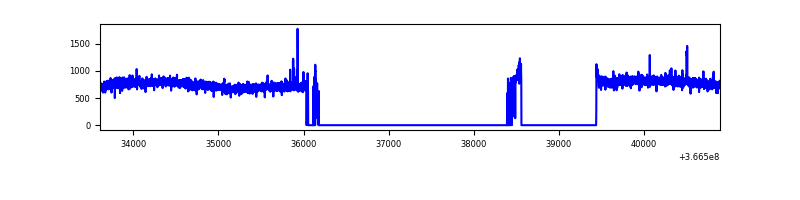 |
| C | 7281 | 4125 | 55 | 55 | 0.76% | 1.33% | 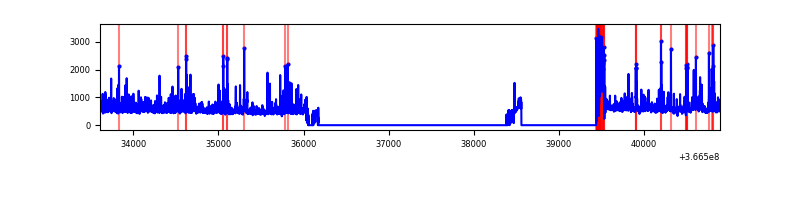 |
| D | 7281 | 4117 | 6 | 6 | 0.08% | 0.15% | 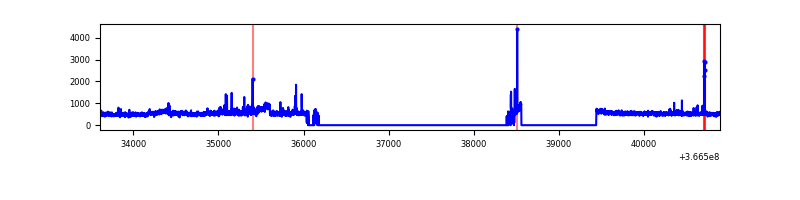 |
Top three noisy pixels from each quadrant. If the there are fewer than three noisy pixels in the level2.evt file, extra rows are filled as -1
| Pixel properties | Quadrant properties | ||||||
|---|---|---|---|---|---|---|---|
| Quadrant | DetID | PixID | Counts | Sigma | Mean | Median | Sigma |
| A | 13 | 254 | 7477 | 68.21 | 512 | 501 | 102.3 |
| A | 3 | 137 | 5228 | 46.22 | 512 | 501 | 102.3 |
| A | 0 | 226 | 4213 | 36.29 | 512 | 501 | 102.3 |
| B | 6 | 159 | 1100921 | 11402.51 | 502 | 490 | 96.5 |
| B | 12 | 111 | 12043 | 119.71 | 502 | 490 | 96.5 |
| B | 11 | 111 | 11167 | 110.63 | 502 | 490 | 96.5 |
| C | 0 | 10 | 589093 | 5058.41 | 490 | 492 | 116.4 |
| C | 14 | 238 | 78208 | 667.89 | 490 | 492 | 116.4 |
| C | 3 | 233 | 77522 | 661.99 | 490 | 492 | 116.4 |
| D | 8 | 195 | 312317 | 2593.28 | 500 | 486 | 120.2 |
| D | 12 | 218 | 31545 | 258.3 | 500 | 486 | 120.2 |
| D | 2 | 250 | 18525 | 150.02 | 500 | 486 | 120.2 |
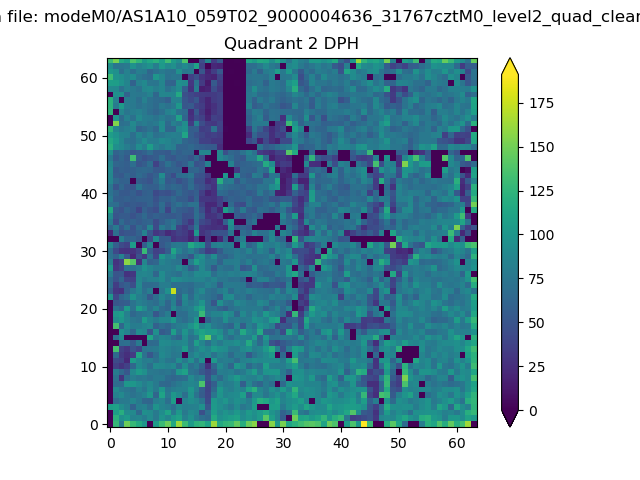
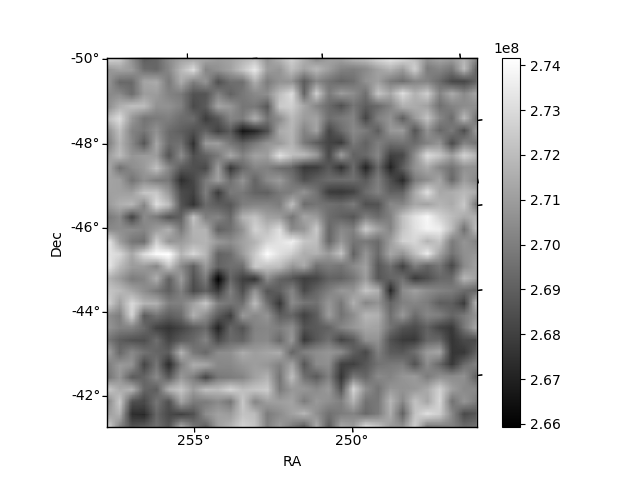
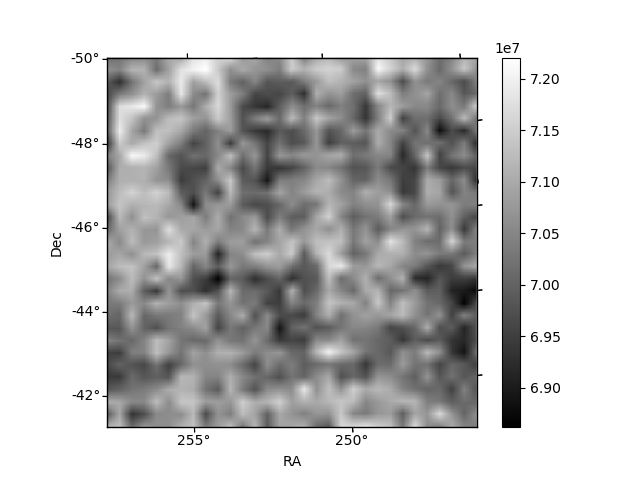
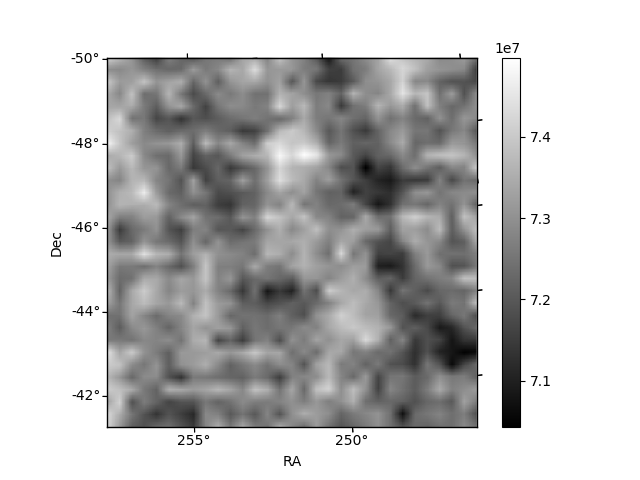
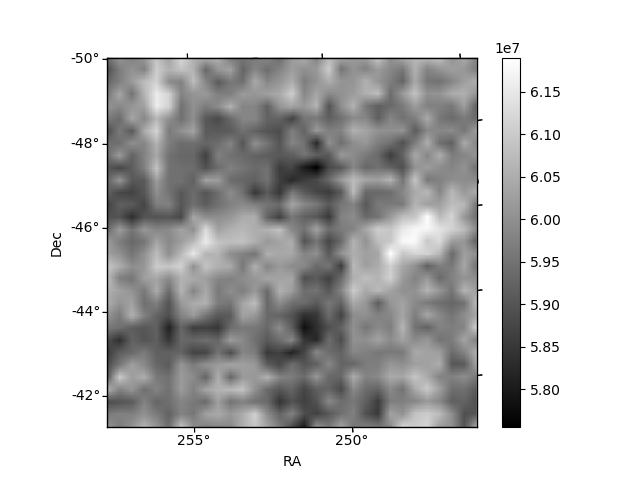
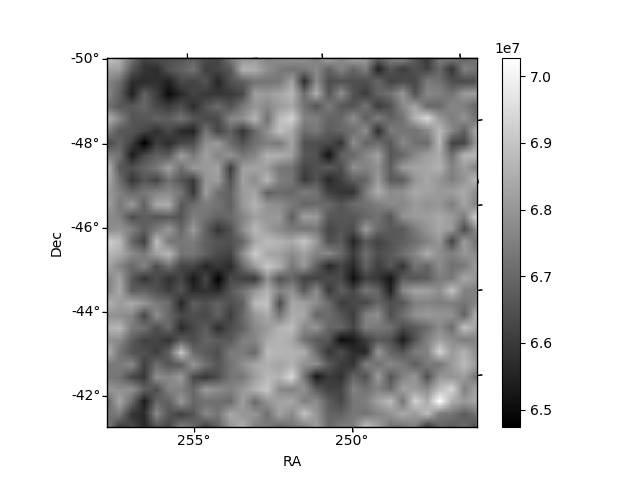
Histogram calculated using DETX and DETY for each event in the final _common_clean file
| Quadrant A | 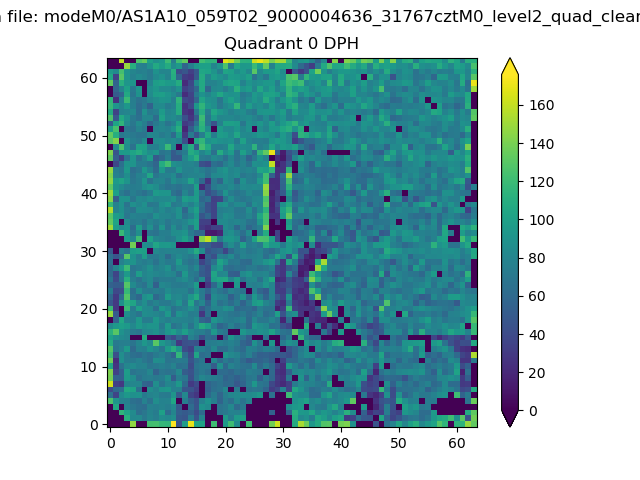 |
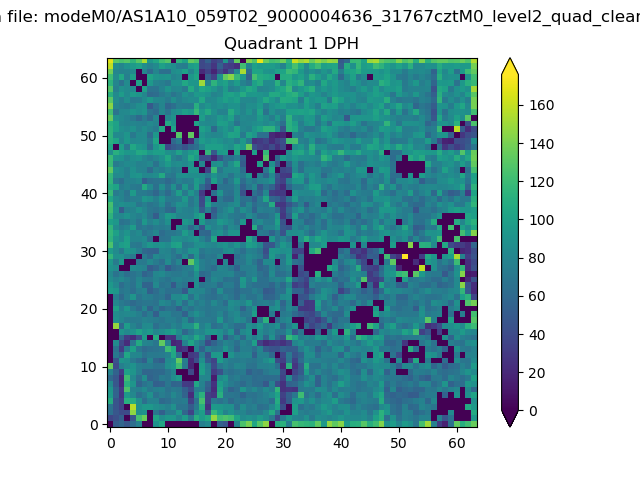 |
Quadrant B |
|---|---|---|---|
| Quadrant D | 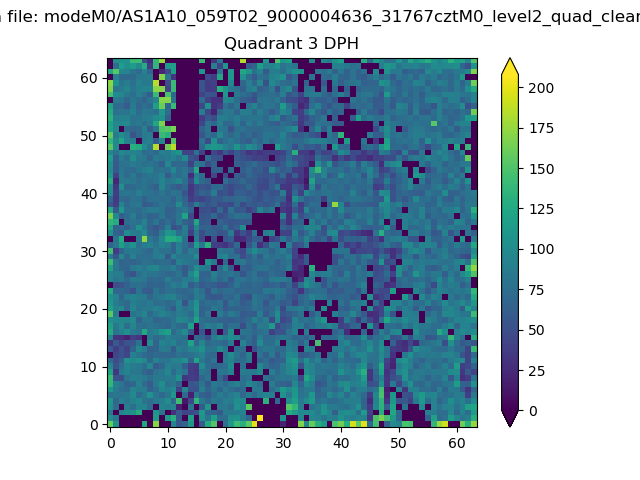 |
 |
Quadrant C |
| Plot type | Count rate plots | Images |
|---|---|---|
| Comparison with Poisson distribution Blue bars denote a histogram of data divided into 1 sec bins. Red curve is a Poisson curve with rate = median count rate of data. |
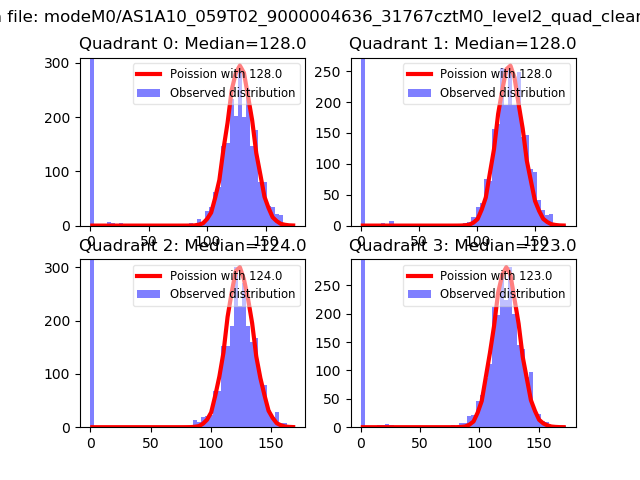 |
 |
| Quadrant-wise count rates Data is divided into 100 sec bins |
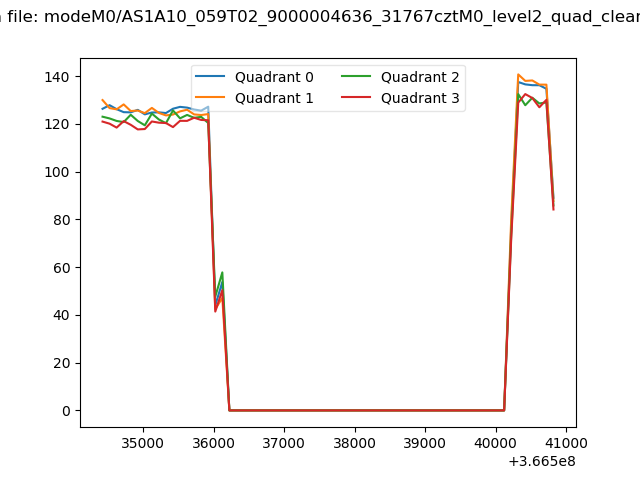 |
|
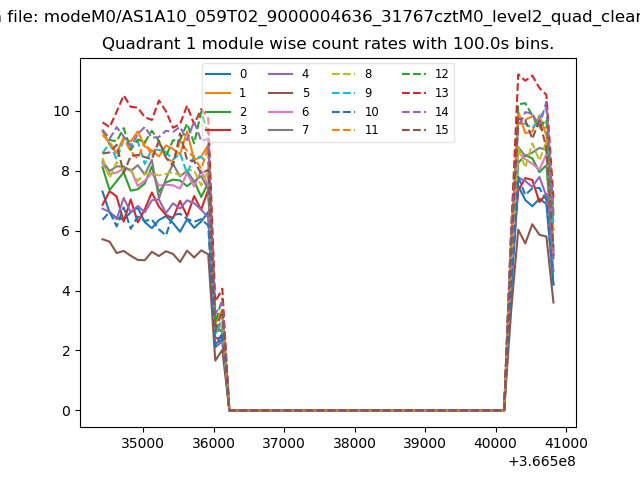
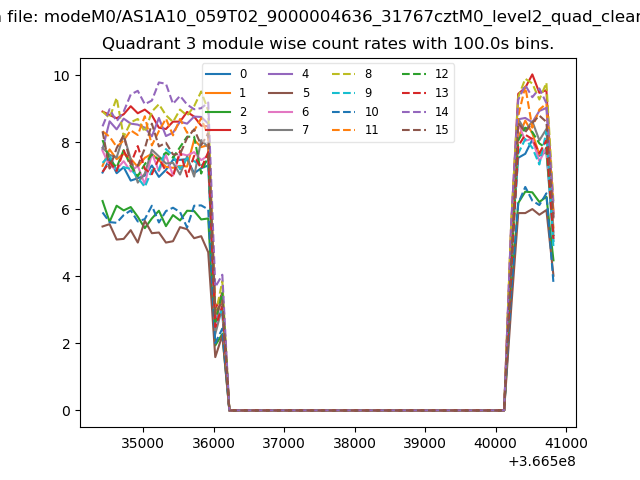
| Module-wise count rates for Quadrant A Data is divided into 100 sec bins |
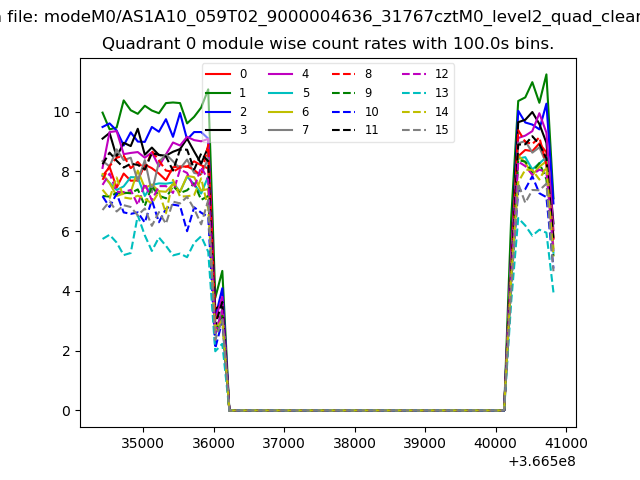 |
 |
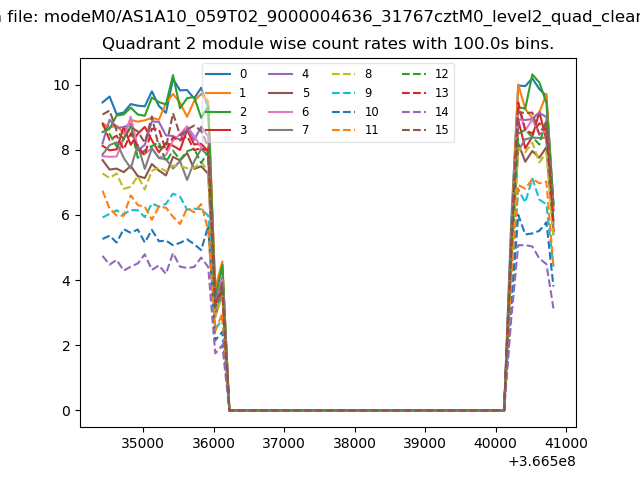
| Module-wise count rates for Quadrant B Data is divided into 100 sec bins |
 |
 |
| Module-wise count rates for Quadrant C Data is divided into 100 sec bins |
 |
 |
| Module-wise count rates for Quadrant D Data is divided into 100 sec bins |
 |
 |
| Parameter | Plot |
|---|---|
| CZT HV Monitor | 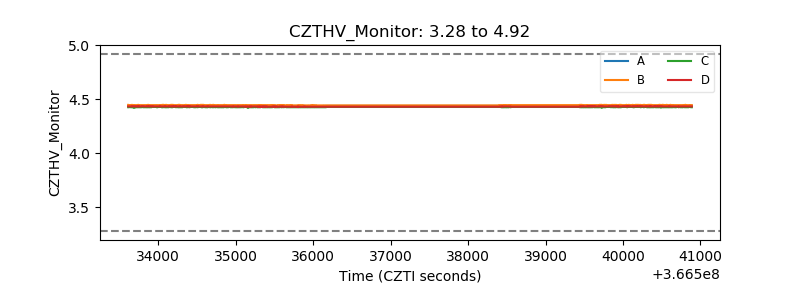 |
| D_VDD | 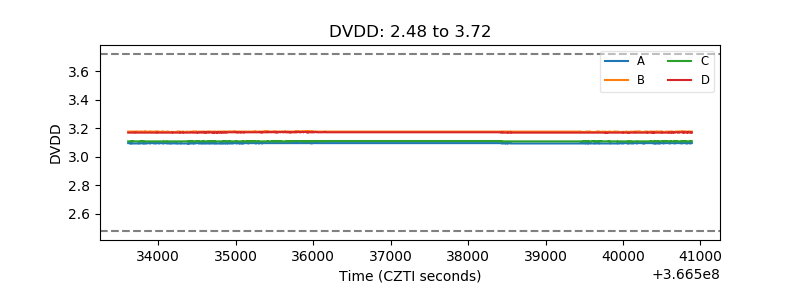 |
| Temperature 1 | 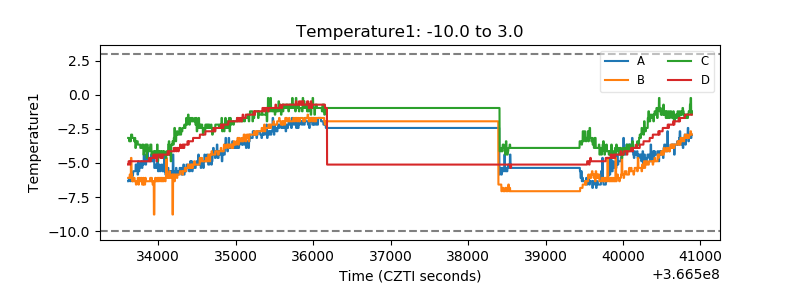 |
| Veto HV Monitor | 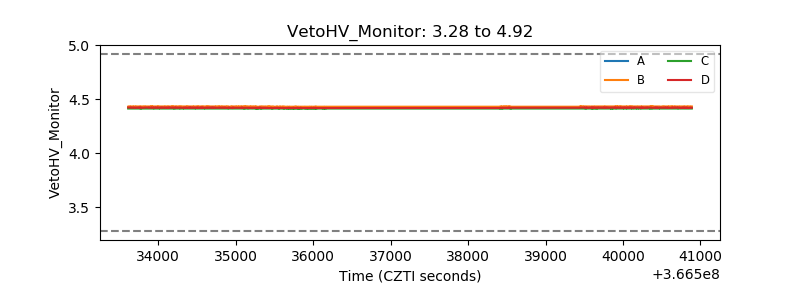 |
| Veto LLD |  |
| Alpha Counter | 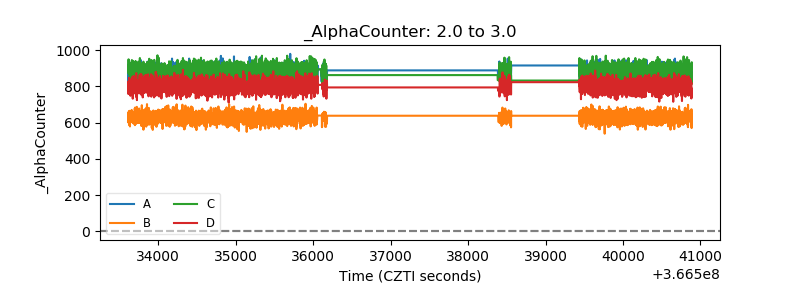 |
| _CPM_Rate | 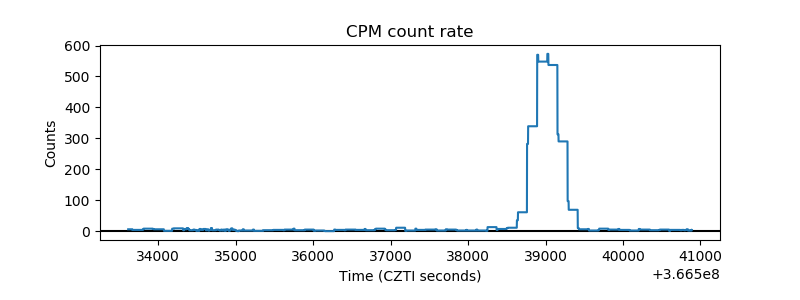 |
| CZT Counter | 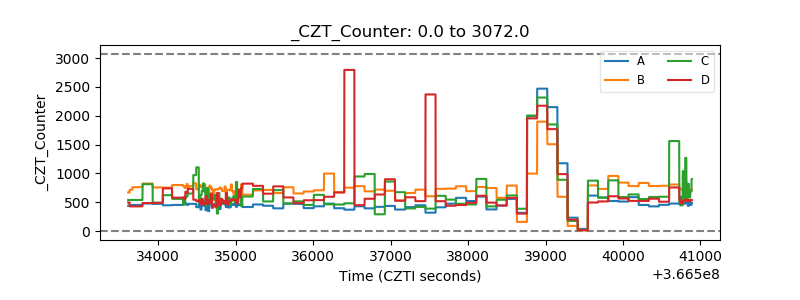 |
| +2.5 Volts monitor | 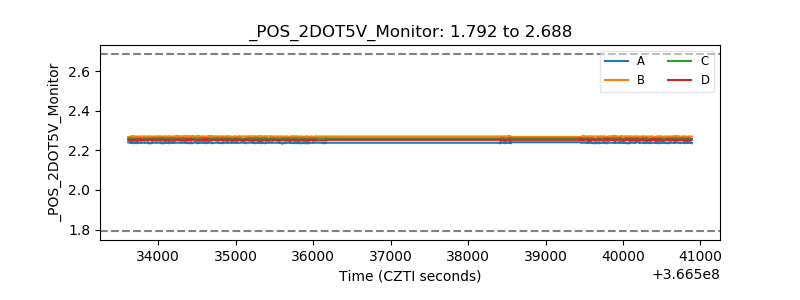 |
| +5 Volts monitor |  |
| _ROLL_ROT | 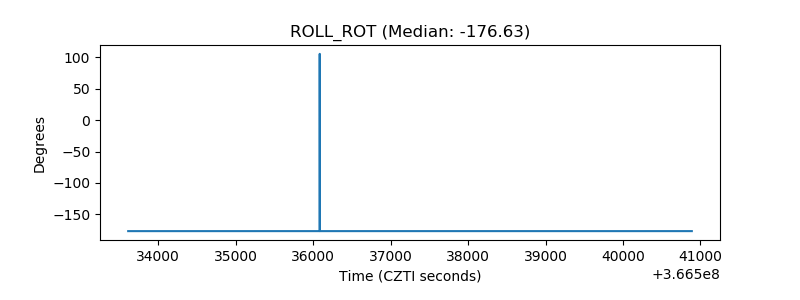 |
| _Roll_DEC | 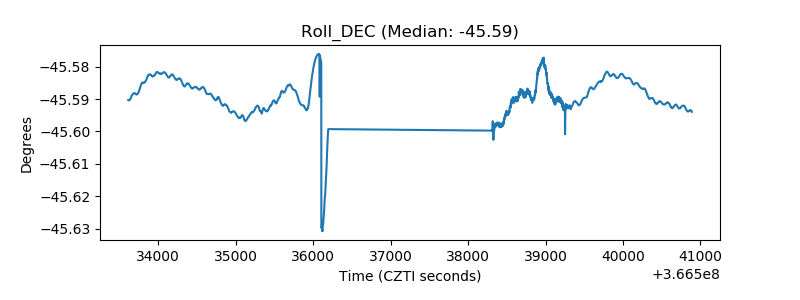 |
| _Roll_RA | 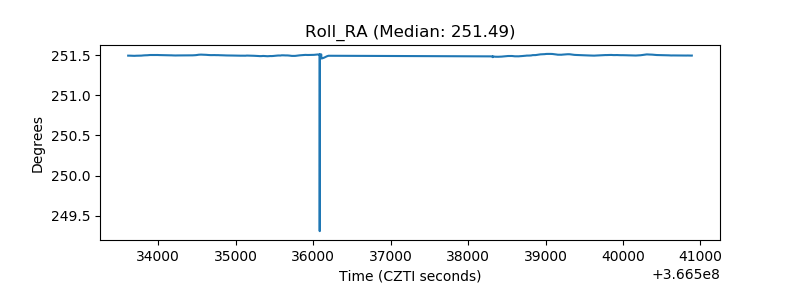 |
| Veto Counter | 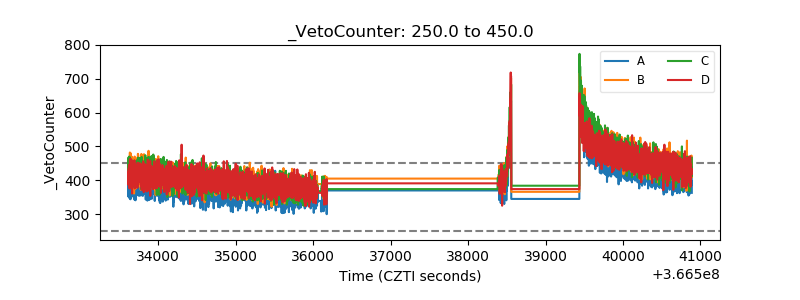 |