| Param | Original file | Final file |
|---|---|---|
| Filename | modeM0/AS1A10_059T02_9000004636_31768cztM0_level2.evt | modeM0/AS1A10_059T02_9000004636_31768cztM0_level2_quad_clean.evt |
| Size (bytes) | 2,568,792,960 | 331,064,640 |
| Size | 2.4 GB | 315.7 MB |
| Events in quadrant A | 22,014,866 | 1,989,232 |
| Events in quadrant B | 19,570,236 | 2,175,869 |
| Events in quadrant C | 18,142,357 | 2,096,416 |
| Events in quadrant D | 16,386,625 | 2,041,993 |
| Mode M9 | |||
|---|---|---|---|
| Quadrant | BADHDUFLAG | Total packets | Discarded packets |
| A | 0 | 23 | 0 |
| B | 0 | 23 | 0 |
| C | 0 | 23 | 0 |
| D | 0 | 23 | 0 |
| Mode SS | |||
|---|---|---|---|
| Quadrant | BADHDUFLAG | Total packets | Discarded packets |
| A | 0 | 508 | 0 |
| B | 0 | 508 | 0 |
| C | 0 | 508 | 0 |
| D | 0 | 508 | 0 |
| Mode M0 | |||
|---|---|---|---|
| Quadrant | BADHDUFLAG | Total packets | Discarded packets |
| A | 0 | 81944 | 4 |
| B | 0 | 77624 | 4 |
| C | 0 | 70522 | 4 |
| D | 0 | 64615 | 4 |
| Quadrant | Total seconds | Saturated seconds | Saturation percentage |
|---|---|---|---|
| A | 25032 | 4896 | 19.558965% |
| B | 25033 | 638 | 2.548636% |
| C | 25033 | 1741 | 6.954820% |
| D | 25033 | 896 | 3.579275% |
Noise dominated data is calculated using 1-second bins in cleaned event files. If a bin has >2000 counts, and if more than 50% of those come from <1% of pixels, then it is considered to be noise-dominated and hence unusable.
| Quadrant | # 1 sec bins | Bins with >0 counts | Bins with >2000 counts | High rate bins dominated by noise | Noise dominated (total time) | Noise dominated (detector-on time) | Marked lightcurve |
|---|---|---|---|---|---|---|---|
| A | 27327 | 25035 | 2876 | 2876 | 10.52% | 11.49% | 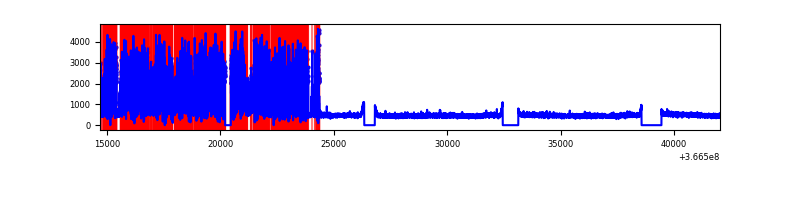 |
| B | 27328 | 25037 | 119 | 119 | 0.44% | 0.48% | 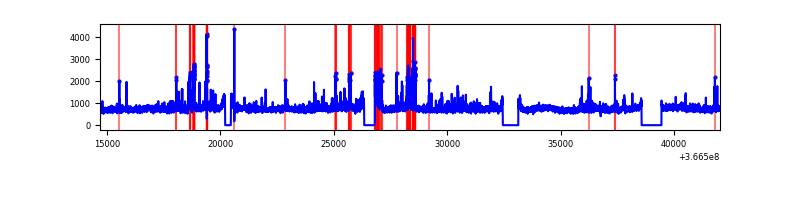 |
| C | 27328 | 25037 | 780 | 780 | 2.85% | 3.12% | 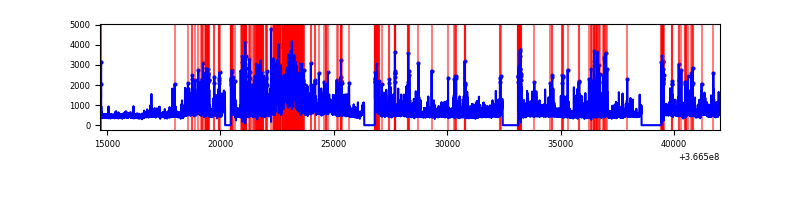 |
| D | 27328 | 25036 | 570 | 570 | 2.09% | 2.28% | 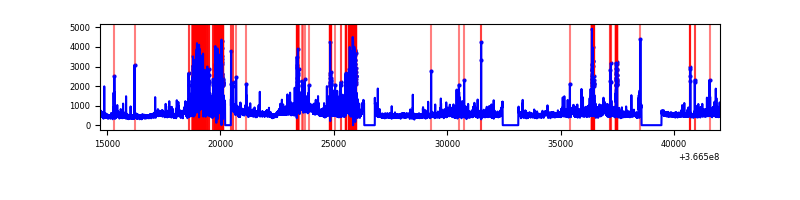 |
Top three noisy pixels from each quadrant. If the there are fewer than three noisy pixels in the level2.evt file, extra rows are filled as -1
| Pixel properties | Quadrant properties | ||||||
|---|---|---|---|---|---|---|---|
| Quadrant | DetID | PixID | Counts | Sigma | Mean | Median | Sigma |
| A | 0 | 13 | 11494452 | 21140.96 | 2720 | 2663 | 543.6 |
| A | 13 | 254 | 42746 | 73.74 | 2720 | 2663 | 543.6 |
| A | 3 | 137 | 27927 | 46.48 | 2720 | 2663 | 543.6 |
| B | 6 | 159 | 6790607 | 12075.21 | 2961 | 2884 | 562.1 |
| B | 10 | 245 | 551670 | 976.28 | 2961 | 2884 | 562.1 |
| B | 5 | 172 | 185179 | 324.3 | 2961 | 2884 | 562.1 |
| C | 0 | 10 | 3618679 | 5465.31 | 2829 | 2847 | 661.6 |
| C | 3 | 233 | 2788450 | 4210.42 | 2829 | 2847 | 661.6 |
| C | 14 | 238 | 451152 | 677.61 | 2829 | 2847 | 661.6 |
| D | 8 | 195 | 2590245 | 3788.19 | 2873 | 2799 | 683.0 |
| D | 13 | 249 | 1453009 | 2123.2 | 2873 | 2799 | 683.0 |
| D | 12 | 218 | 500687 | 728.94 | 2873 | 2799 | 683.0 |
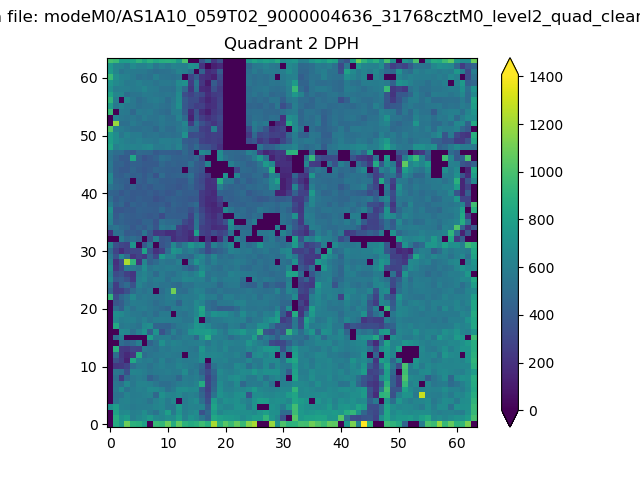
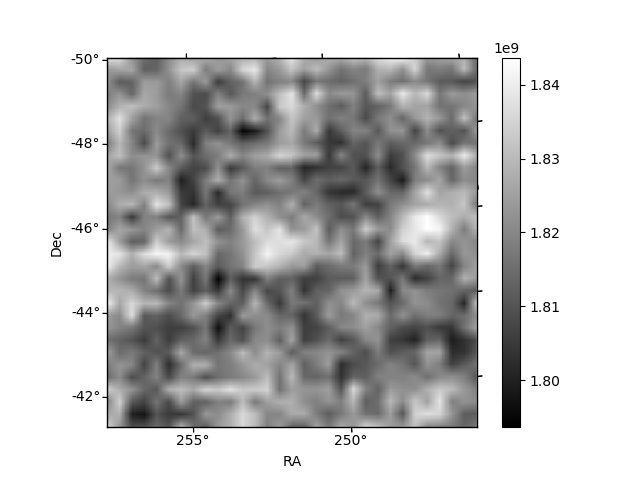
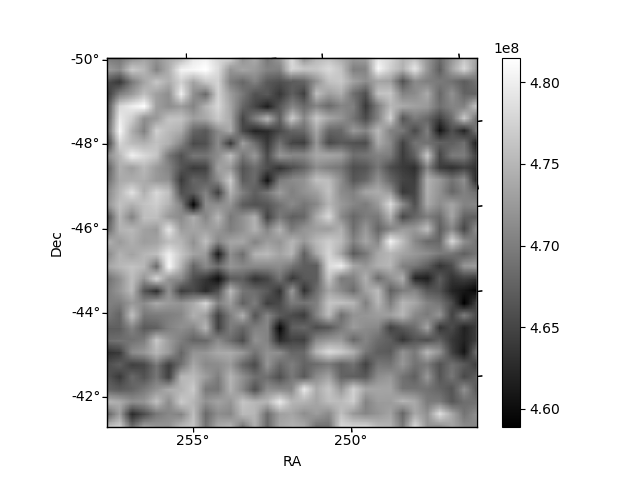
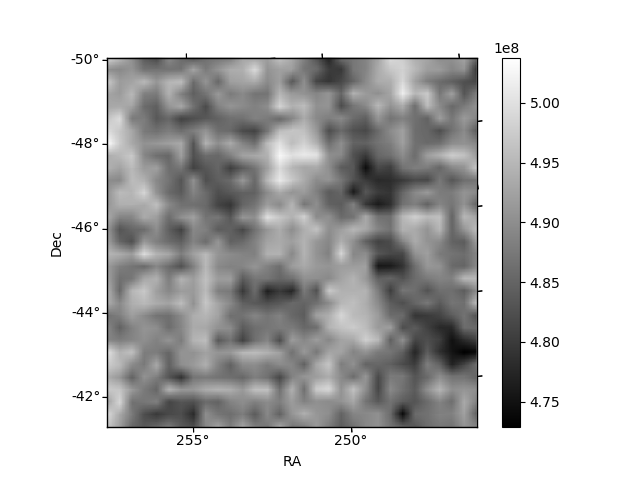
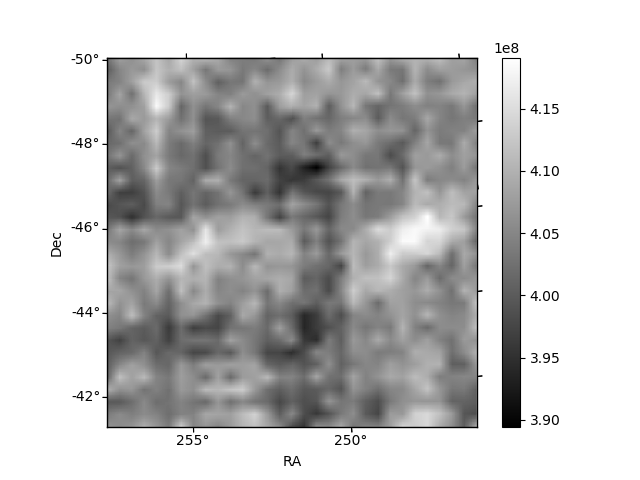
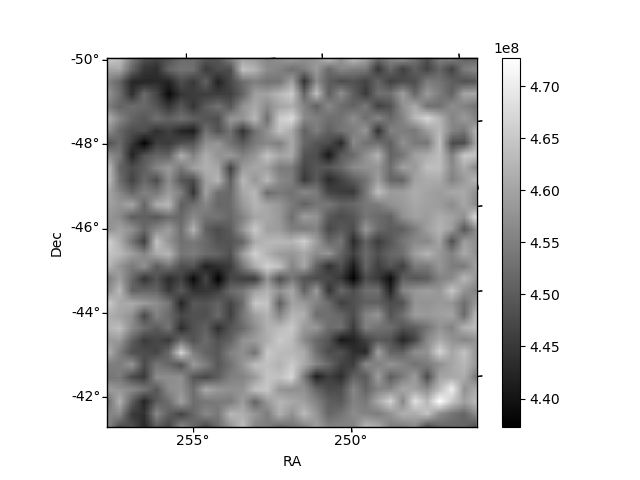
Histogram calculated using DETX and DETY for each event in the final _common_clean file
| Quadrant A | 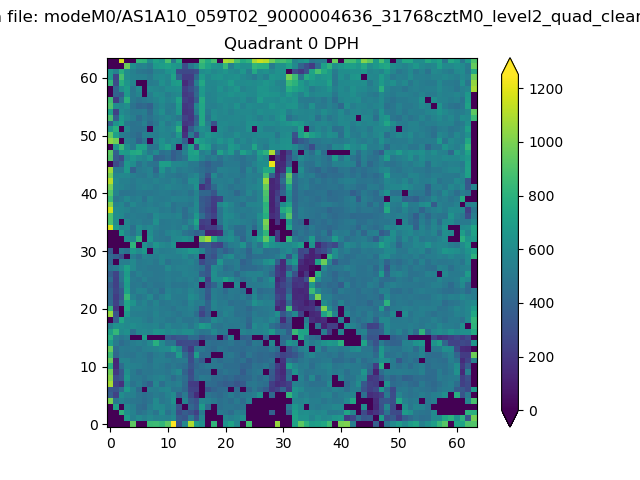 |
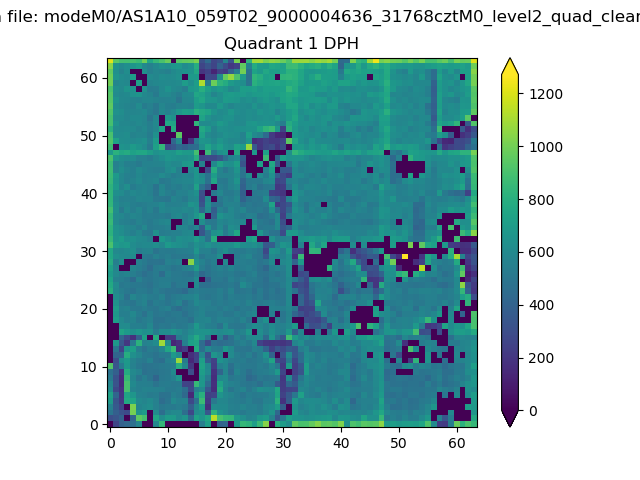 |
Quadrant B |
|---|---|---|---|
| Quadrant D | 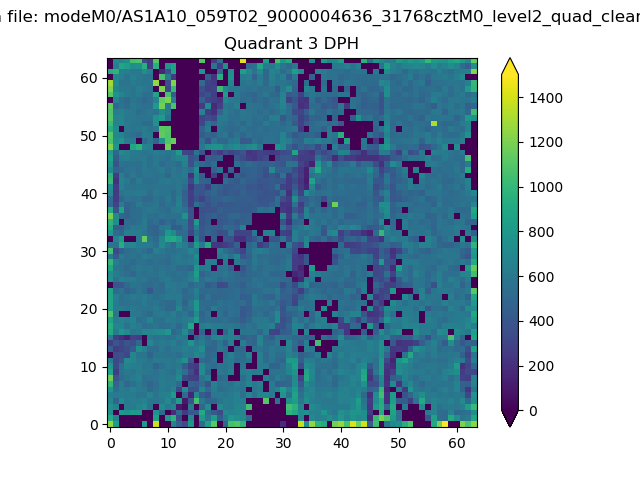 |
 |
Quadrant C |
| Plot type | Count rate plots | Images |
|---|---|---|
| Comparison with Poisson distribution Blue bars denote a histogram of data divided into 1 sec bins. Red curve is a Poisson curve with rate = median count rate of data. |
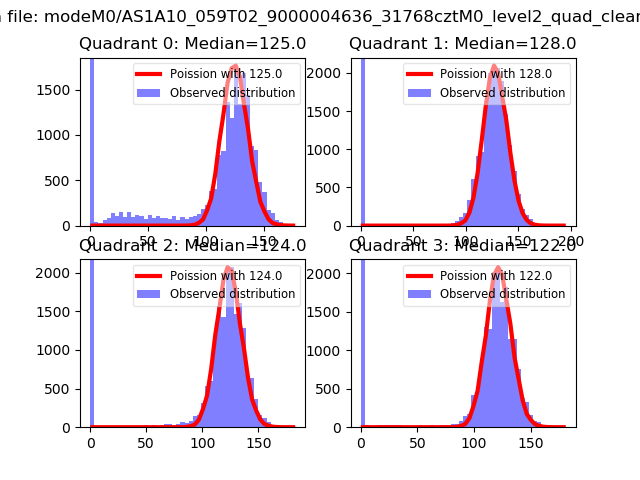 |
 |
| Quadrant-wise count rates Data is divided into 100 sec bins |
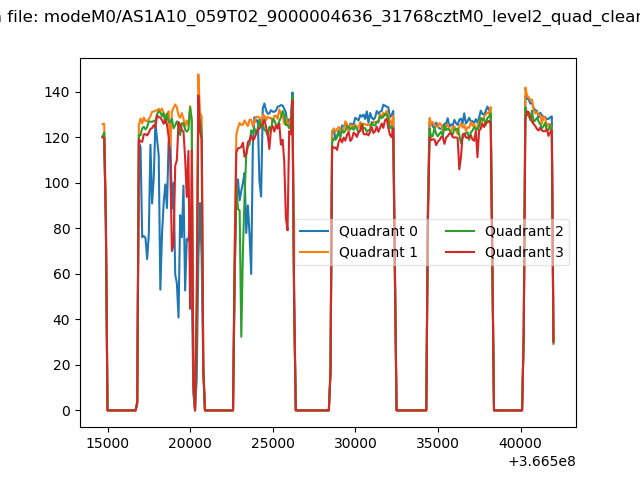 |
|
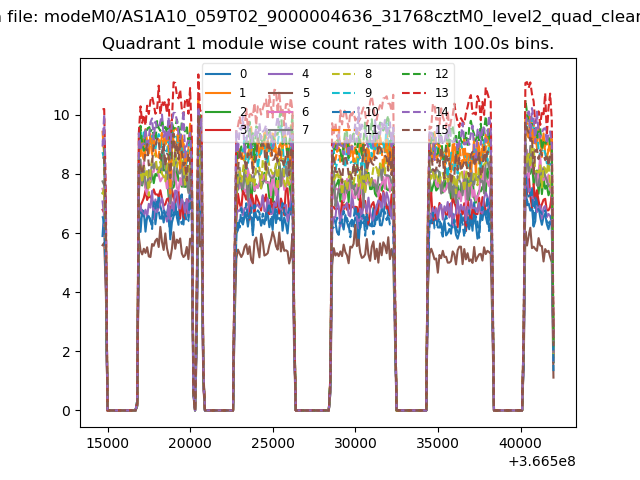
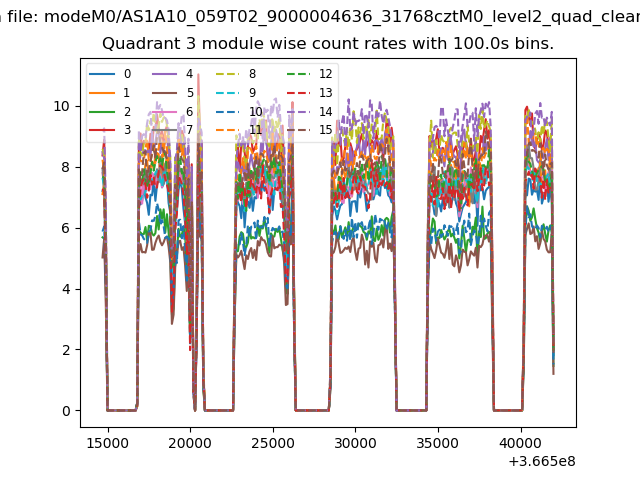
| Module-wise count rates for Quadrant A Data is divided into 100 sec bins |
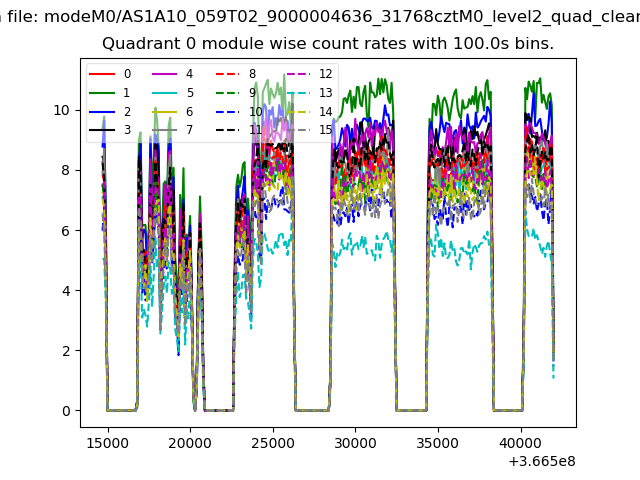 |
 |
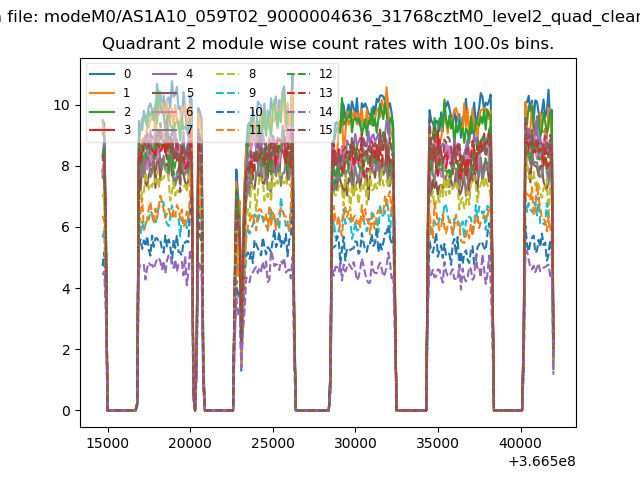
| Module-wise count rates for Quadrant B Data is divided into 100 sec bins |
 |
 |
| Module-wise count rates for Quadrant C Data is divided into 100 sec bins |
 |
 |
| Module-wise count rates for Quadrant D Data is divided into 100 sec bins |
 |
 |
| Parameter | Plot |
|---|---|
| CZT HV Monitor | 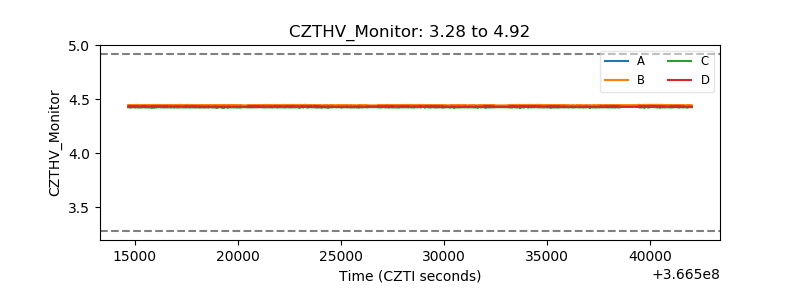 |
| D_VDD | 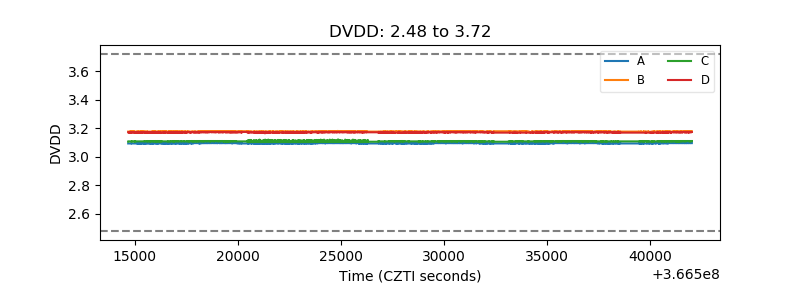 |
| Temperature 1 | 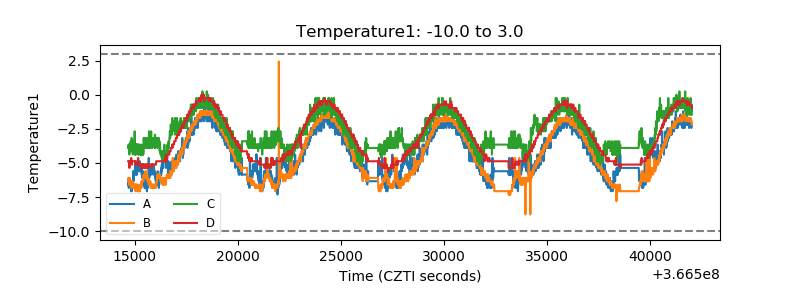 |
| Veto HV Monitor | 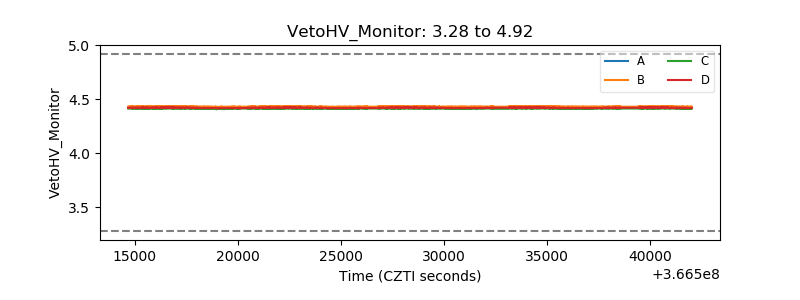 |
| Veto LLD | 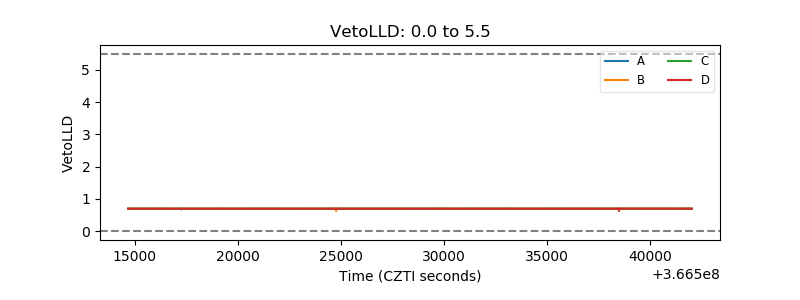 |
| Alpha Counter | 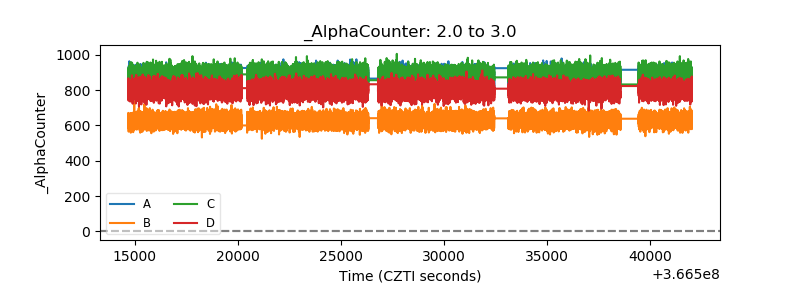 |
| _CPM_Rate | 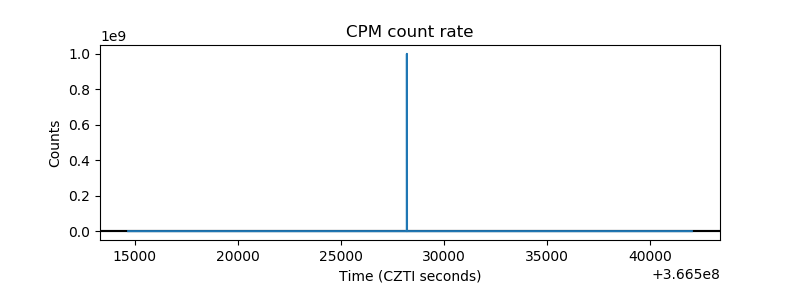 |
| CZT Counter | 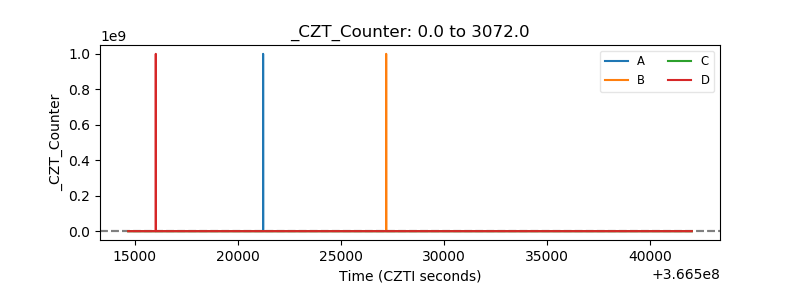 |
| +2.5 Volts monitor | 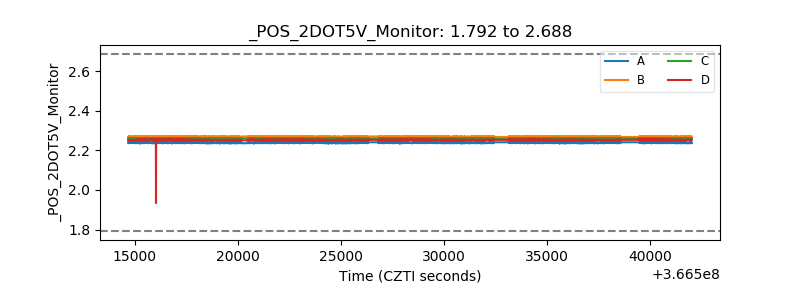 |
| +5 Volts monitor |  |
| _ROLL_ROT | 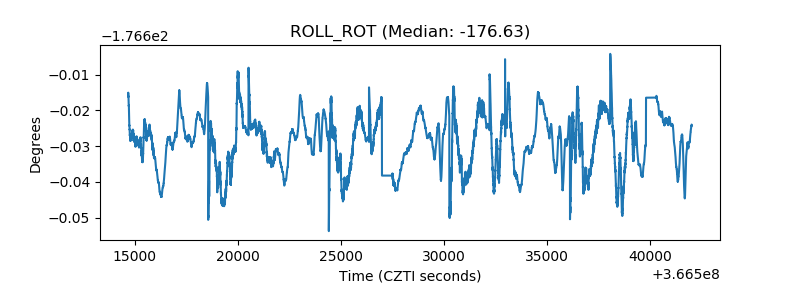 |
| _Roll_DEC | 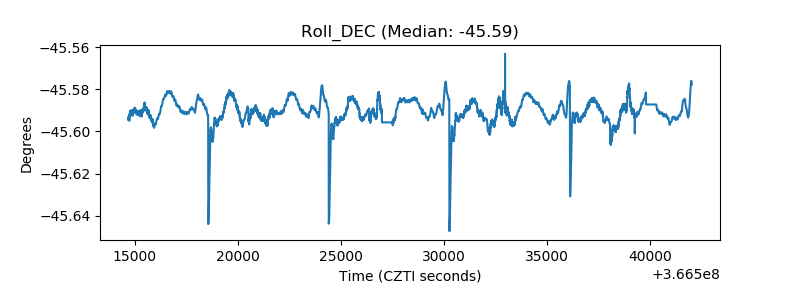 |
| _Roll_RA | 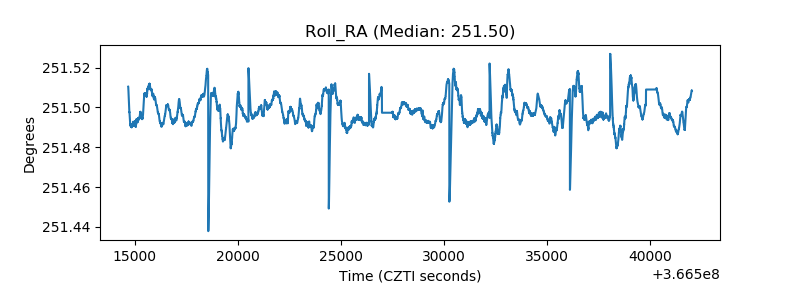 |
| Veto Counter | 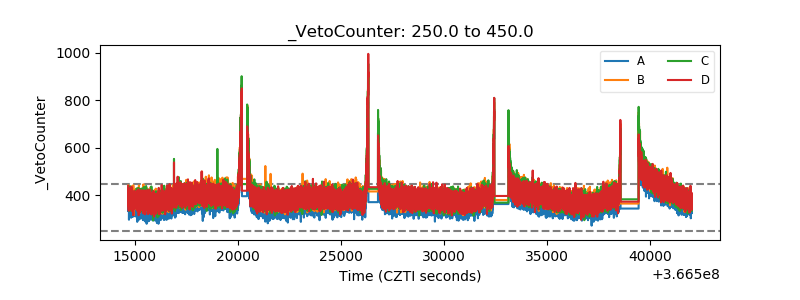 |