| Param | Original file | Final file |
|---|---|---|
| Filename | modeM0/AS1A10_109T01_9000004638cztM0_level2.fits | modeM0/AS1A10_109T01_9000004638cztM0_level2_quad_clean.evt |
| Size (bytes) | 180,132,480 | 152,550,720 |
| Size | 171.8 MB | 145.5 MB |
| Events in quadrant A | 1,184,259 | 935,943 |
| Events in quadrant B | 1,035,564 | 852,928 |
| Events in quadrant C | 1,085,620 | 866,889 |
| Events in quadrant D | 985,865 | 800,314 |
| Mode M0 | |||
|---|---|---|---|
| Quadrant | BADHDUFLAG | Total packets | Discarded packets |
| A | 0 | 37113 | 0 |
| B | 0 | 60393 | 0 |
| C | 0 | 52359 | 0 |
| D | 0 | 46881 | 0 |
| Mode M9 | |||
|---|---|---|---|
| Quadrant | BADHDUFLAG | Total packets | Discarded packets |
| A | 0 | 39 | 0 |
| B | 0 | 39 | 0 |
| C | 0 | 39 | 0 |
| D | 0 | 39 | 0 |
| Mode SS | |||
|---|---|---|---|
| Quadrant | BADHDUFLAG | Total packets | Discarded packets |
| A | 0 | 348 | 0 |
| B | 0 | 348 | 0 |
| C | 0 | 348 | 0 |
| D | 0 | 348 | 0 |
| Quadrant | Total seconds | Saturated seconds | Saturation percentage |
|---|---|---|---|
| A | 16860 | 237 | 1.405694% |
| B | 16851 | 2170 | 12.877574% |
| C | 16843 | 1392 | 8.264561% |
| D | 16857 | 779 | 4.621226% |
Noise dominated data is calculated using 1-second bins in cleaned event files. If a bin has >2000 counts, and if more than 50% of those come from <1% of pixels, then it is considered to be noise-dominated and hence unusable.
| Quadrant | # 1 sec bins | Bins with >0 counts | Bins with >2000 counts | High rate bins dominated by noise | Noise dominated (total time) | Noise dominated (detector-on time) | Marked lightcurve |
|---|---|---|---|---|---|---|---|
| A | 65073 | 14918 | 0 | 0 | 0.00% | 0.00% | 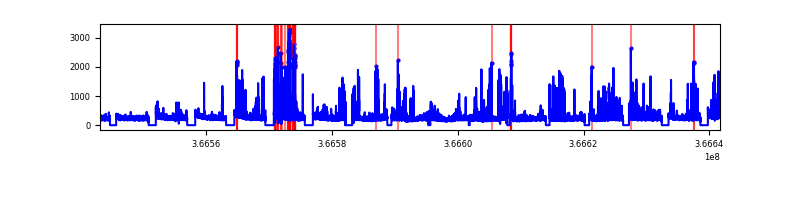 |
| B | 65072 | 14911 | 0 | 0 | 0.00% | 0.00% |  |
| C | 65072 | 14892 | 0 | 0 | 0.00% | 0.00% | 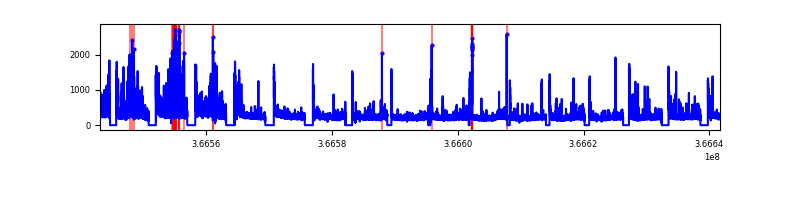 |
| D | 65072 | 14915 | 0 | 0 | 0.00% | 0.00% |  |
Top three noisy pixels from each quadrant. If the there are fewer than three noisy pixels in the level2.evt file, extra rows are filled as -1
| Pixel properties | Quadrant properties | ||||||
|---|---|---|---|---|---|---|---|
| Quadrant | DetID | PixID | Counts | Sigma | Mean | Median | Sigma |
| A | 0 | 29 | 985 | 9.18 | 309 | 292 | 75.5 |
| A | 9 | 19 | 916 | 8.26 | 309 | 292 | 75.5 |
| A | 7 | 110 | 893 | 7.96 | 309 | 292 | 75.5 |
| B | 2 | 9 | 834 | 10.22 | 274 | 263 | 55.9 |
| B | 3 | 80 | 740 | 8.54 | 274 | 263 | 55.9 |
| B | 3 | 17 | 687 | 7.59 | 274 | 263 | 55.9 |
| C | 3 | 202 | 830 | 7.59 | 287 | 271 | 73.7 |
| C | 3 | 203 | 783 | 6.95 | 287 | 271 | 73.7 |
| C | 3 | 187 | 757 | 6.6 | 287 | 271 | 73.7 |
| D | 6 | 67 | 707 | 5.98 | 283 | 260 | 74.8 |
| D | 6 | 62 | 702 | 5.91 | 283 | 260 | 74.8 |
| D | 7 | 3 | 692 | 5.78 | 283 | 260 | 74.8 |
Histogram calculated using DETX and DETY for each event in the final _common_clean file
| Quadrant A | 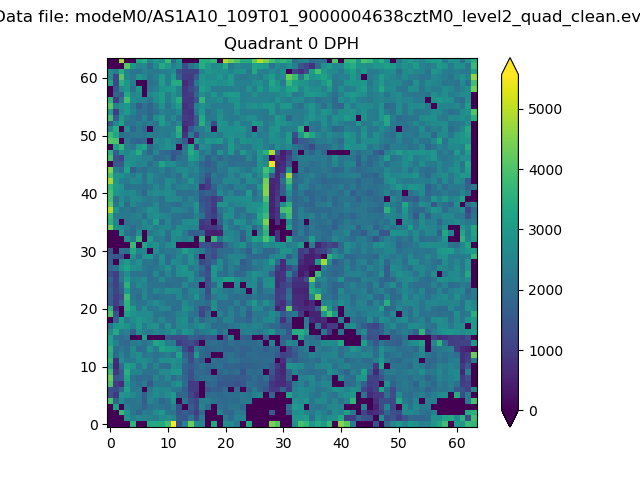 |
 |
Quadrant B |
|---|---|---|---|
| Quadrant D | 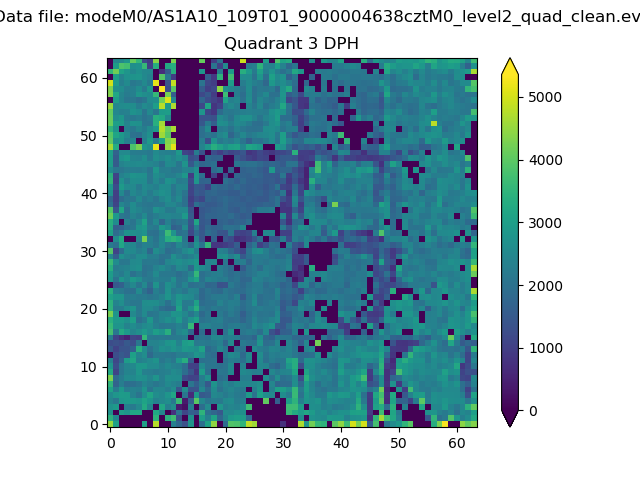 |
 |
Quadrant C |
| Plot type | Count rate plots | Images |
|---|---|---|
| Comparison with Poisson distribution Blue bars denote a histogram of data divided into 1 sec bins. Red curve is a Poisson curve with rate = median count rate of data. |
 |
 |
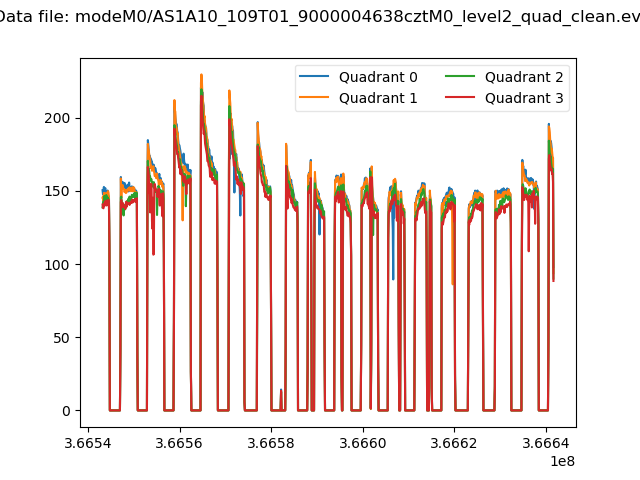
| Quadrant-wise count rates Data is divided into 100 sec bins |
 |
|
| Module-wise count rates for Quadrant A Data is divided into 100 sec bins |
 |
 |
| Module-wise count rates for Quadrant B Data is divided into 100 sec bins |
 |
 |
| Module-wise count rates for Quadrant C Data is divided into 100 sec bins |
 |
 |
| Module-wise count rates for Quadrant D Data is divided into 100 sec bins |
 |
 |
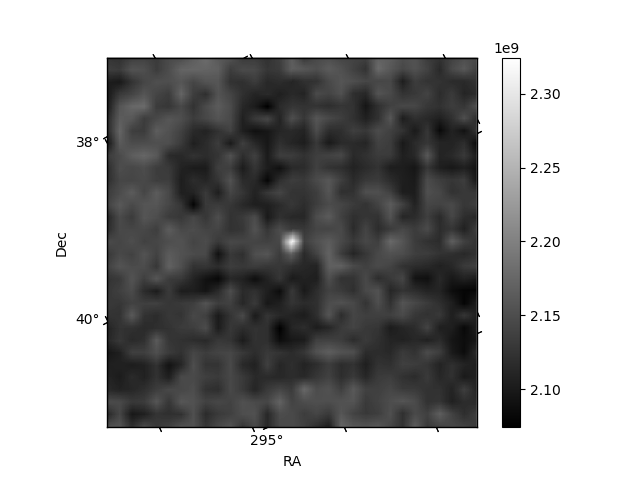
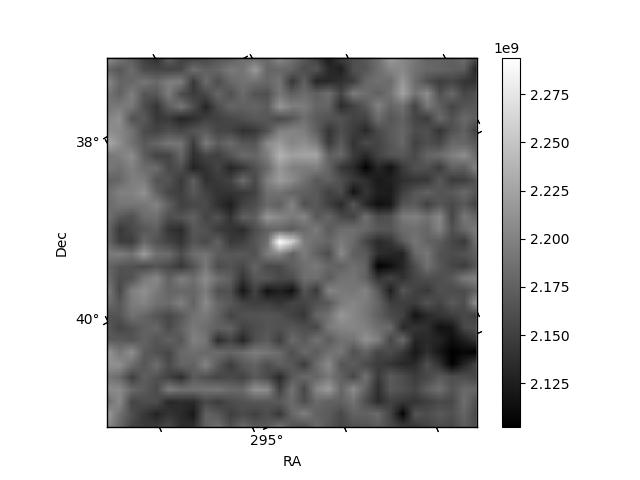
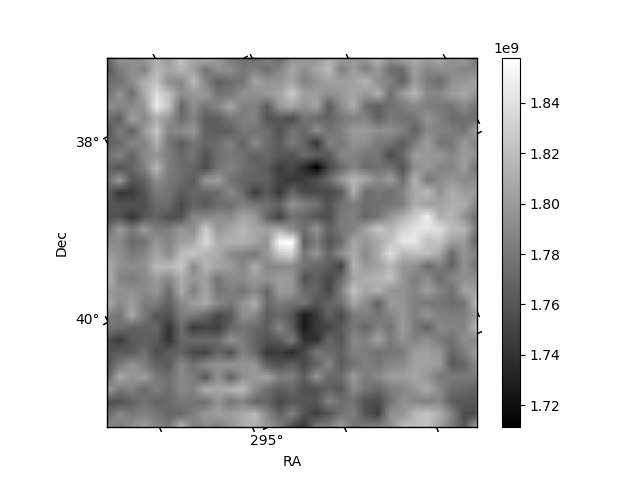
| Parameter | Plot |
|---|---|
| CZT HV Monitor | 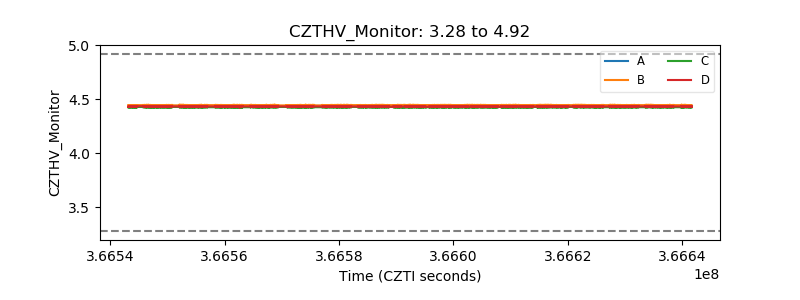 |
| D_VDD | 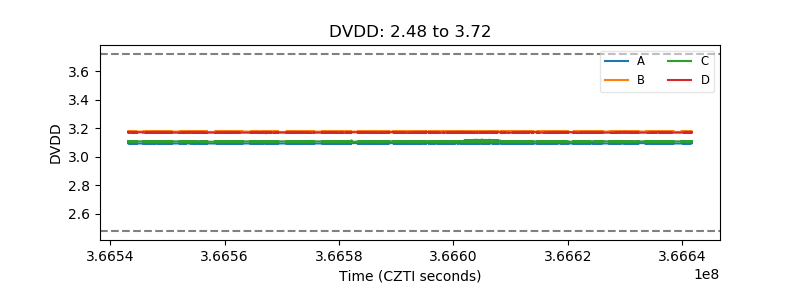 |
| Temperature 1 |  |
| Veto HV Monitor |  |
| Veto LLD | 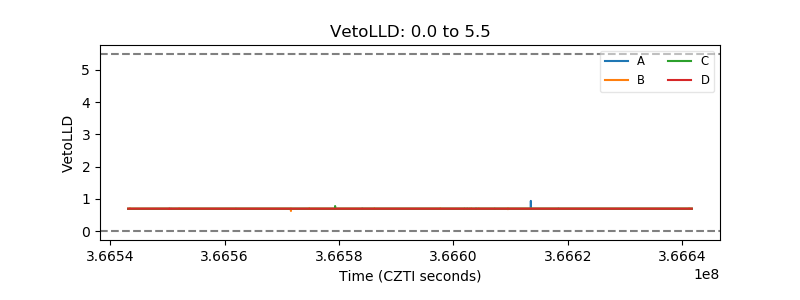 |
| Alpha Counter |  |
| _CPM_Rate | 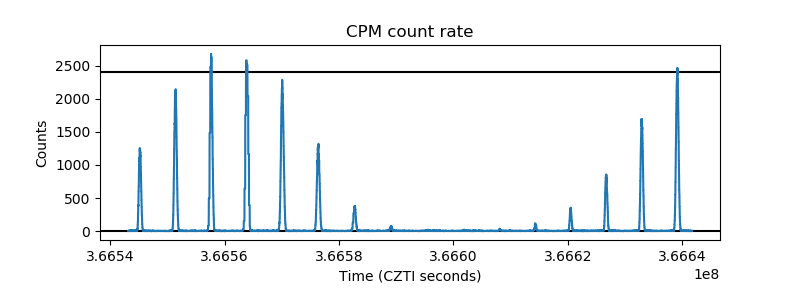 |
| CZT Counter |  |
| +2.5 Volts monitor |  |
| +5 Volts monitor | 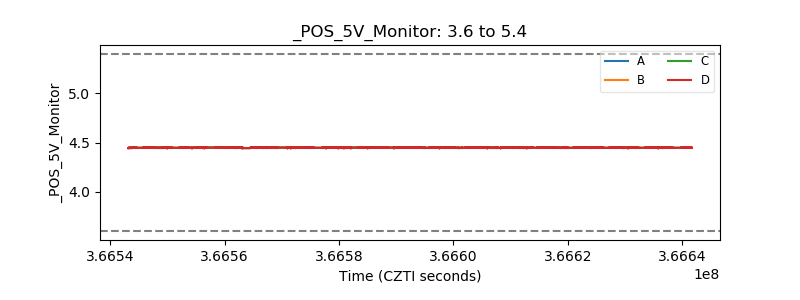 |
| _ROLL_ROT |  |
| _Roll_DEC | 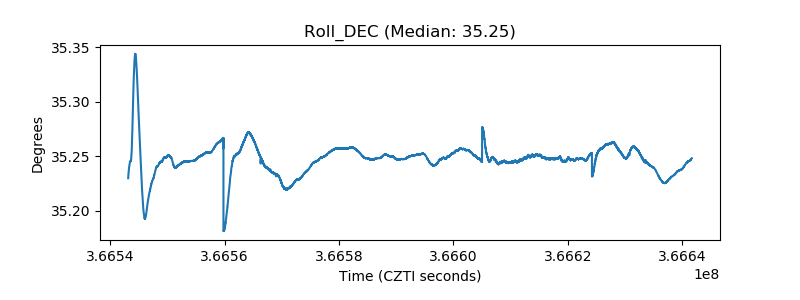 |
| _Roll_RA |  |
| Veto Counter | 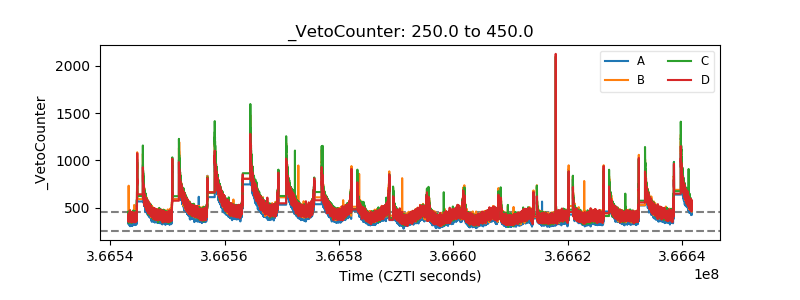 |