| Param | Original file | Final file |
|---|---|---|
| Filename | modeM0/AS1A10_109T01_9000004638_31768cztM0_level2.evt | modeM0/AS1A10_109T01_9000004638_31768cztM0_level2_quad_clean.evt |
| Size (bytes) | 275,699,520 | 38,177,280 |
| Size | 262.9 MB | 36.4 MB |
| Events in quadrant A | 1,618,096 | 240,690 |
| Events in quadrant B | 2,518,539 | 236,658 |
| Events in quadrant C | 2,165,401 | 232,313 |
| Events in quadrant D | 1,840,248 | 229,852 |
| Mode M0 | |||
|---|---|---|---|
| Quadrant | BADHDUFLAG | Total packets | Discarded packets |
| A | 0 | 6637 | 1 |
| B | 0 | 9453 | 1 |
| C | 0 | 8651 | 1 |
| D | 0 | 7538 | 4 |
| Mode M9 | |||
|---|---|---|---|
| Quadrant | BADHDUFLAG | Total packets | Discarded packets |
| A | 0 | 10 | 0 |
| B | 0 | 10 | 0 |
| C | 0 | 10 | 0 |
| D | 0 | 10 | 0 |
| Mode SS | |||
|---|---|---|---|
| Quadrant | BADHDUFLAG | Total packets | Discarded packets |
| A | 0 | 64 | 0 |
| B | 0 | 64 | 0 |
| C | 0 | 64 | 0 |
| D | 0 | 64 | 0 |
| Quadrant | Total seconds | Saturated seconds | Saturation percentage |
|---|---|---|---|
| A | 3030 | 75 | 2.475248% |
| B | 3030 | 119 | 3.927393% |
| C | 3030 | 168 | 5.544554% |
| D | 3029 | 63 | 2.079894% |
Noise dominated data is calculated using 1-second bins in cleaned event files. If a bin has >2000 counts, and if more than 50% of those come from <1% of pixels, then it is considered to be noise-dominated and hence unusable.
| Quadrant | # 1 sec bins | Bins with >0 counts | Bins with >2000 counts | High rate bins dominated by noise | Noise dominated (total time) | Noise dominated (detector-on time) | Marked lightcurve |
|---|---|---|---|---|---|---|---|
| A | 4015 | 3031 | 0 | 0 | 0.00% | 0.00% | 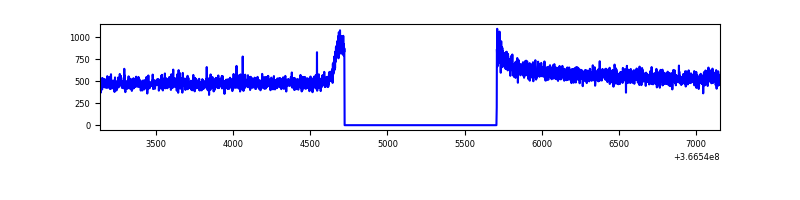 |
| B | 4015 | 3031 | 5 | 5 | 0.12% | 0.16% | 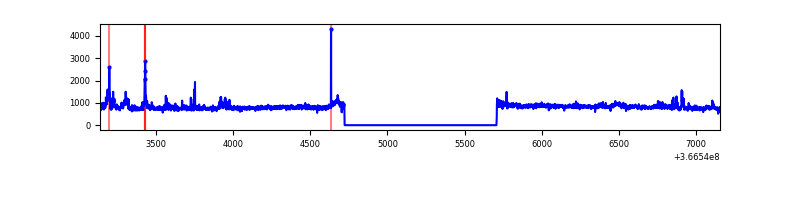 |
| C | 4015 | 3031 | 21 | 21 | 0.52% | 0.69% | 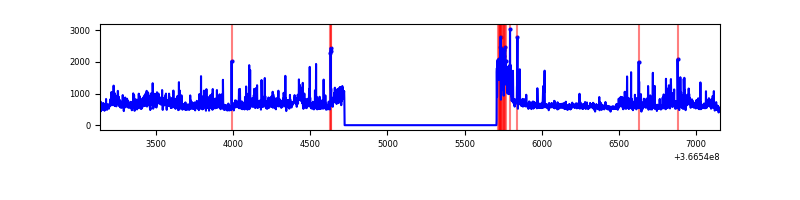 |
| D | 4015 | 3031 | 6 | 6 | 0.15% | 0.20% | 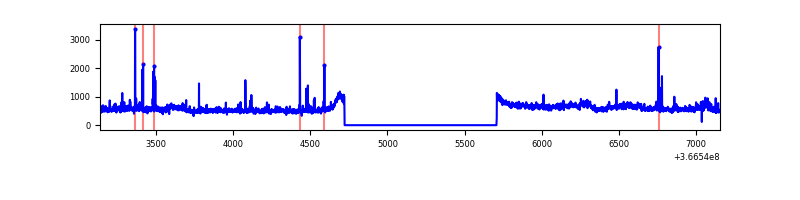 |
Top three noisy pixels from each quadrant. If the there are fewer than three noisy pixels in the level2.evt file, extra rows are filled as -1
| Pixel properties | Quadrant properties | ||||||
|---|---|---|---|---|---|---|---|
| Quadrant | DetID | PixID | Counts | Sigma | Mean | Median | Sigma |
| A | 13 | 254 | 5530 | 60.94 | 419 | 412 | 84.0 |
| A | 3 | 137 | 4206 | 45.18 | 419 | 412 | 84.0 |
| A | 0 | 226 | 3520 | 37.01 | 419 | 412 | 84.0 |
| B | 6 | 159 | 777307 | 9795.07 | 409 | 400 | 79.3 |
| B | 10 | 245 | 75326 | 944.65 | 409 | 400 | 79.3 |
| B | 10 | 247 | 21151 | 261.62 | 409 | 400 | 79.3 |
| C | 0 | 10 | 392397 | 4220.02 | 388 | 391 | 92.9 |
| C | 3 | 233 | 165920 | 1781.95 | 388 | 391 | 92.9 |
| C | 14 | 238 | 62989 | 673.88 | 388 | 391 | 92.9 |
| D | 8 | 195 | 225172 | 2342.34 | 400 | 390 | 96.0 |
| D | 12 | 227 | 39832 | 411.01 | 400 | 390 | 96.0 |
| D | 1 | 52 | 24218 | 248.3 | 400 | 390 | 96.0 |
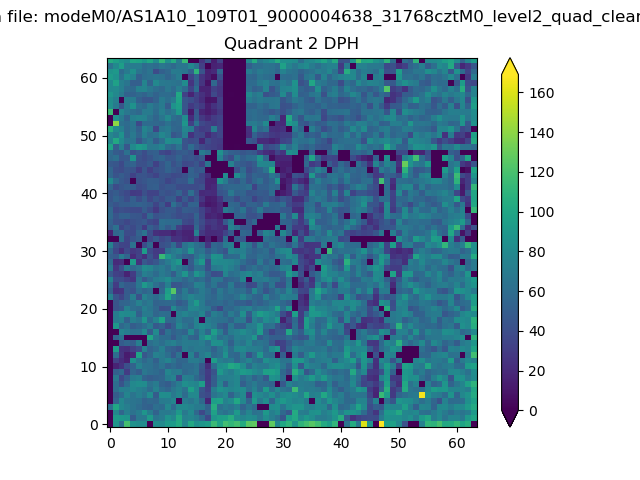
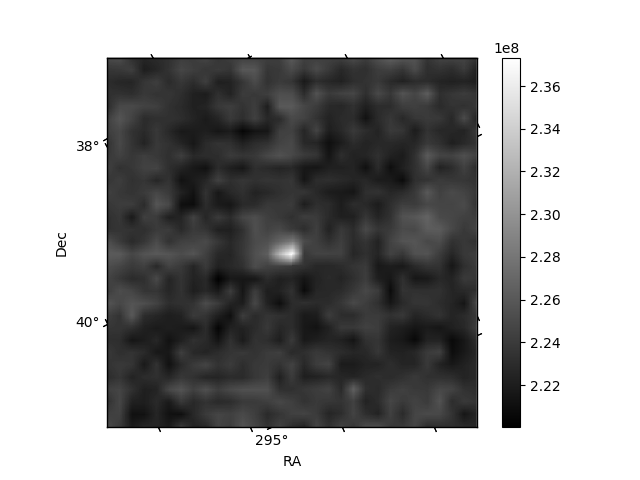
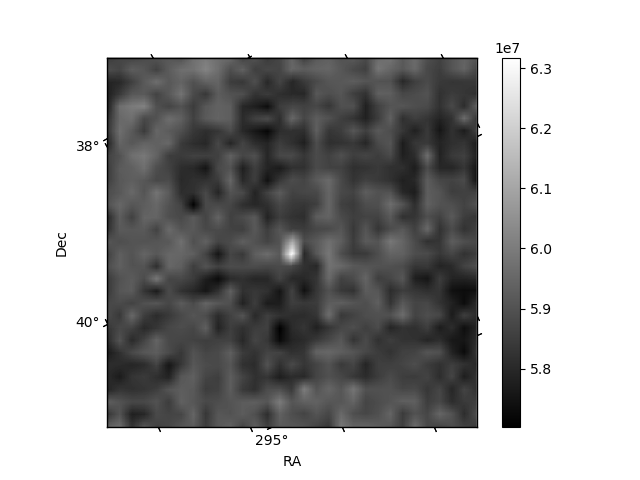
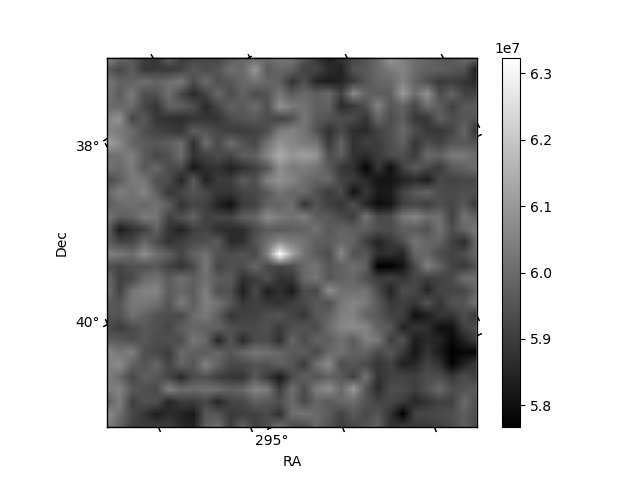
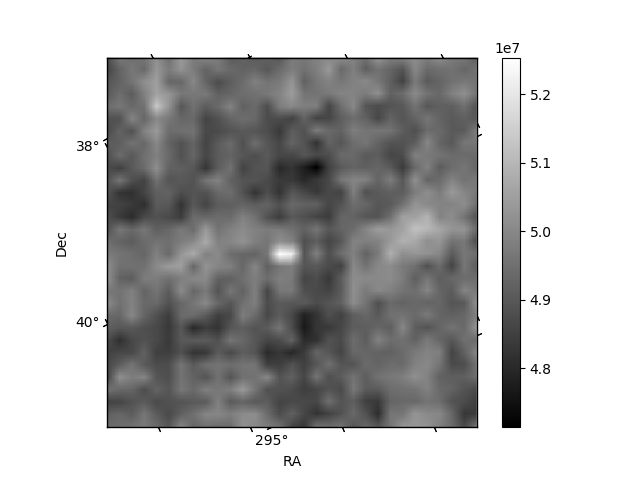
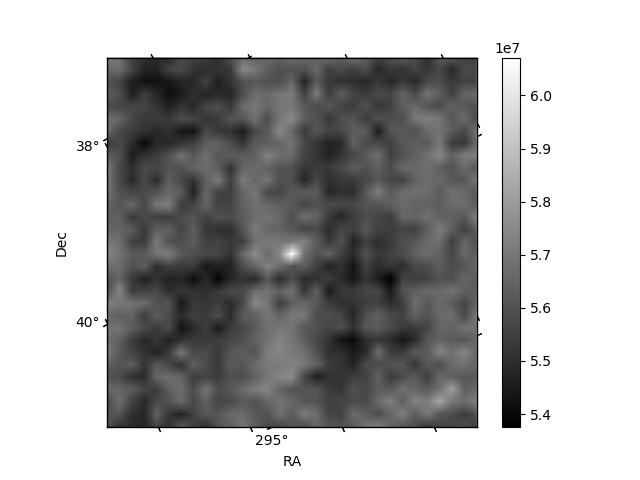
Histogram calculated using DETX and DETY for each event in the final _common_clean file
| Quadrant A | 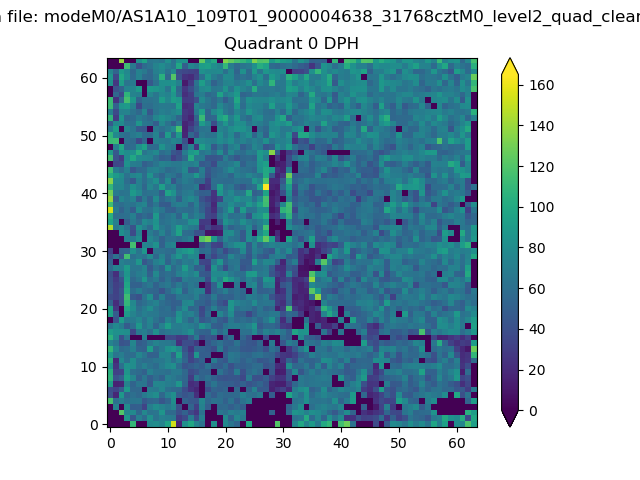 |
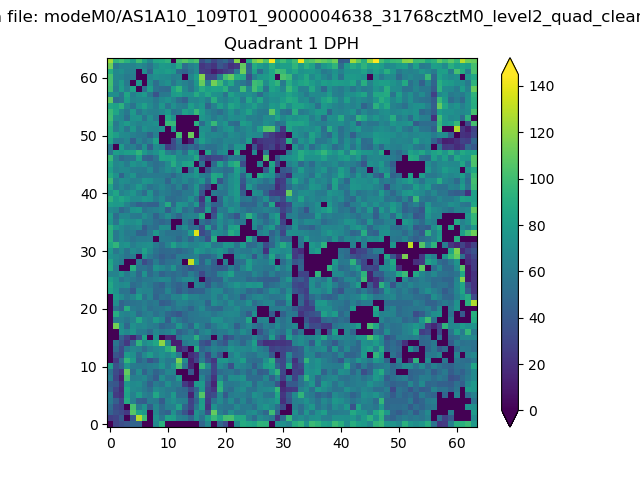 |
Quadrant B |
|---|---|---|---|
| Quadrant D | 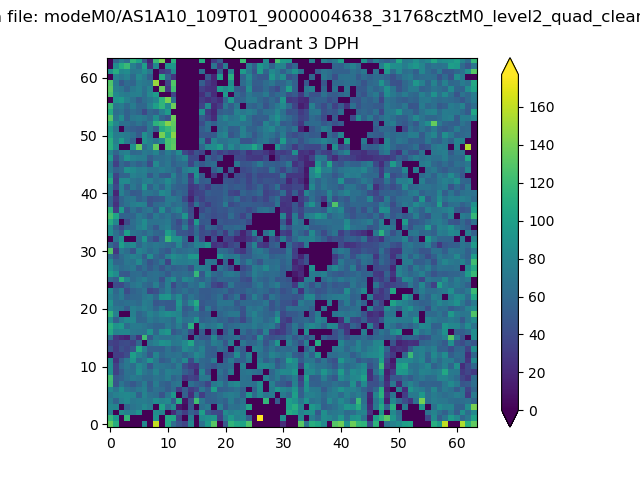 |
 |
Quadrant C |
| Plot type | Count rate plots | Images |
|---|---|---|
| Comparison with Poisson distribution Blue bars denote a histogram of data divided into 1 sec bins. Red curve is a Poisson curve with rate = median count rate of data. |
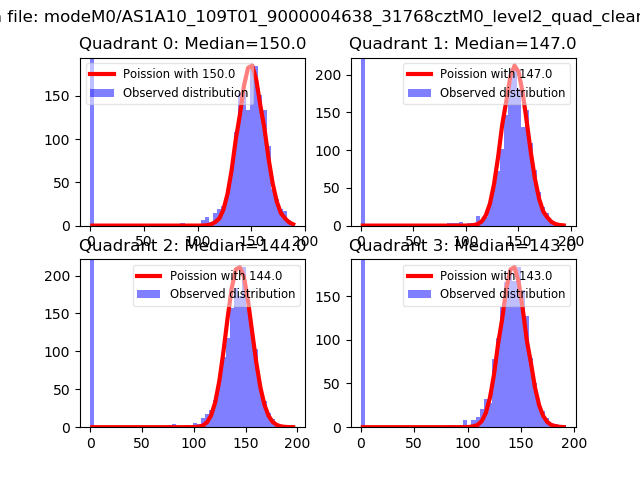 |
 |
| Quadrant-wise count rates Data is divided into 100 sec bins |
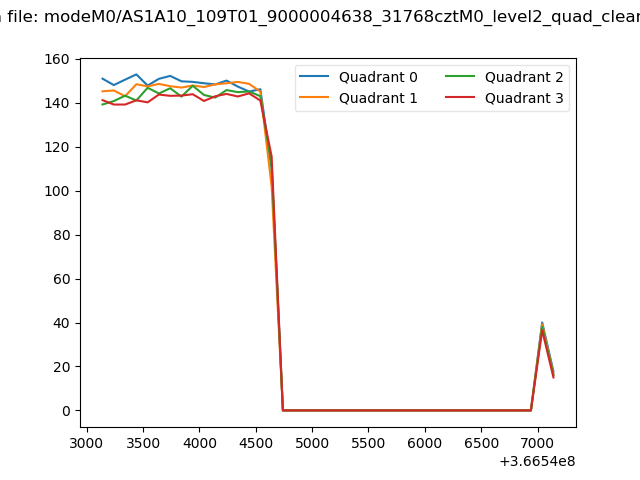 |
|
| Module-wise count rates for Quadrant A Data is divided into 100 sec bins |
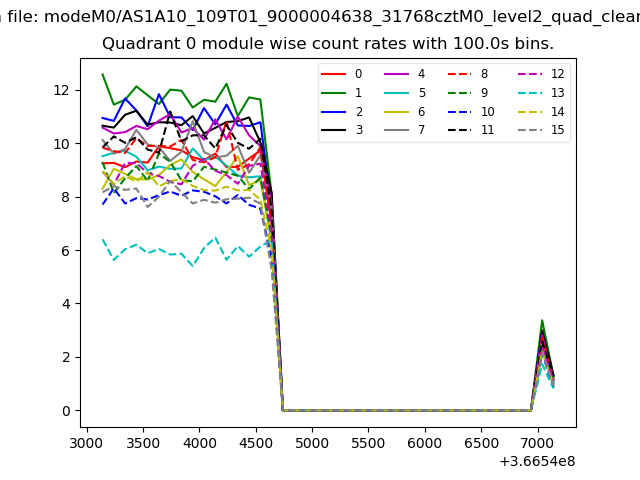 |
 |
| Module-wise count rates for Quadrant B Data is divided into 100 sec bins |
 |
 |
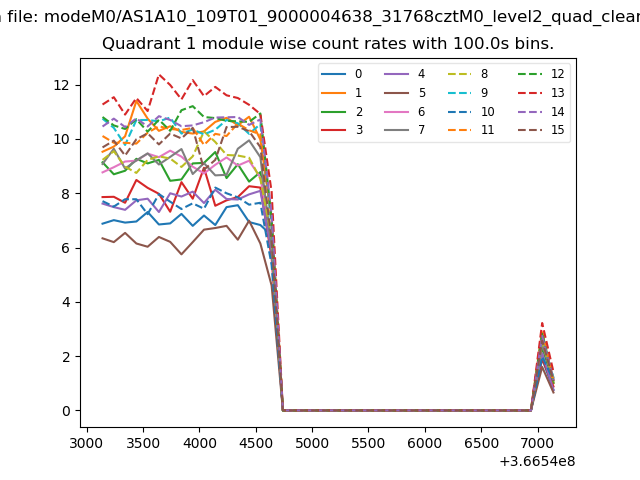
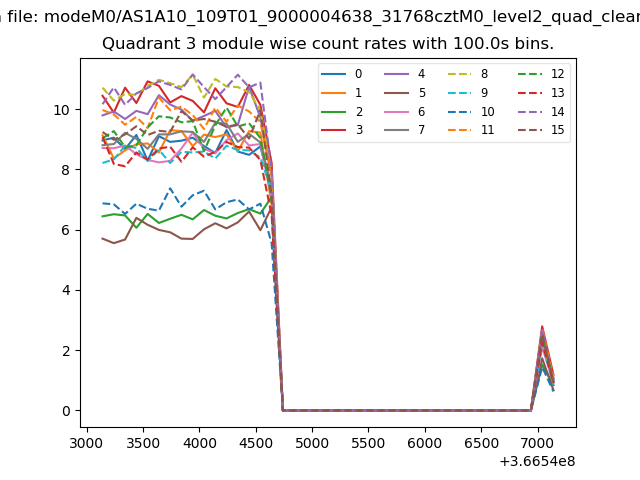
| Module-wise count rates for Quadrant C Data is divided into 100 sec bins |
 |
 |
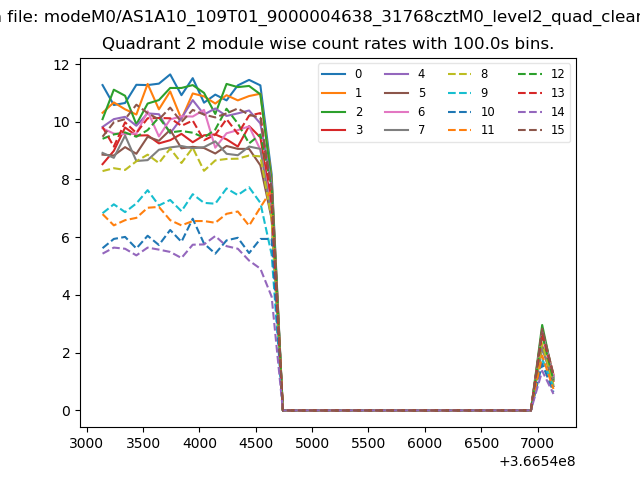
| Module-wise count rates for Quadrant D Data is divided into 100 sec bins |
 |
 |
| Parameter | Plot |
|---|---|
| CZT HV Monitor | 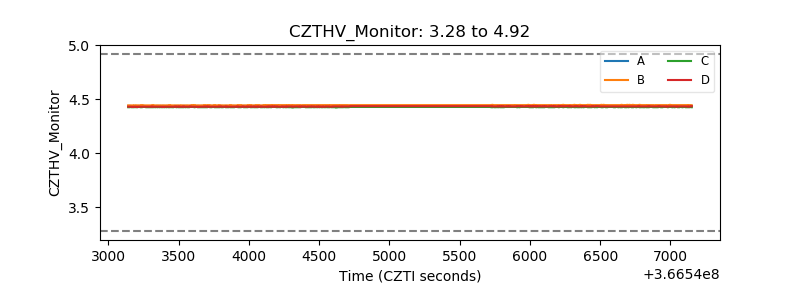 |
| D_VDD | 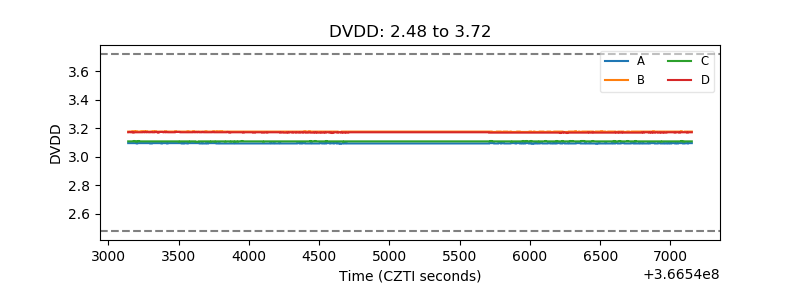 |
| Temperature 1 | 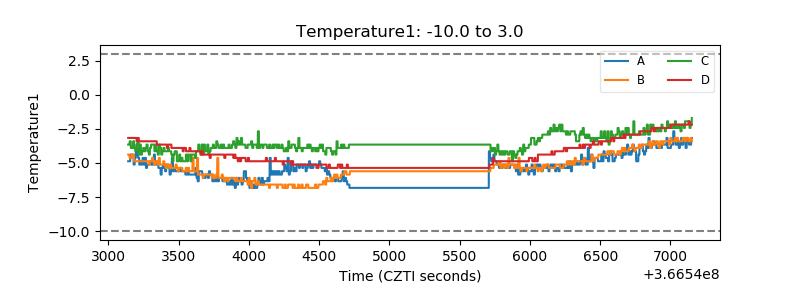 |
| Veto HV Monitor |  |
| Veto LLD | 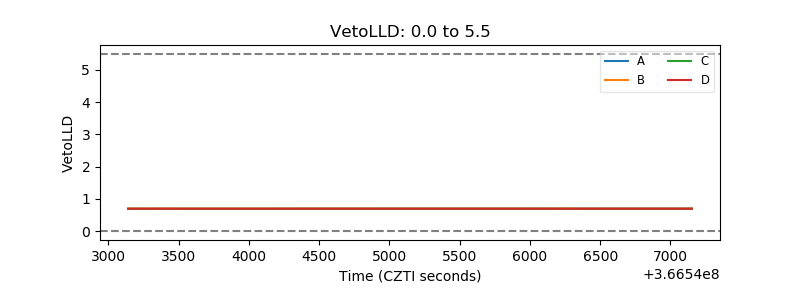 |
| Alpha Counter | 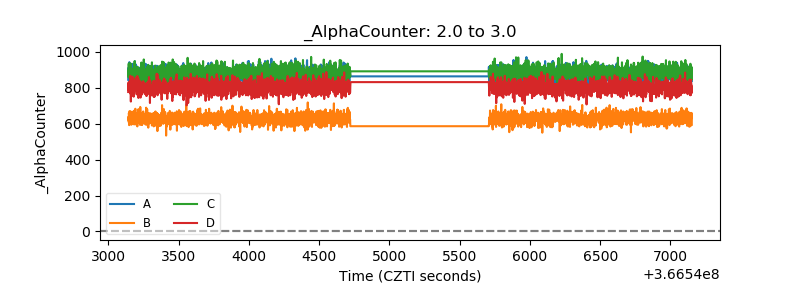 |
| _CPM_Rate | 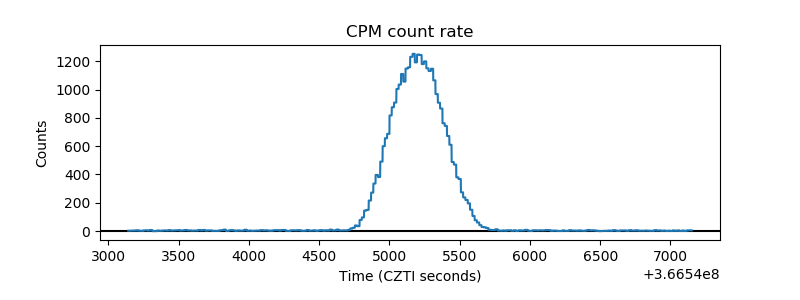 |
| CZT Counter | 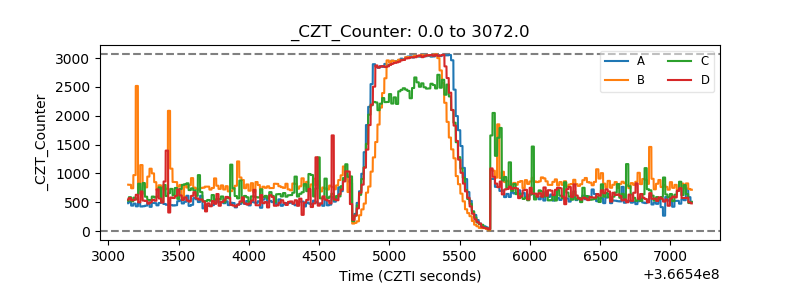 |
| +2.5 Volts monitor | 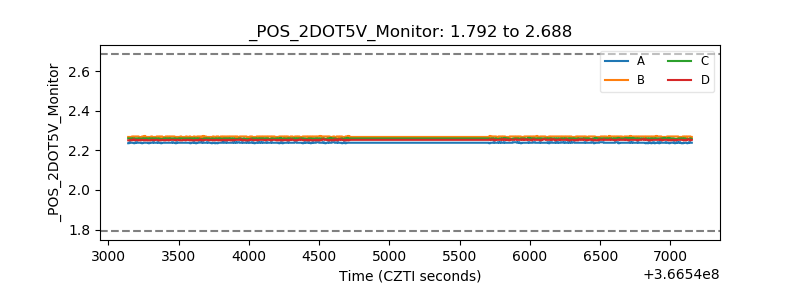 |
| +5 Volts monitor | 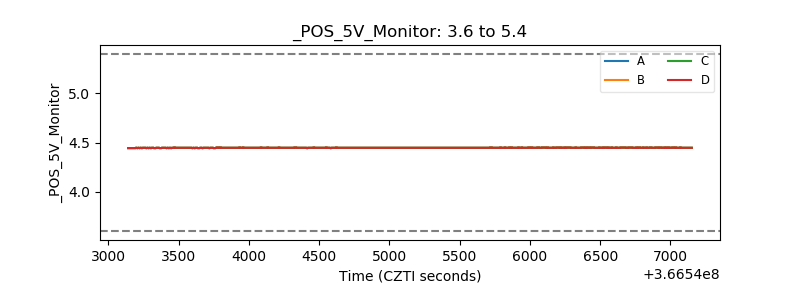 |
| _ROLL_ROT | 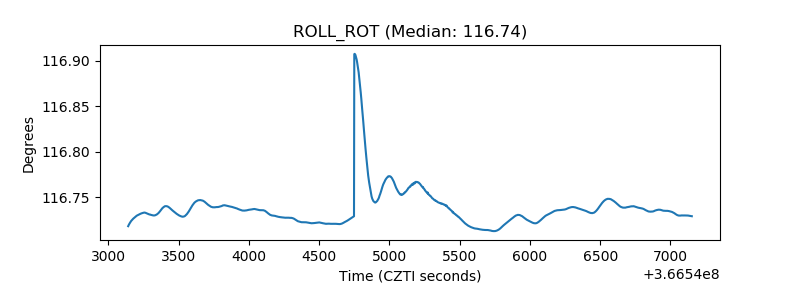 |
| _Roll_DEC | 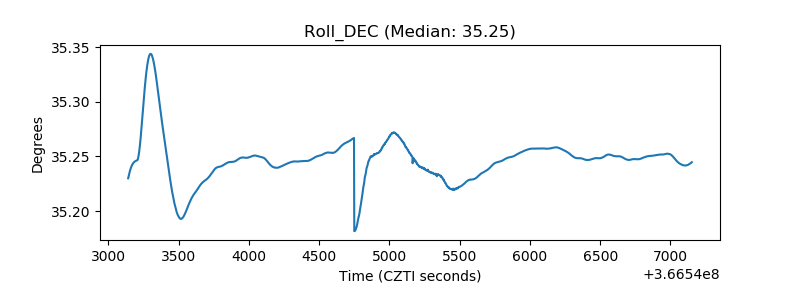 |
| _Roll_RA | 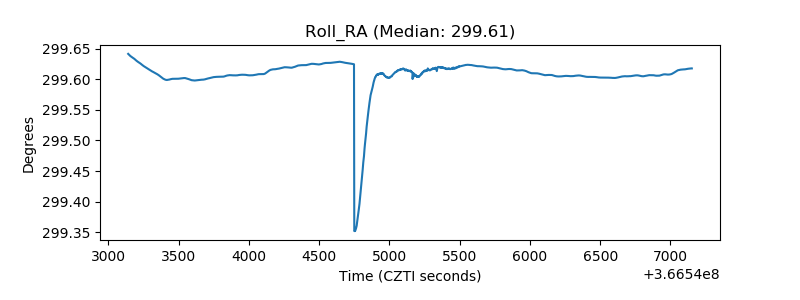 |
| Veto Counter | 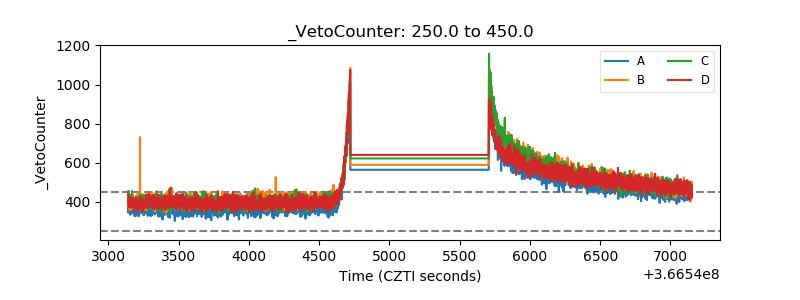 |