| Param | Original file | Final file |
|---|---|---|
| Filename | modeM0/AS1A10_109T01_9000004638_31770cztM0_level2.evt | modeM0/AS1A10_109T01_9000004638_31770cztM0_level2_quad_clean.evt |
| Size (bytes) | 636,220,800 | 105,701,760 |
| Size | 606.7 MB | 100.8 MB |
| Events in quadrant A | 3,792,363 | 701,837 |
| Events in quadrant B | 5,671,574 | 694,162 |
| Events in quadrant C | 5,135,226 | 662,202 |
| Events in quadrant D | 4,195,527 | 655,496 |
| Mode M0 | |||
|---|---|---|---|
| Quadrant | BADHDUFLAG | Total packets | Discarded packets |
| A | 0 | 15604 | 2 |
| B | 0 | 21699 | 2 |
| C | 0 | 20132 | 2 |
| D | 0 | 17194 | 2 |
| Mode M9 | |||
|---|---|---|---|
| Quadrant | BADHDUFLAG | Total packets | Discarded packets |
| A | 0 | 21 | 0 |
| B | 0 | 21 | 0 |
| C | 0 | 21 | 0 |
| D | 0 | 21 | 0 |
| Mode SS | |||
|---|---|---|---|
| Quadrant | BADHDUFLAG | Total packets | Discarded packets |
| A | 0 | 146 | 0 |
| B | 0 | 146 | 0 |
| C | 0 | 146 | 0 |
| D | 0 | 146 | 0 |
| Quadrant | Total seconds | Saturated seconds | Saturation percentage |
|---|---|---|---|
| A | 6994 | 137 | 1.958822% |
| B | 6995 | 229 | 3.273767% |
| C | 6995 | 436 | 6.233024% |
| D | 6995 | 105 | 1.501072% |
Noise dominated data is calculated using 1-second bins in cleaned event files. If a bin has >2000 counts, and if more than 50% of those come from <1% of pixels, then it is considered to be noise-dominated and hence unusable.
| Quadrant | # 1 sec bins | Bins with >0 counts | Bins with >2000 counts | High rate bins dominated by noise | Noise dominated (total time) | Noise dominated (detector-on time) | Marked lightcurve |
|---|---|---|---|---|---|---|---|
| A | 9129 | 6996 | 0 | 0 | 0.00% | 0.00% |  |
| B | 9130 | 6997 | 13 | 13 | 0.14% | 0.19% |  |
| C | 9130 | 6997 | 79 | 79 | 0.87% | 1.13% | 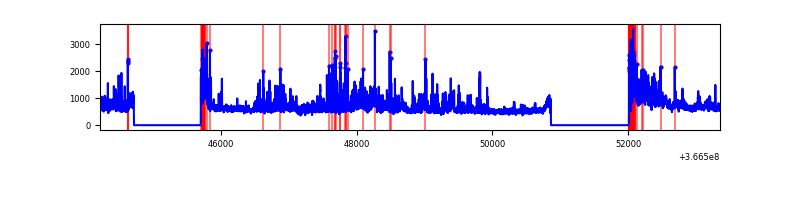 |
| D | 9130 | 6997 | 6 | 6 | 0.07% | 0.09% | 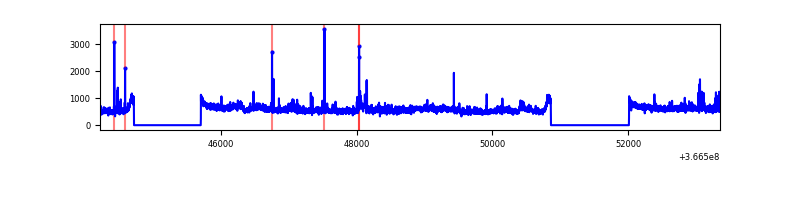 |
Top three noisy pixels from each quadrant. If the there are fewer than three noisy pixels in the level2.evt file, extra rows are filled as -1
| Pixel properties | Quadrant properties | ||||||
|---|---|---|---|---|---|---|---|
| Quadrant | DetID | PixID | Counts | Sigma | Mean | Median | Sigma |
| A | 0 | 13 | 17323 | 85.07 | 976 | 960 | 192.3 |
| A | 13 | 254 | 12583 | 60.43 | 976 | 960 | 192.3 |
| A | 13 | 210 | 12512 | 60.06 | 976 | 960 | 192.3 |
| B | 6 | 159 | 1788382 | 9949.1 | 947 | 926 | 179.7 |
| B | 10 | 245 | 99197 | 546.98 | 947 | 926 | 179.7 |
| B | 12 | 111 | 21949 | 117.01 | 947 | 926 | 179.7 |
| C | 0 | 10 | 861776 | 4093.29 | 901 | 909 | 210.3 |
| C | 3 | 233 | 534049 | 2535.0 | 901 | 909 | 210.3 |
| C | 14 | 238 | 147118 | 695.2 | 901 | 909 | 210.3 |
| D | 8 | 195 | 516779 | 2348.32 | 934 | 912 | 219.7 |
| D | 12 | 227 | 55173 | 247.01 | 934 | 912 | 219.7 |
| D | 2 | 250 | 45810 | 204.38 | 934 | 912 | 219.7 |
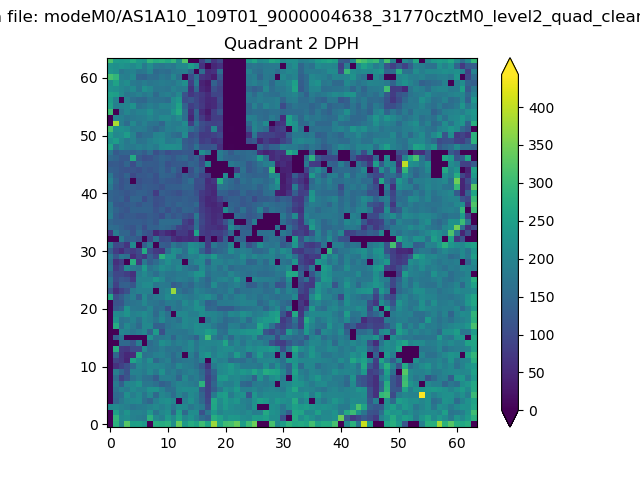
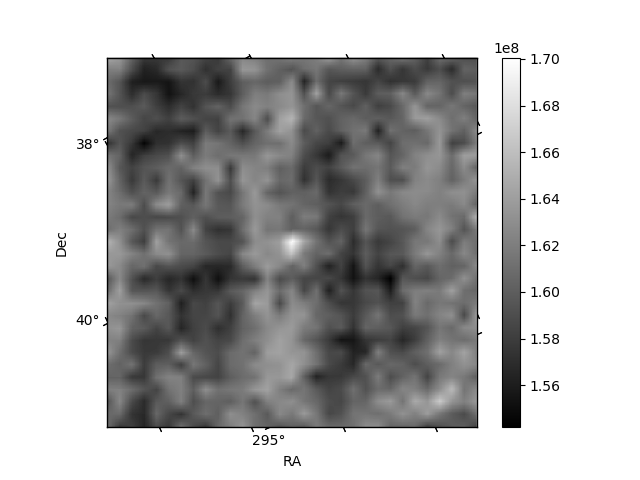
Histogram calculated using DETX and DETY for each event in the final _common_clean file
| Quadrant A | 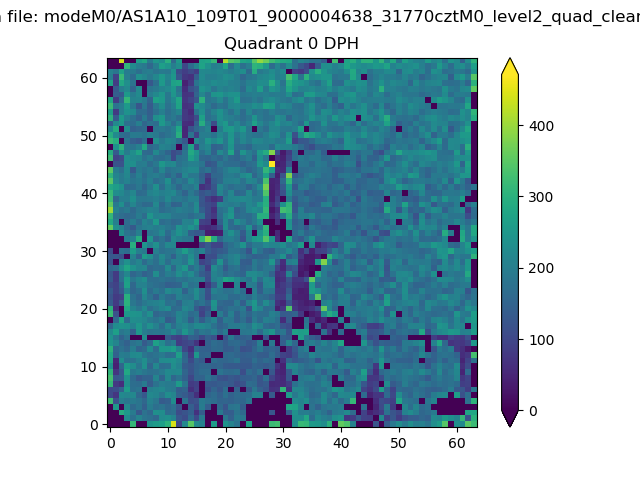 |
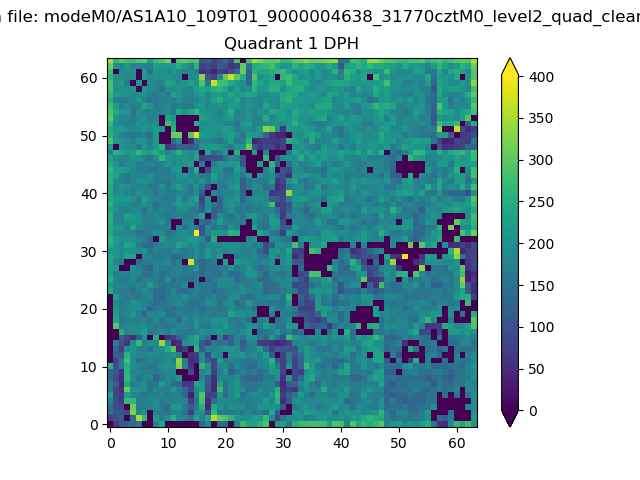 |
Quadrant B |
|---|---|---|---|
| Quadrant D | 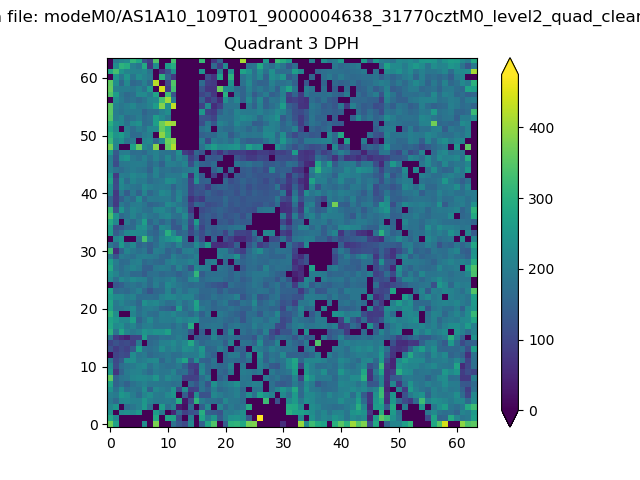 |
 |
Quadrant C |
| Plot type | Count rate plots | Images |
|---|---|---|
| Comparison with Poisson distribution Blue bars denote a histogram of data divided into 1 sec bins. Red curve is a Poisson curve with rate = median count rate of data. |
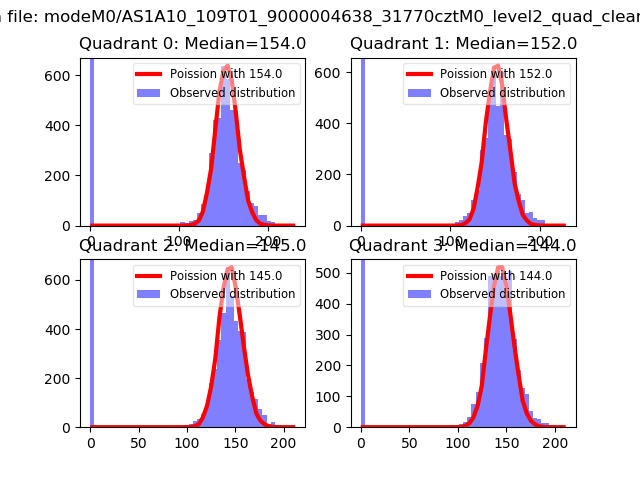 |
 |
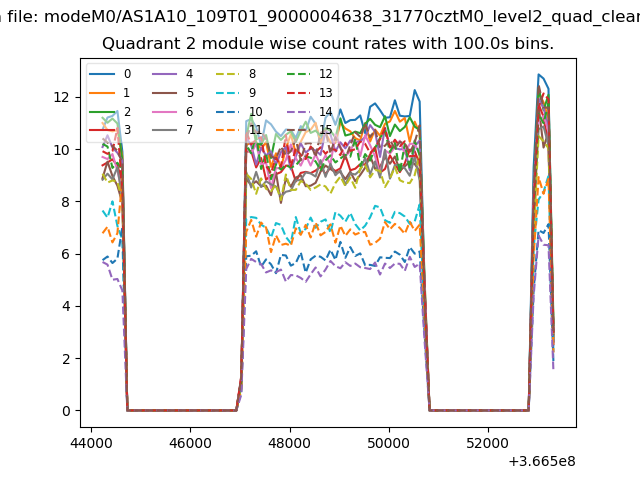
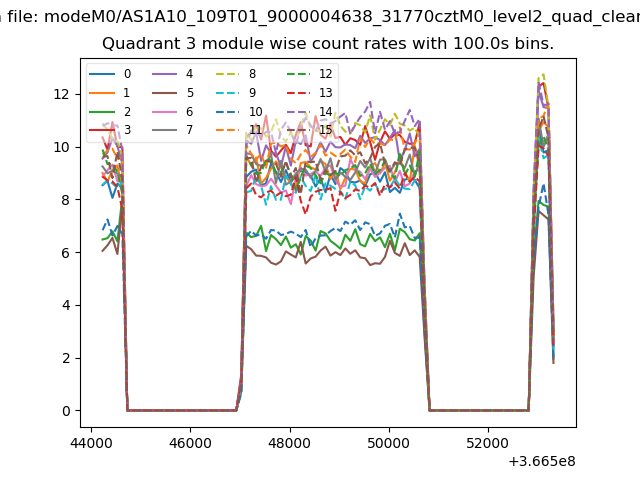
| Quadrant-wise count rates Data is divided into 100 sec bins |
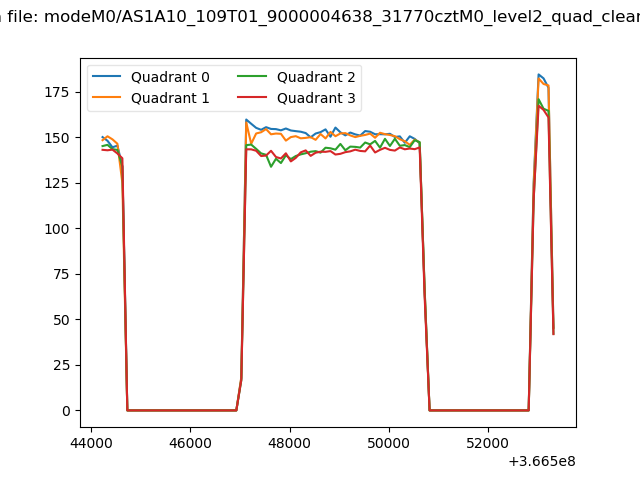 |
|
| Module-wise count rates for Quadrant A Data is divided into 100 sec bins |
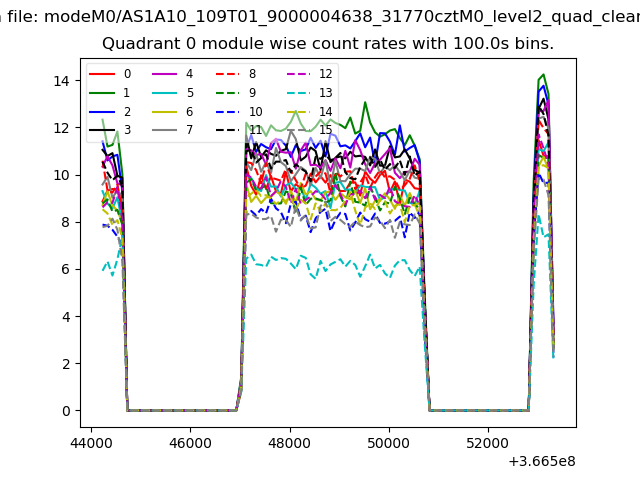 |
 |
| Module-wise count rates for Quadrant B Data is divided into 100 sec bins |
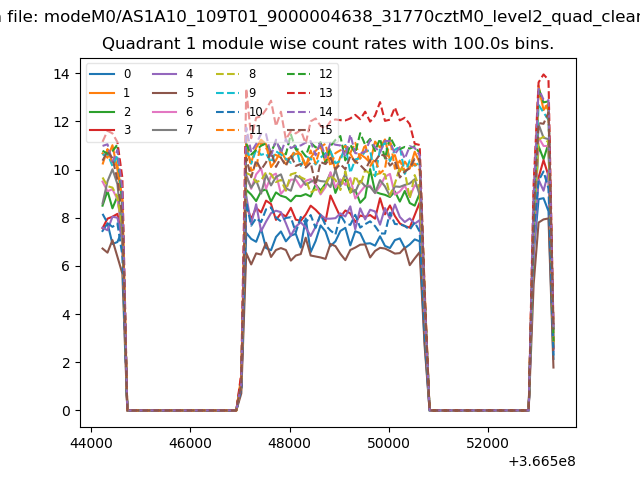 |
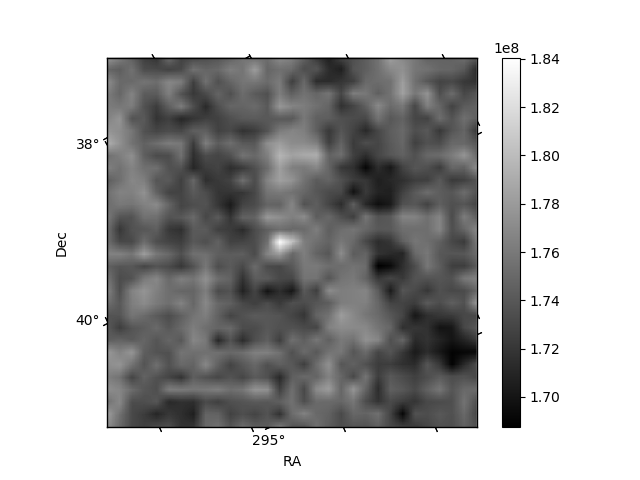 |
| Module-wise count rates for Quadrant C Data is divided into 100 sec bins |
 |
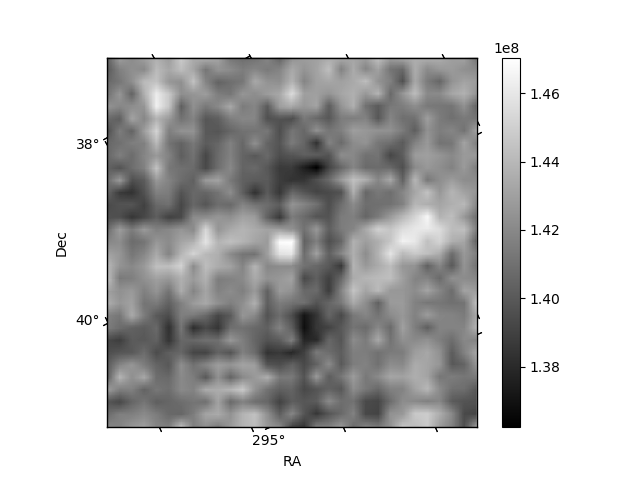 |
| Module-wise count rates for Quadrant D Data is divided into 100 sec bins |
 |
 |
| Parameter | Plot |
|---|---|
| CZT HV Monitor | 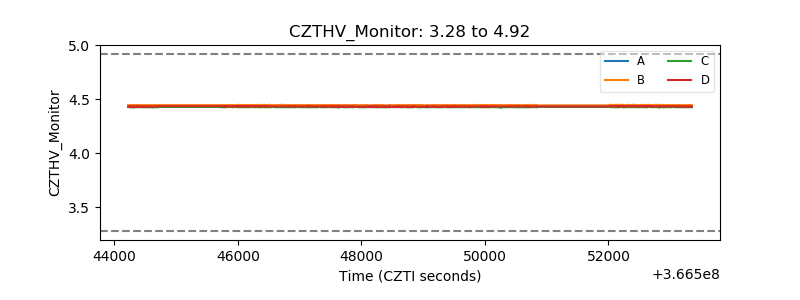 |
| D_VDD | 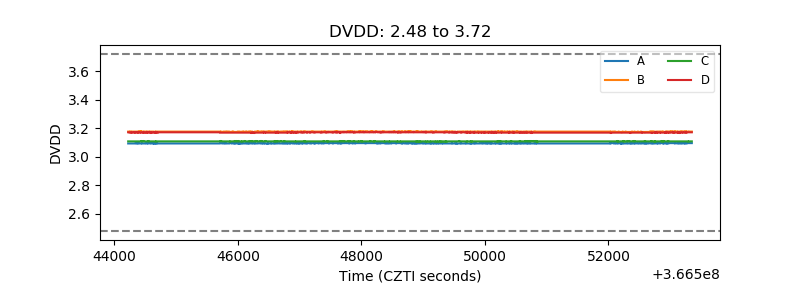 |
| Temperature 1 | 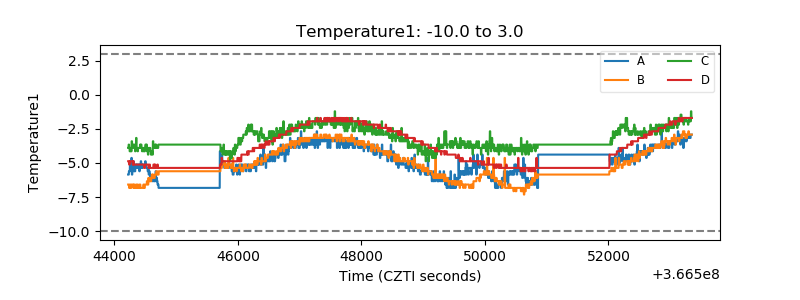 |
| Veto HV Monitor |  |
| Veto LLD | 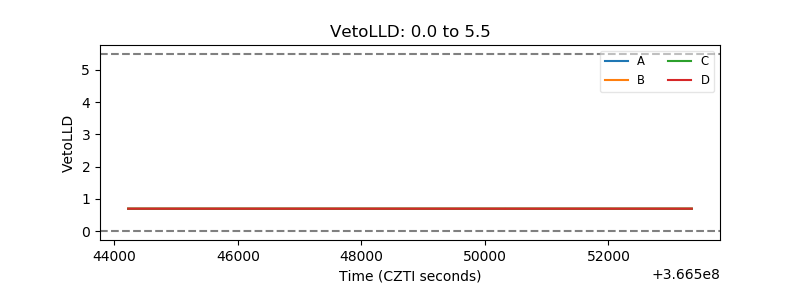 |
| Alpha Counter | 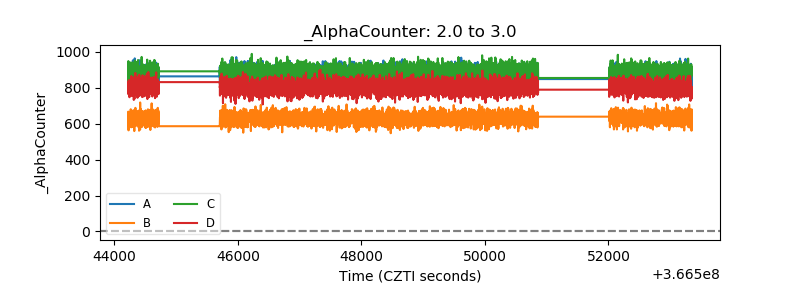 |
| _CPM_Rate | 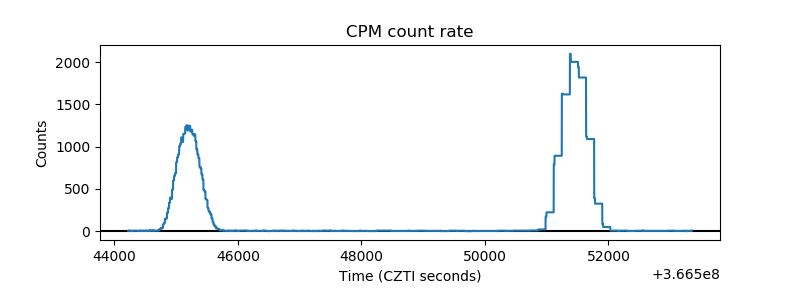 |
| CZT Counter | 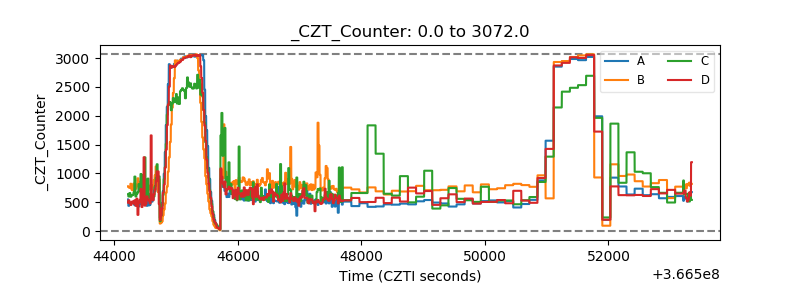 |
| +2.5 Volts monitor |  |
| +5 Volts monitor |  |
| _ROLL_ROT | 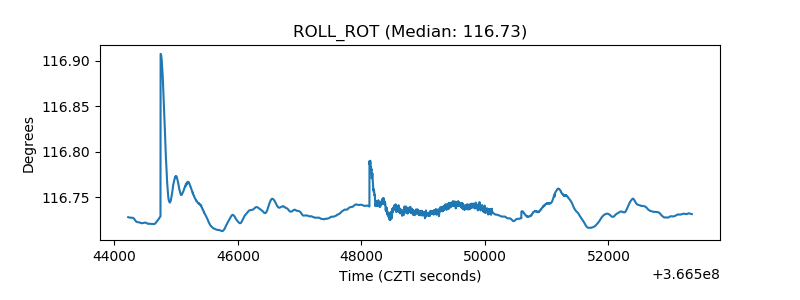 |
| _Roll_DEC | 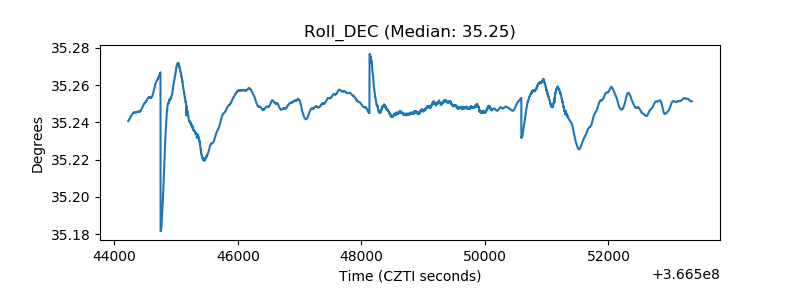 |
| _Roll_RA | 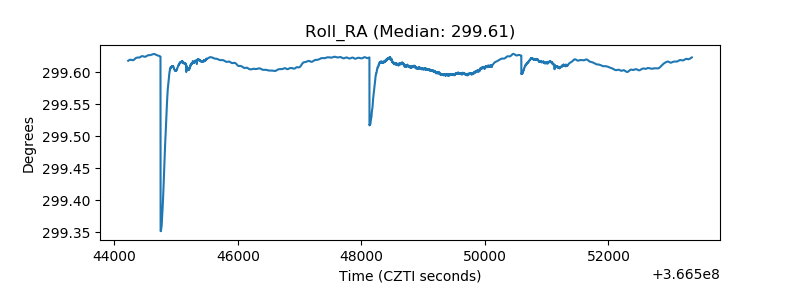 |
| Veto Counter | 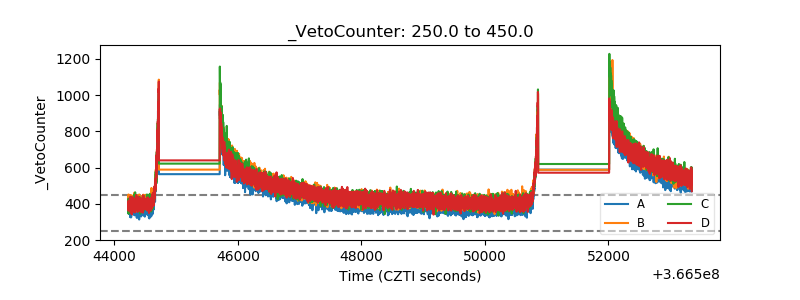 |