| Param | Original file | Final file |
|---|---|---|
| Filename | modeM0/AS1A10_109T01_9000004638_31772cztM0_level2.evt | modeM0/AS1A10_109T01_9000004638_31772cztM0_level2_quad_clean.evt |
| Size (bytes) | 594,789,120 | 129,052,800 |
| Size | 567.2 MB | 123.1 MB |
| Events in quadrant A | 3,743,522 | 896,996 |
| Events in quadrant B | 5,314,394 | 884,602 |
| Events in quadrant C | 4,652,404 | 855,071 |
| Events in quadrant D | 3,885,598 | 841,126 |
| Mode M0 | |||
|---|---|---|---|
| Quadrant | BADHDUFLAG | Total packets | Discarded packets |
| A | 0 | 15217 | 1 |
| B | 0 | 19776 | 1 |
| C | 0 | 18366 | 1 |
| D | 0 | 15681 | 1 |
| Mode M9 | |||
|---|---|---|---|
| Quadrant | BADHDUFLAG | Total packets | Discarded packets |
| A | 0 | 13 | 0 |
| B | 0 | 13 | 0 |
| C | 0 | 13 | 0 |
| D | 0 | 13 | 0 |
| Mode SS | |||
|---|---|---|---|
| Quadrant | BADHDUFLAG | Total packets | Discarded packets |
| A | 0 | 126 | 0 |
| B | 0 | 126 | 0 |
| C | 0 | 126 | 0 |
| D | 0 | 126 | 0 |
| Quadrant | Total seconds | Saturated seconds | Saturation percentage |
|---|---|---|---|
| A | 6173 | 132 | 2.138344% |
| B | 6173 | 248 | 4.017496% |
| C | 6173 | 390 | 6.317836% |
| D | 6173 | 76 | 1.231168% |
Noise dominated data is calculated using 1-second bins in cleaned event files. If a bin has >2000 counts, and if more than 50% of those come from <1% of pixels, then it is considered to be noise-dominated and hence unusable.
| Quadrant | # 1 sec bins | Bins with >0 counts | Bins with >2000 counts | High rate bins dominated by noise | Noise dominated (total time) | Noise dominated (detector-on time) | Marked lightcurve |
|---|---|---|---|---|---|---|---|
| A | 7493 | 6174 | 36 | 36 | 0.48% | 0.58% | 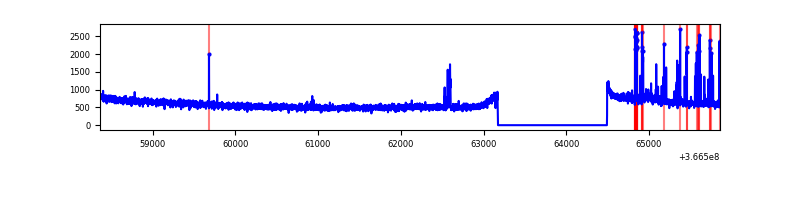 |
| B | 7493 | 6174 | 65 | 65 | 0.87% | 1.05% | 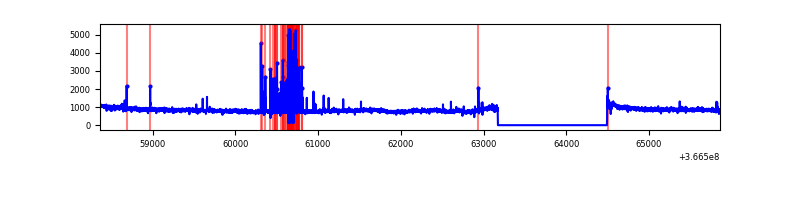 |
| C | 7493 | 6174 | 140 | 140 | 1.87% | 2.27% | 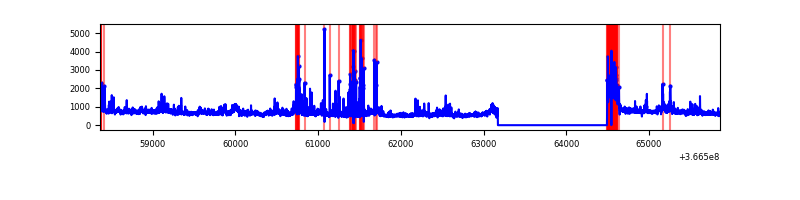 |
| D | 7493 | 6174 | 10 | 10 | 0.13% | 0.16% | 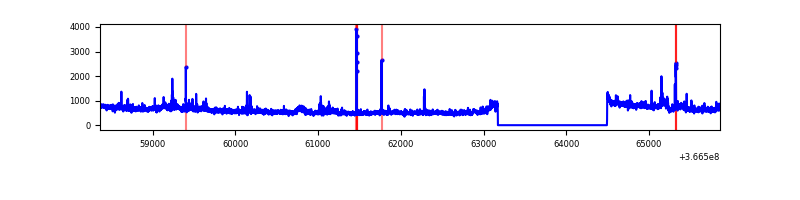 |
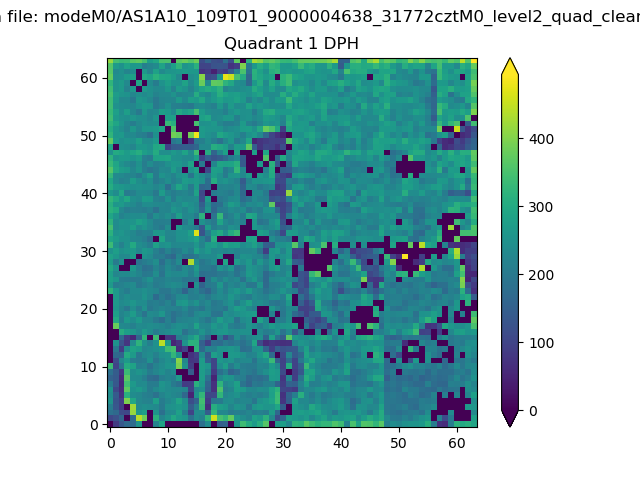
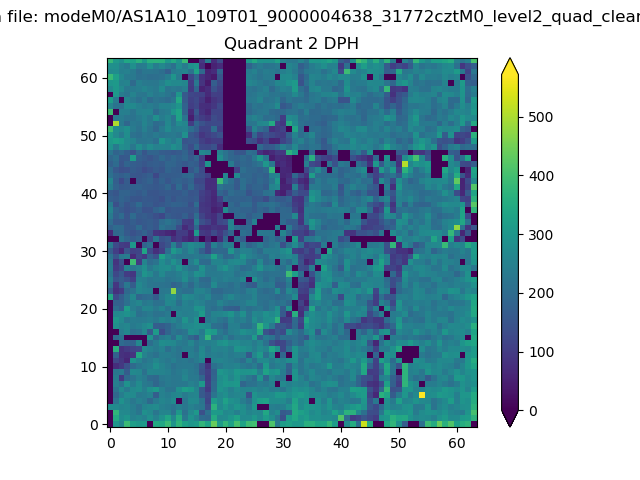
Top three noisy pixels from each quadrant. If the there are fewer than three noisy pixels in the level2.evt file, extra rows are filled as -1
| Pixel properties | Quadrant properties | ||||||
|---|---|---|---|---|---|---|---|
| Quadrant | DetID | PixID | Counts | Sigma | Mean | Median | Sigma |
| A | 0 | 13 | 172211 | 939.64 | 926 | 913 | 182.3 |
| A | 13 | 254 | 11212 | 56.49 | 926 | 913 | 182.3 |
| A | 3 | 137 | 8054 | 39.17 | 926 | 913 | 182.3 |
| B | 6 | 159 | 1548064 | 9265.65 | 896 | 878 | 167.0 |
| B | 4 | 80 | 228994 | 1366.12 | 896 | 878 | 167.0 |
| B | 12 | 111 | 18898 | 107.92 | 896 | 878 | 167.0 |
| C | 0 | 10 | 797562 | 3993.36 | 867 | 880 | 199.5 |
| C | 3 | 233 | 263557 | 1316.67 | 867 | 880 | 199.5 |
| C | 14 | 238 | 143639 | 715.58 | 867 | 880 | 199.5 |
| D | 8 | 195 | 372843 | 1752.26 | 902 | 882 | 212.3 |
| D | 2 | 250 | 56124 | 260.24 | 902 | 882 | 212.3 |
| D | 2 | 234 | 24482 | 111.18 | 902 | 882 | 212.3 |
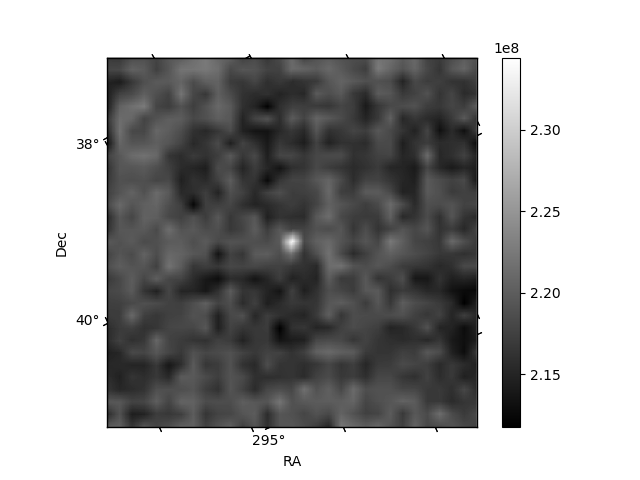
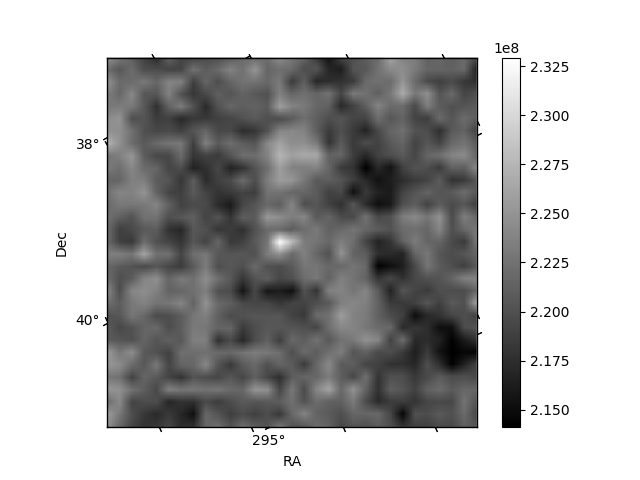
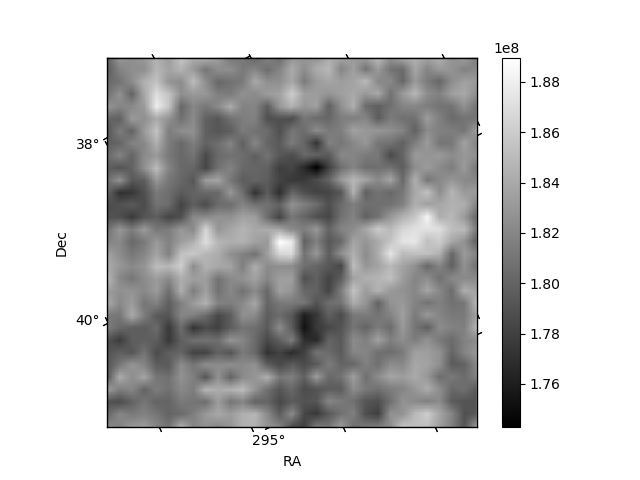
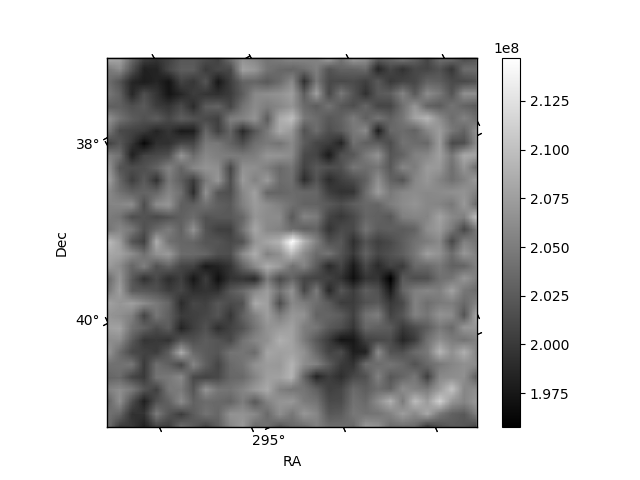
Histogram calculated using DETX and DETY for each event in the final _common_clean file
| Quadrant A | 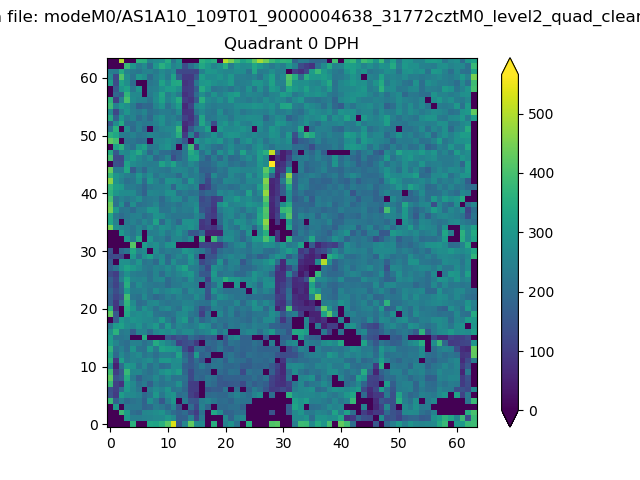 |
 |
Quadrant B |
|---|---|---|---|
| Quadrant D | 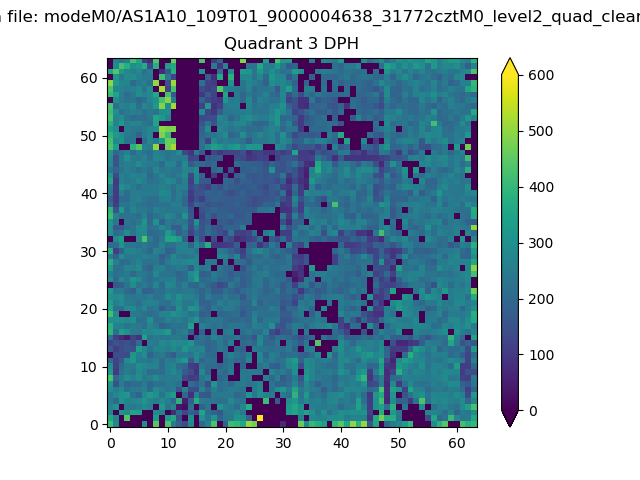 |
 |
Quadrant C |
| Plot type | Count rate plots | Images |
|---|---|---|
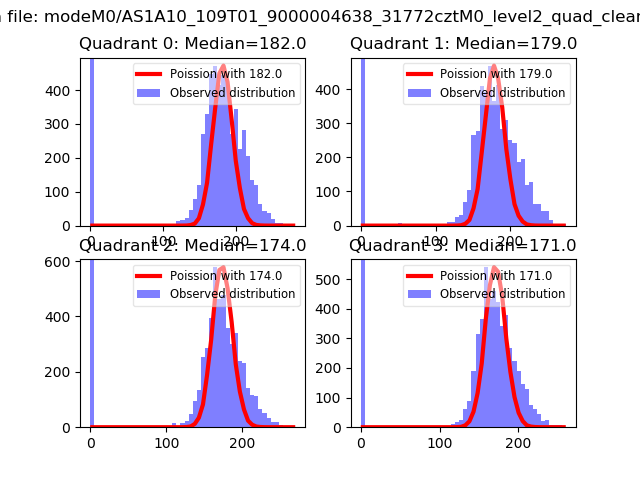
| Comparison with Poisson distribution Blue bars denote a histogram of data divided into 1 sec bins. Red curve is a Poisson curve with rate = median count rate of data. |
 |
 |
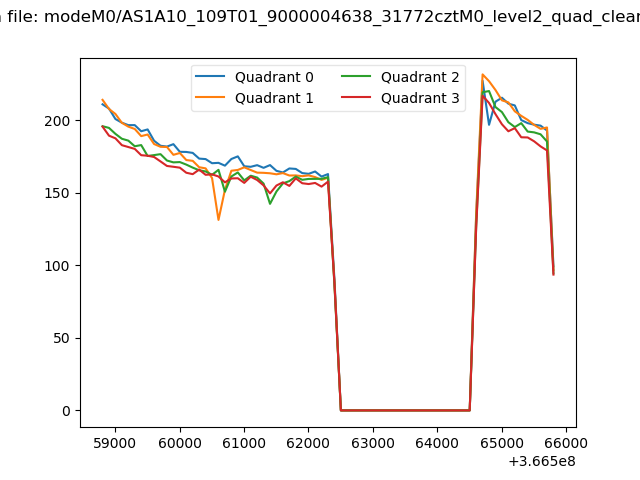
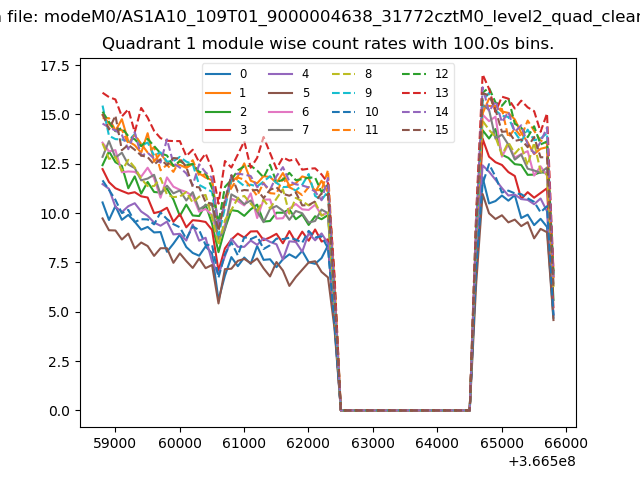
| Quadrant-wise count rates Data is divided into 100 sec bins |
 |
|
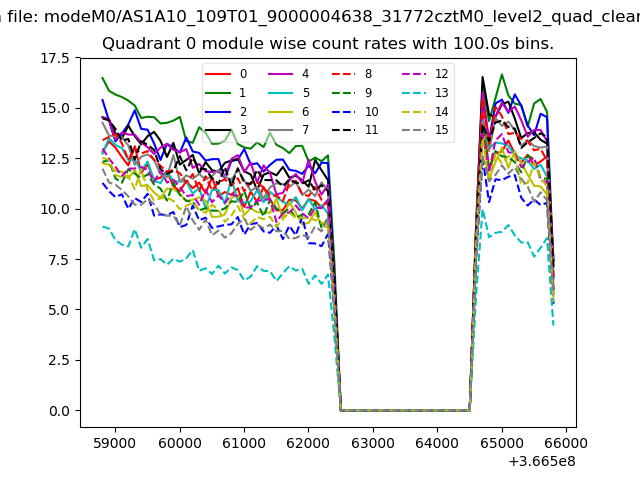
| Module-wise count rates for Quadrant A Data is divided into 100 sec bins |
 |
 |
| Module-wise count rates for Quadrant B Data is divided into 100 sec bins |
 |
 |
| Module-wise count rates for Quadrant C Data is divided into 100 sec bins |
 |
 |
| Module-wise count rates for Quadrant D Data is divided into 100 sec bins |
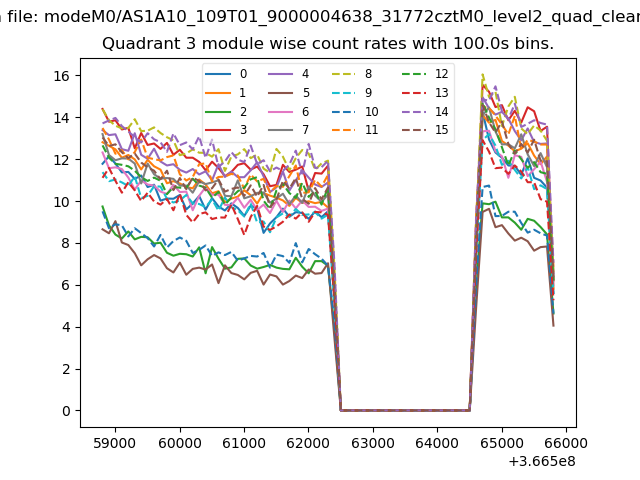 |
 |
| Parameter | Plot |
|---|---|
| CZT HV Monitor | 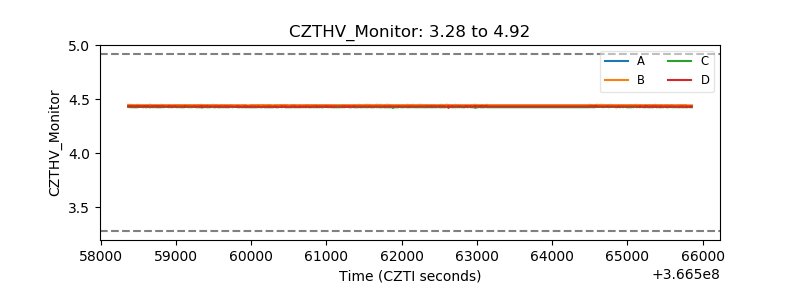 |
| D_VDD | 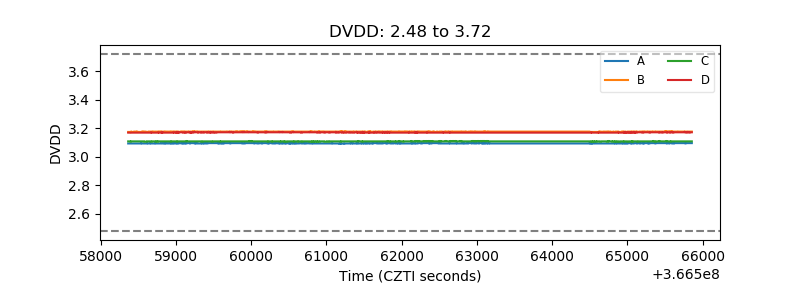 |
| Temperature 1 |  |
| Veto HV Monitor | 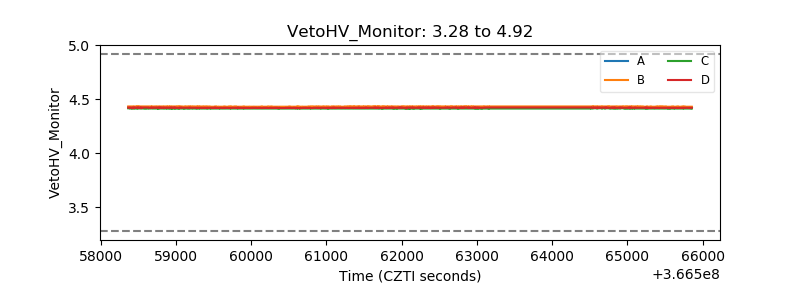 |
| Veto LLD | 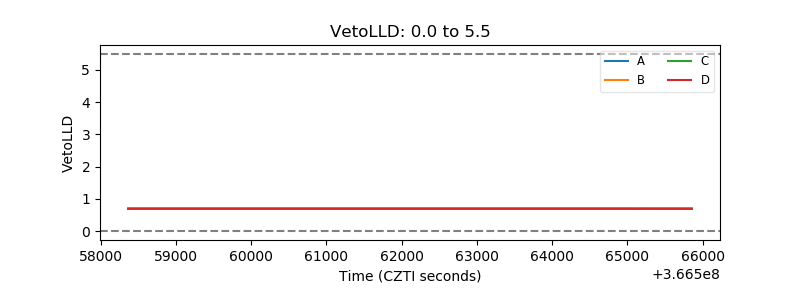 |
| Alpha Counter | 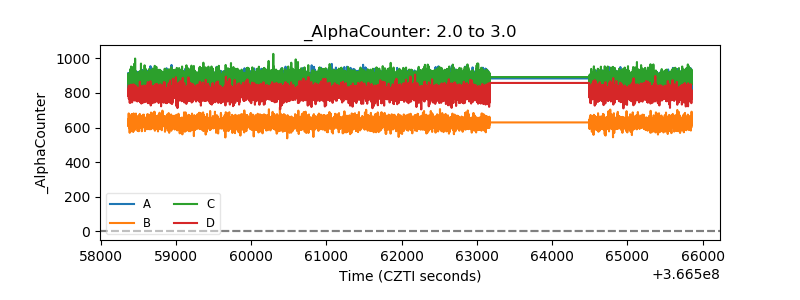 |
| _CPM_Rate | 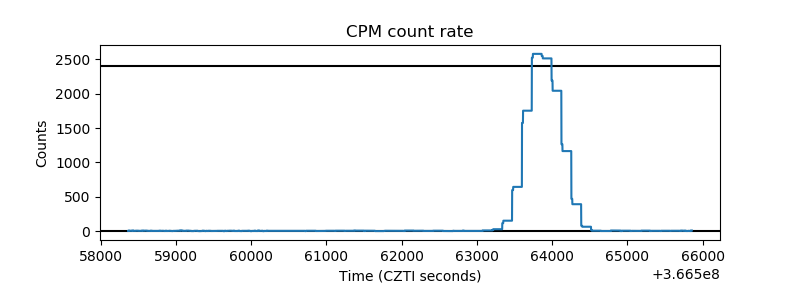 |
| CZT Counter | 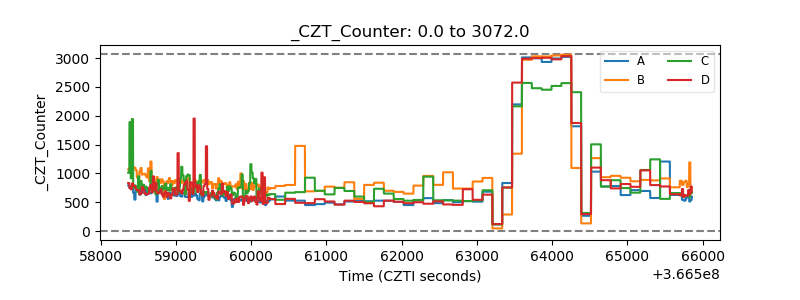 |
| +2.5 Volts monitor |  |
| +5 Volts monitor | 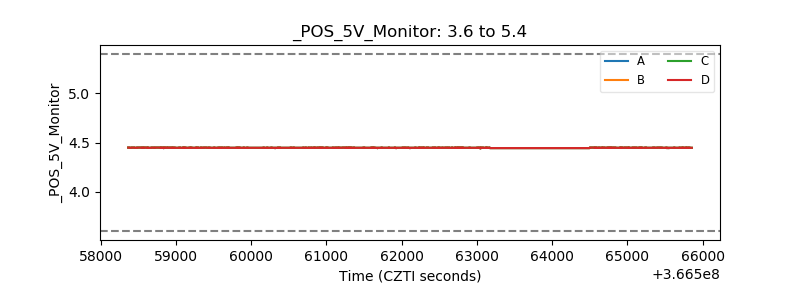 |
| _ROLL_ROT | 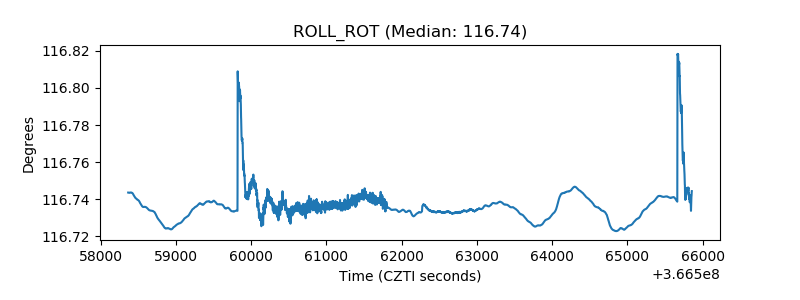 |
| _Roll_DEC | 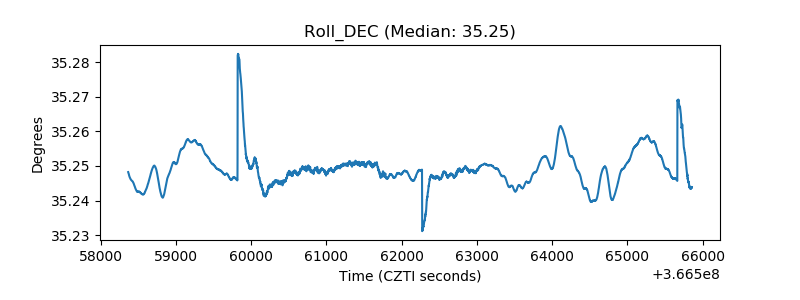 |
| _Roll_RA | 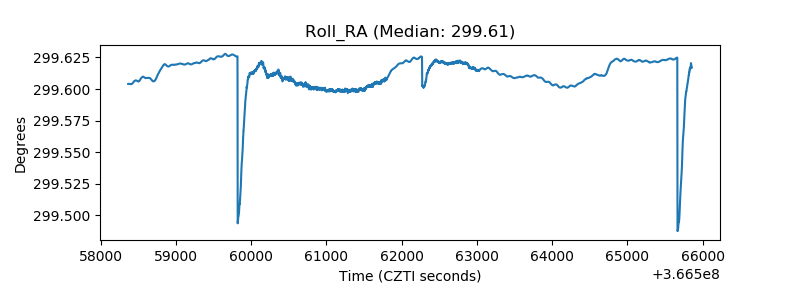 |
| Veto Counter | 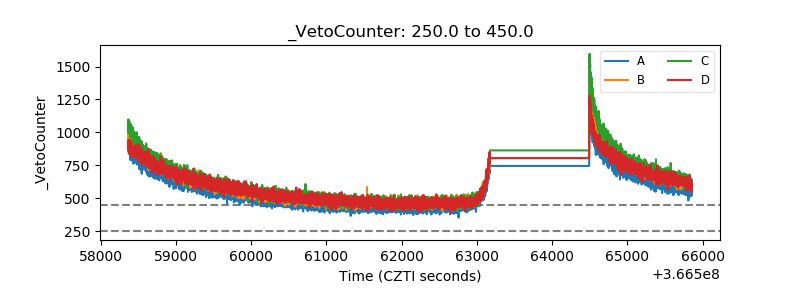 |