| Param | Original file | Final file |
|---|---|---|
| Filename | modeM0/AS1A10_109T01_9000004638_31774cztM0_level2.evt | modeM0/AS1A10_109T01_9000004638_31774cztM0_level2_quad_clean.evt |
| Size (bytes) | 575,242,560 | 119,266,560 |
| Size | 548.6 MB | 113.7 MB |
| Events in quadrant A | 3,959,514 | 799,704 |
| Events in quadrant B | 4,970,127 | 818,666 |
| Events in quadrant C | 3,634,034 | 792,409 |
| Events in quadrant D | 4,439,998 | 770,391 |
| Mode M0 | |||
|---|---|---|---|
| Quadrant | BADHDUFLAG | Total packets | Discarded packets |
| A | 0 | 15763 | 1 |
| B | 0 | 18921 | 1 |
| C | 0 | 14739 | 1 |
| D | 0 | 17396 | 3 |
| Mode M9 | |||
|---|---|---|---|
| Quadrant | BADHDUFLAG | Total packets | Discarded packets |
| A | 0 | 13 | 0 |
| B | 0 | 13 | 0 |
| C | 0 | 13 | 0 |
| D | 0 | 13 | 0 |
| Mode SS | |||
|---|---|---|---|
| Quadrant | BADHDUFLAG | Total packets | Discarded packets |
| A | 0 | 124 | 0 |
| B | 0 | 124 | 0 |
| C | 0 | 124 | 0 |
| D | 0 | 124 | 0 |
| Quadrant | Total seconds | Saturated seconds | Saturation percentage |
|---|---|---|---|
| A | 6181 | 276 | 4.465297% |
| B | 6181 | 153 | 2.475328% |
| C | 6182 | 201 | 3.251375% |
| D | 6181 | 91 | 1.472254% |
Noise dominated data is calculated using 1-second bins in cleaned event files. If a bin has >2000 counts, and if more than 50% of those come from <1% of pixels, then it is considered to be noise-dominated and hence unusable.
| Quadrant | # 1 sec bins | Bins with >0 counts | Bins with >2000 counts | High rate bins dominated by noise | Noise dominated (total time) | Noise dominated (detector-on time) | Marked lightcurve |
|---|---|---|---|---|---|---|---|
| A | 7476 | 6182 | 167 | 167 | 2.23% | 2.70% | 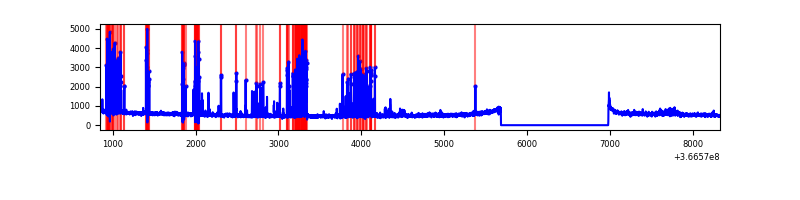 |
| B | 7476 | 6182 | 0 | 0 | 0.00% | 0.00% | 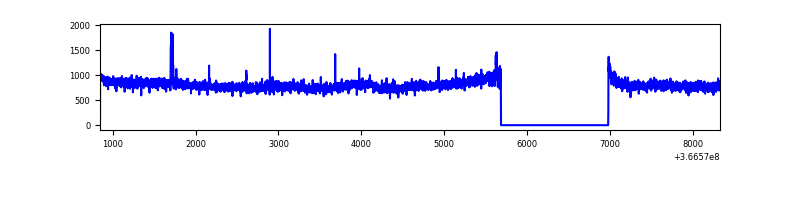 |
| C | 7477 | 6183 | 20 | 20 | 0.27% | 0.32% | 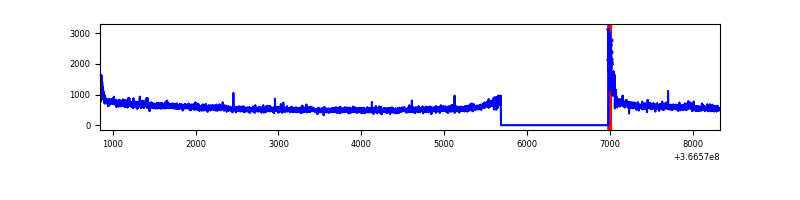 |
| D | 7476 | 6182 | 8 | 8 | 0.11% | 0.13% | 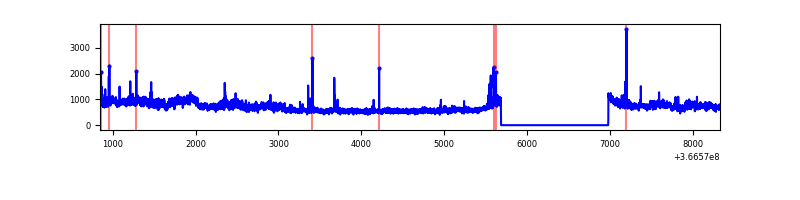 |
Top three noisy pixels from each quadrant. If the there are fewer than three noisy pixels in the level2.evt file, extra rows are filled as -1
| Pixel properties | Quadrant properties | ||||||
|---|---|---|---|---|---|---|---|
| Quadrant | DetID | PixID | Counts | Sigma | Mean | Median | Sigma |
| A | 0 | 13 | 662517 | 3913.24 | 850 | 838 | 169.1 |
| A | 14 | 238 | 22289 | 126.86 | 850 | 838 | 169.1 |
| A | 13 | 254 | 10772 | 58.75 | 850 | 838 | 169.1 |
| B | 6 | 159 | 1611614 | 10209.88 | 848 | 831 | 157.8 |
| B | 10 | 245 | 24962 | 152.95 | 848 | 831 | 157.8 |
| B | 12 | 111 | 18071 | 109.28 | 848 | 831 | 157.8 |
| C | 14 | 238 | 136073 | 694.08 | 837 | 848 | 194.8 |
| C | 0 | 10 | 131055 | 668.33 | 837 | 848 | 194.8 |
| C | 3 | 233 | 45113 | 227.2 | 837 | 848 | 194.8 |
| D | 8 | 195 | 1140590 | 5741.97 | 844 | 828 | 198.5 |
| D | 12 | 218 | 50781 | 251.66 | 844 | 828 | 198.5 |
| D | 2 | 250 | 37047 | 182.47 | 844 | 828 | 198.5 |
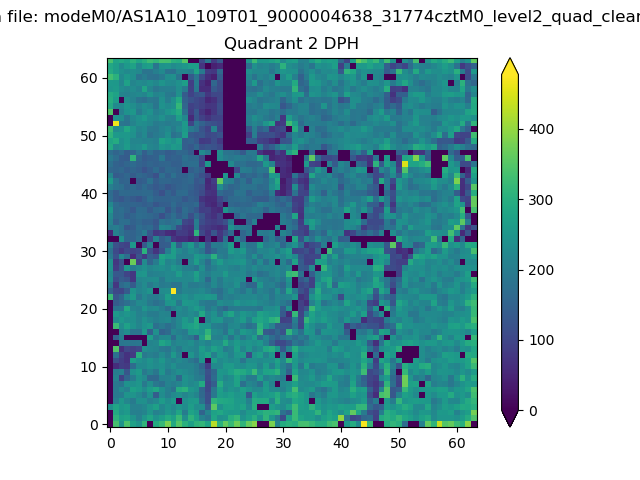
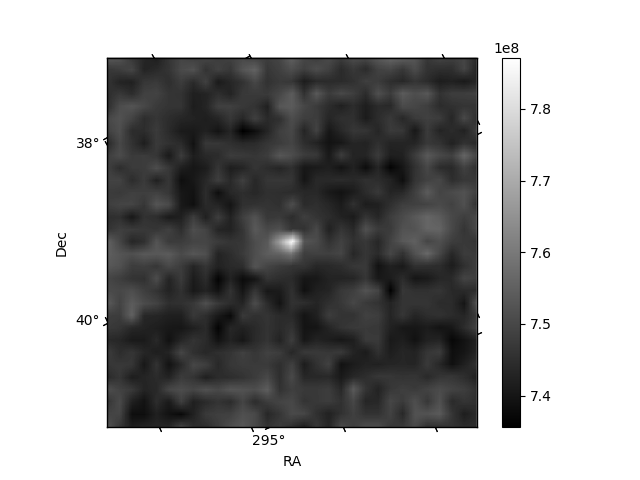
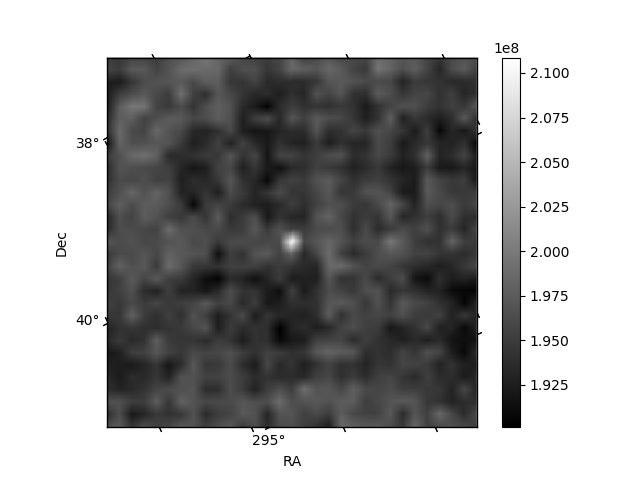
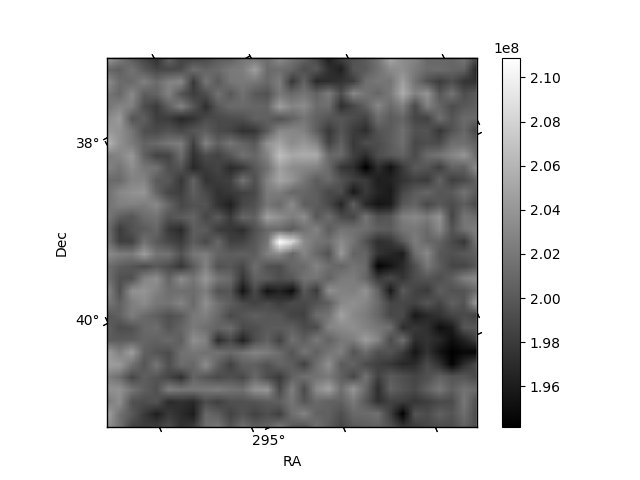
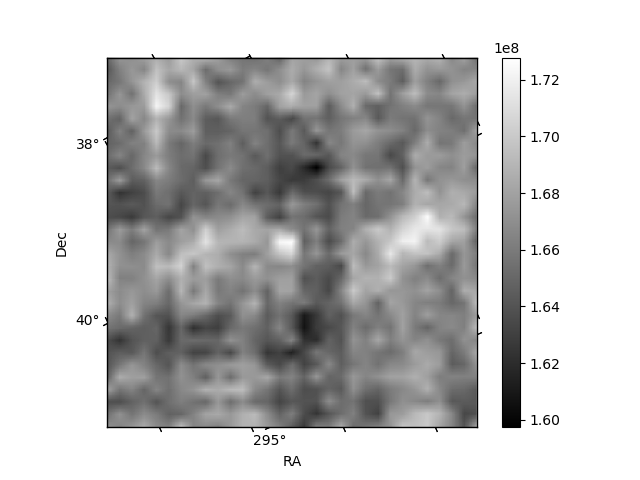
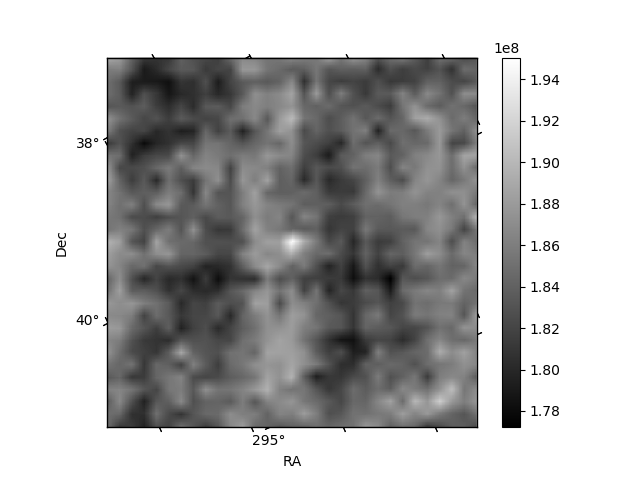
Histogram calculated using DETX and DETY for each event in the final _common_clean file
| Quadrant A | 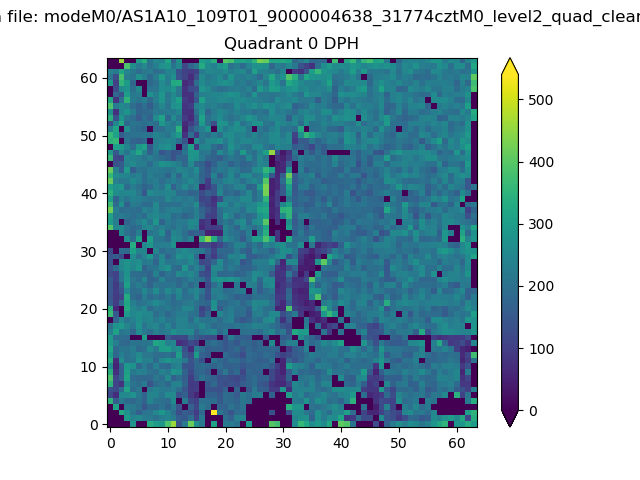 |
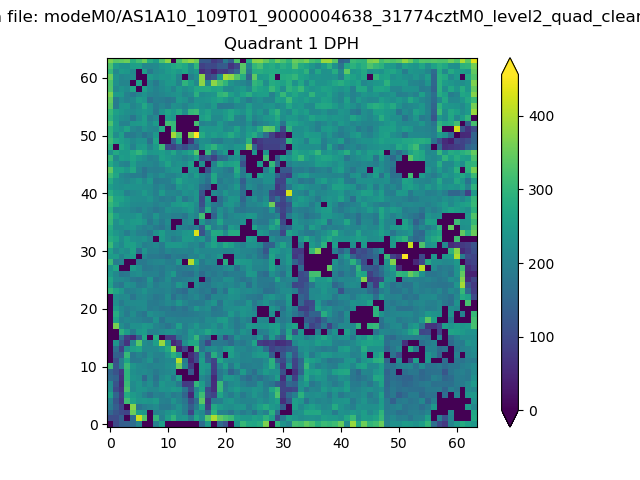 |
Quadrant B |
|---|---|---|---|
| Quadrant D | 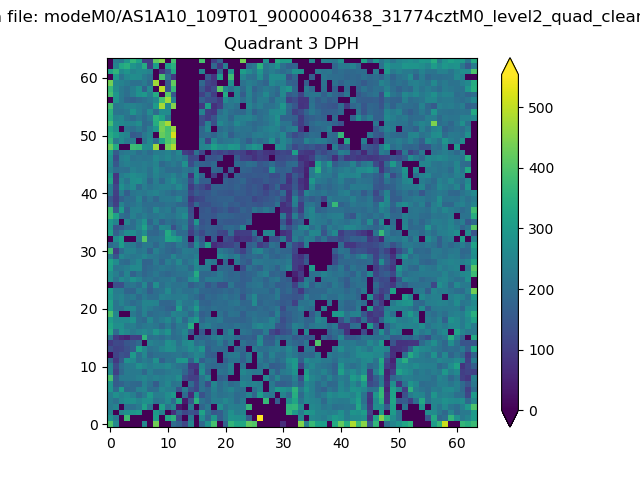 |
 |
Quadrant C |
| Plot type | Count rate plots | Images |
|---|---|---|
| Comparison with Poisson distribution Blue bars denote a histogram of data divided into 1 sec bins. Red curve is a Poisson curve with rate = median count rate of data. |
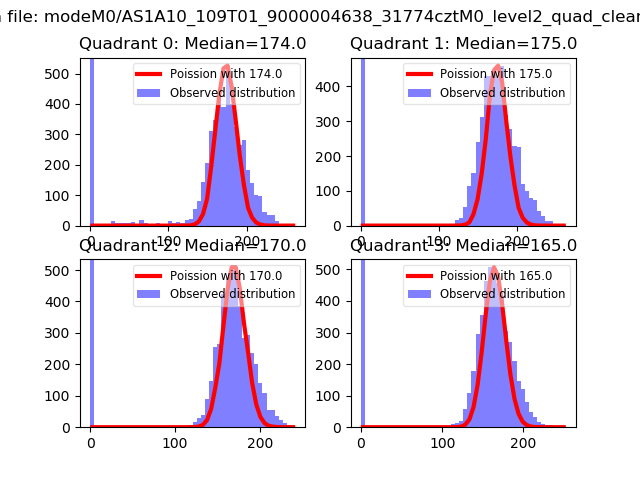 |
 |
| Quadrant-wise count rates Data is divided into 100 sec bins |
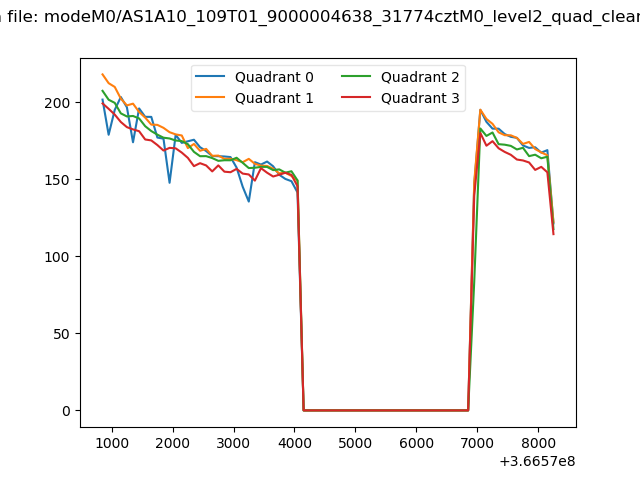 |
|
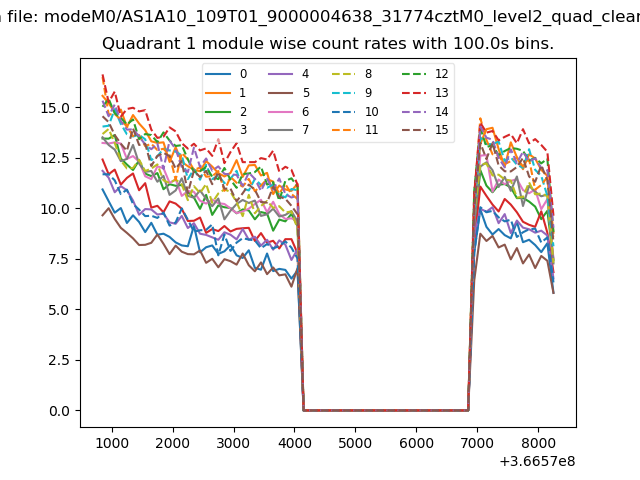
| Module-wise count rates for Quadrant A Data is divided into 100 sec bins |
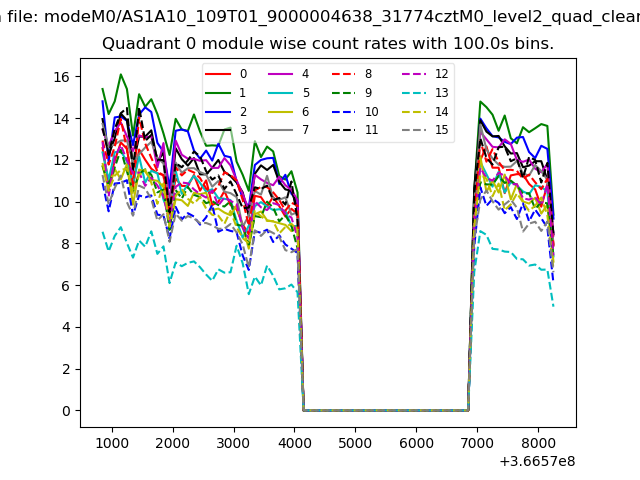 |
 |
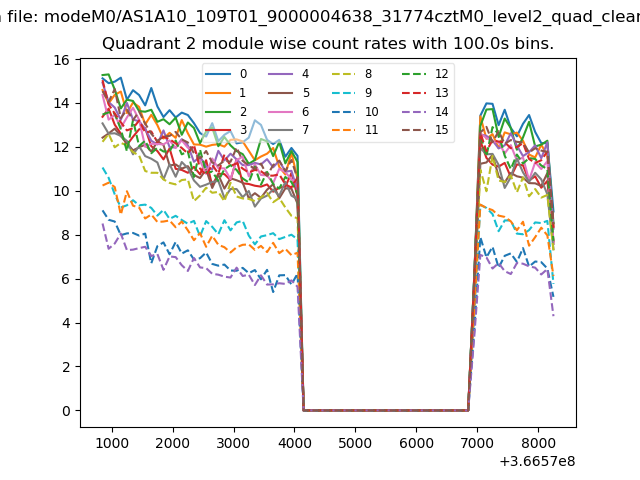
| Module-wise count rates for Quadrant B Data is divided into 100 sec bins |
 |
 |
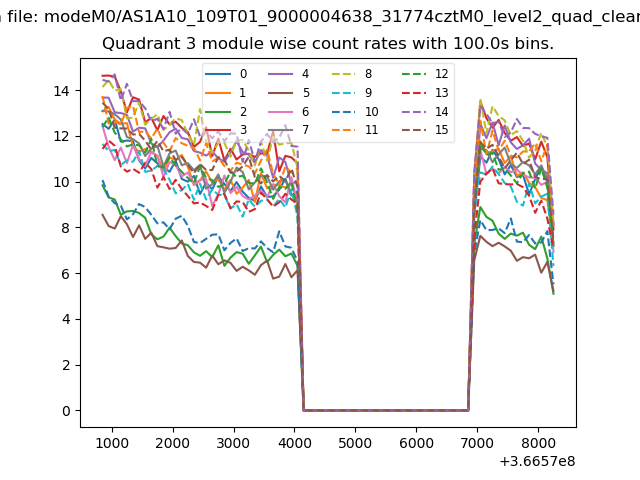
| Module-wise count rates for Quadrant C Data is divided into 100 sec bins |
 |
 |
| Module-wise count rates for Quadrant D Data is divided into 100 sec bins |
 |
 |
| Parameter | Plot |
|---|---|
| CZT HV Monitor | 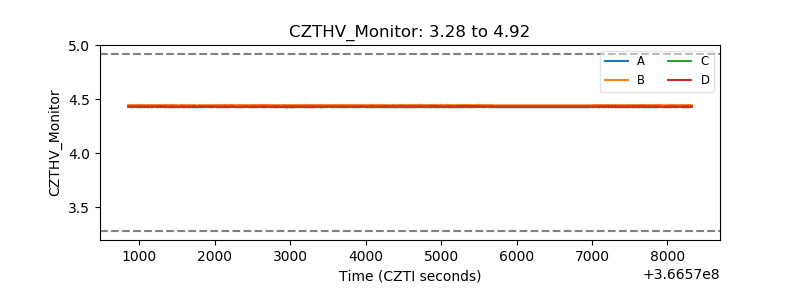 |
| D_VDD | 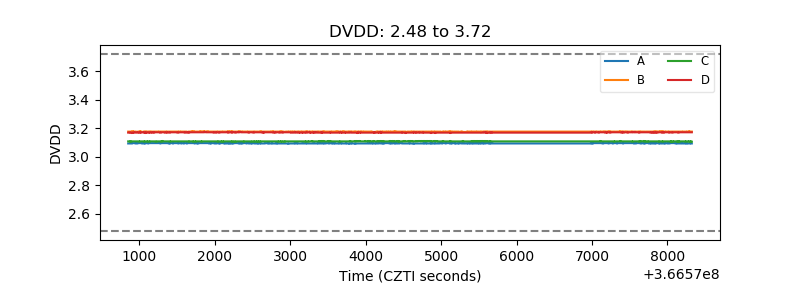 |
| Temperature 1 |  |
| Veto HV Monitor | 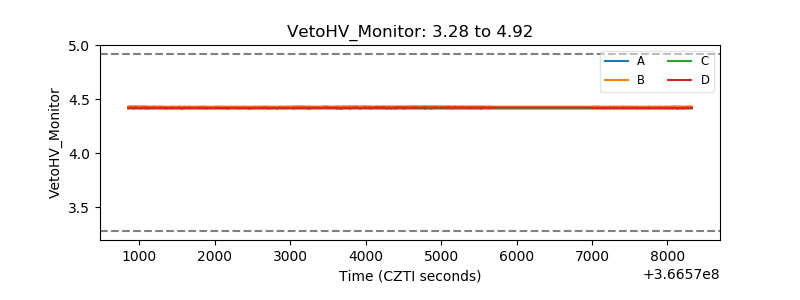 |
| Veto LLD |  |
| Alpha Counter | 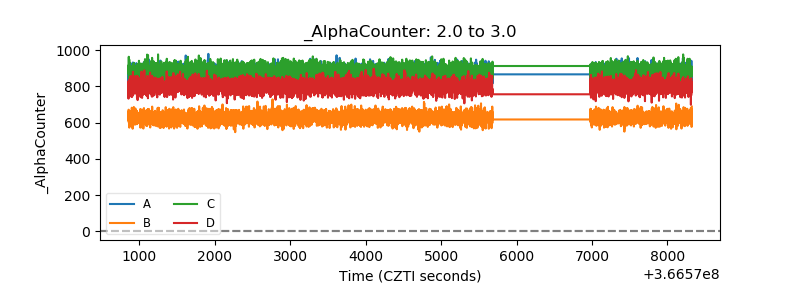 |
| _CPM_Rate |  |
| CZT Counter | 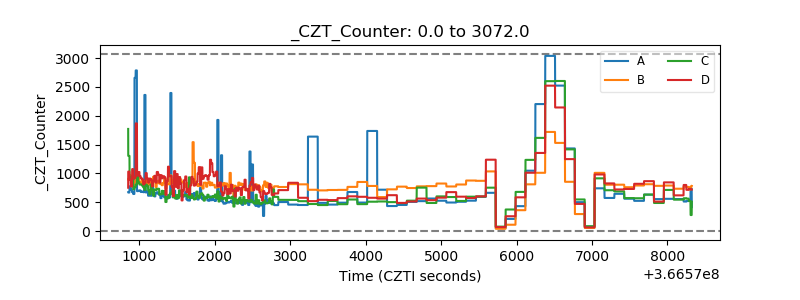 |
| +2.5 Volts monitor |  |
| +5 Volts monitor |  |
| _ROLL_ROT | 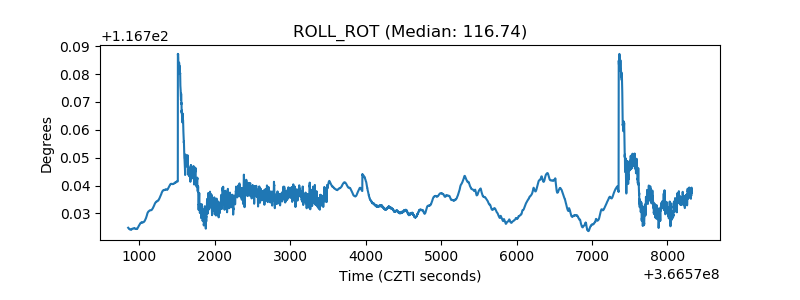 |
| _Roll_DEC | 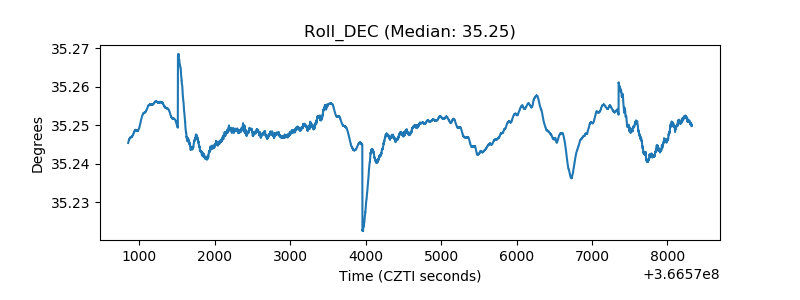 |
| _Roll_RA | 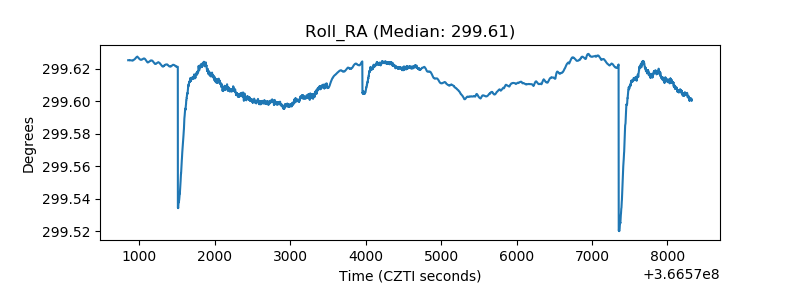 |
| Veto Counter | 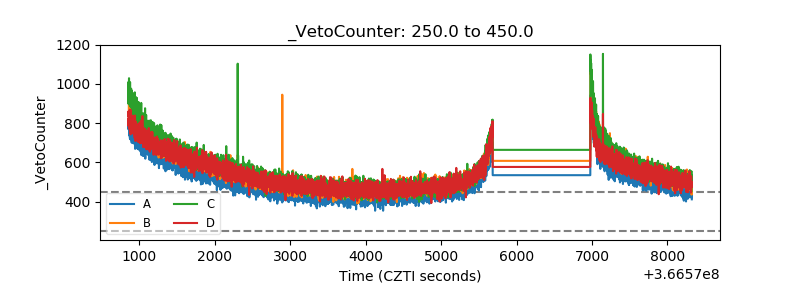 |