| Param | Original file | Final file |
|---|---|---|
| Filename | modeM0/AS1A10_109T01_9000004638_31775cztM0_level2.evt | modeM0/AS1A10_109T01_9000004638_31775cztM0_level2_quad_clean.evt |
| Size (bytes) | 579,548,160 | 108,570,240 |
| Size | 552.7 MB | 103.5 MB |
| Events in quadrant A | 3,766,457 | 725,613 |
| Events in quadrant B | 5,196,664 | 726,687 |
| Events in quadrant C | 3,726,223 | 695,655 |
| Events in quadrant D | 4,416,021 | 680,301 |
| Mode M0 | |||
|---|---|---|---|
| Quadrant | BADHDUFLAG | Total packets | Discarded packets |
| A | 0 | 15506 | 3 |
| B | 0 | 20088 | 3 |
| C | 0 | 15167 | 3 |
| D | 0 | 17617 | 3 |
| Mode M9 | |||
|---|---|---|---|
| Quadrant | BADHDUFLAG | Total packets | Discarded packets |
| A | 0 | 15 | 0 |
| B | 0 | 16 | 0 |
| C | 0 | 16 | 0 |
| D | 0 | 16 | 0 |
| Mode SS | |||
|---|---|---|---|
| Quadrant | BADHDUFLAG | Total packets | Discarded packets |
| A | 0 | 134 | 0 |
| B | 0 | 134 | 0 |
| C | 0 | 134 | 0 |
| D | 0 | 134 | 0 |
| Quadrant | Total seconds | Saturated seconds | Saturation percentage |
|---|---|---|---|
| A | 6594 | 148 | 2.244465% |
| B | 6594 | 147 | 2.229299% |
| C | 6594 | 253 | 3.836821% |
| D | 6594 | 114 | 1.728844% |
Noise dominated data is calculated using 1-second bins in cleaned event files. If a bin has >2000 counts, and if more than 50% of those come from <1% of pixels, then it is considered to be noise-dominated and hence unusable.
| Quadrant | # 1 sec bins | Bins with >0 counts | Bins with >2000 counts | High rate bins dominated by noise | Noise dominated (total time) | Noise dominated (detector-on time) | Marked lightcurve |
|---|---|---|---|---|---|---|---|
| A | 7639 | 6596 | 16 | 16 | 0.21% | 0.24% | 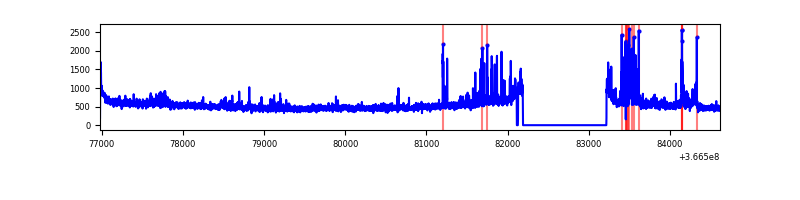 |
| B | 7639 | 6596 | 0 | 0 | 0.00% | 0.00% | 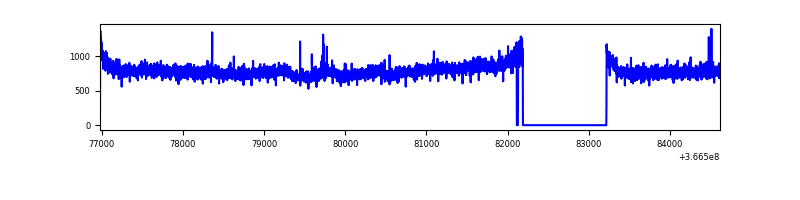 |
| C | 7639 | 6596 | 31 | 31 | 0.41% | 0.47% | 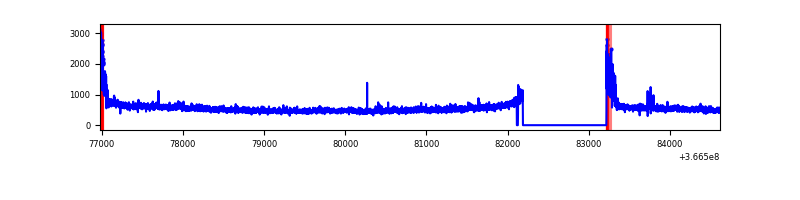 |
| D | 7639 | 6596 | 39 | 39 | 0.51% | 0.59% | 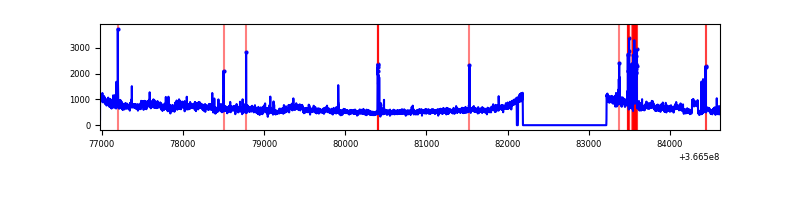 |
Top three noisy pixels from each quadrant. If the there are fewer than three noisy pixels in the level2.evt file, extra rows are filled as -1
| Pixel properties | Quadrant properties | ||||||
|---|---|---|---|---|---|---|---|
| Quadrant | DetID | PixID | Counts | Sigma | Mean | Median | Sigma |
| A | 0 | 13 | 346532 | 1963.83 | 878 | 864 | 176.0 |
| A | 14 | 238 | 34854 | 193.11 | 878 | 864 | 176.0 |
| A | 13 | 254 | 11156 | 58.47 | 878 | 864 | 176.0 |
| B | 6 | 159 | 1774154 | 10840.53 | 866 | 847 | 163.6 |
| B | 12 | 111 | 19593 | 114.6 | 866 | 847 | 163.6 |
| B | 11 | 111 | 18085 | 105.38 | 866 | 847 | 163.6 |
| C | 0 | 10 | 208926 | 1047.76 | 847 | 856 | 198.6 |
| C | 14 | 238 | 140042 | 700.88 | 847 | 856 | 198.6 |
| C | 4 | 175 | 26126 | 127.25 | 847 | 856 | 198.6 |
| D | 8 | 195 | 994405 | 4882.3 | 858 | 838 | 203.5 |
| D | 12 | 218 | 120530 | 588.16 | 858 | 838 | 203.5 |
| D | 2 | 250 | 30707 | 146.77 | 858 | 838 | 203.5 |
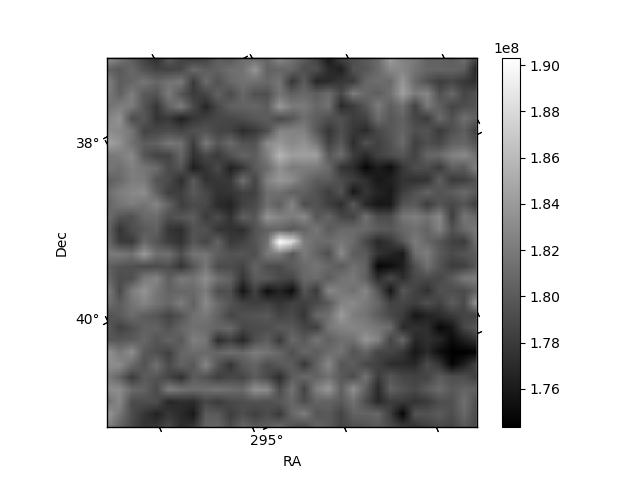
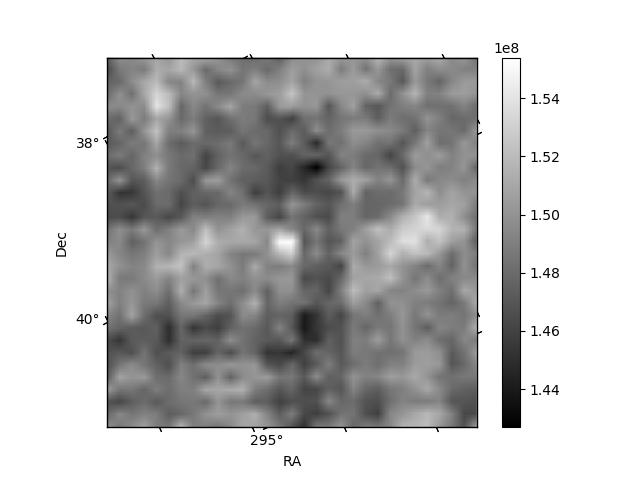
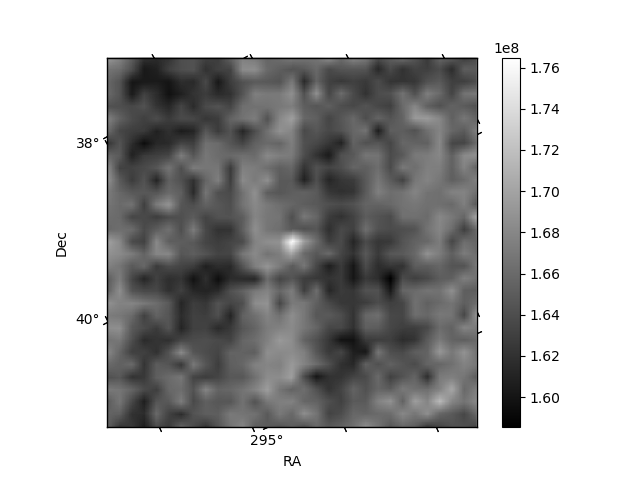
Histogram calculated using DETX and DETY for each event in the final _common_clean file
| Quadrant A | 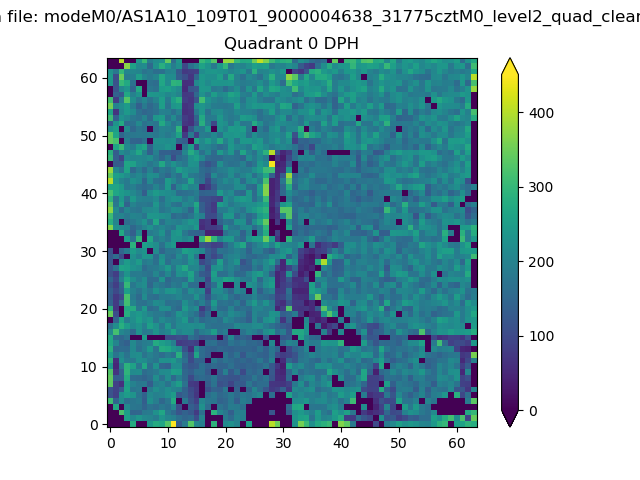 |
 |
Quadrant B |
|---|---|---|---|
| Quadrant D | 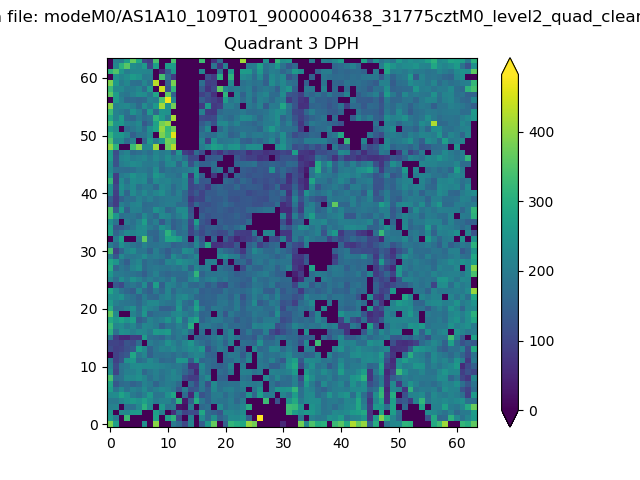 |
 |
Quadrant C |
| Plot type | Count rate plots | Images |
|---|---|---|
| Comparison with Poisson distribution Blue bars denote a histogram of data divided into 1 sec bins. Red curve is a Poisson curve with rate = median count rate of data. |
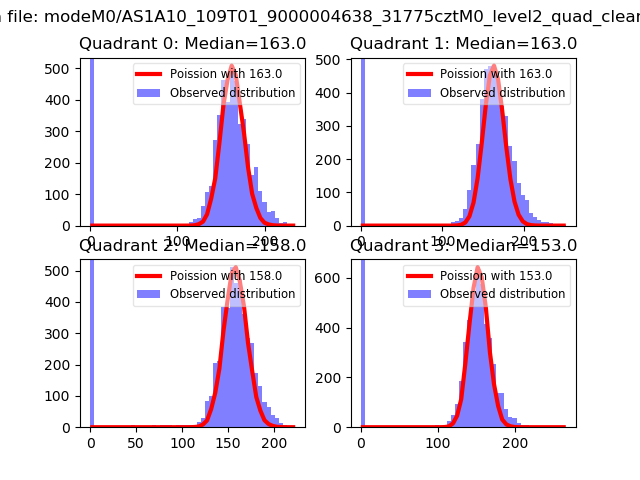 |
 |
| Quadrant-wise count rates Data is divided into 100 sec bins |
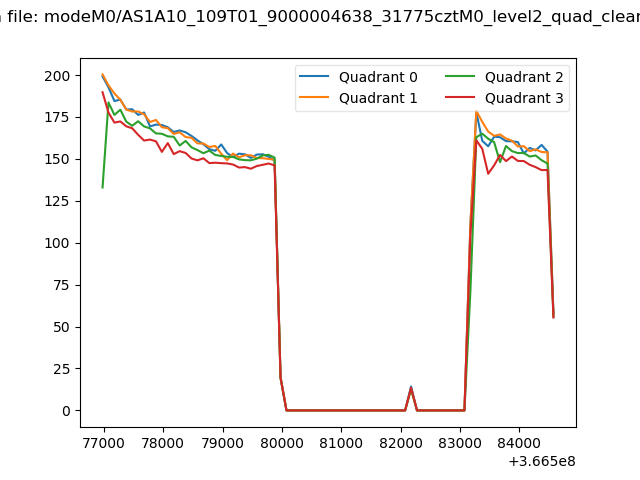 |
|
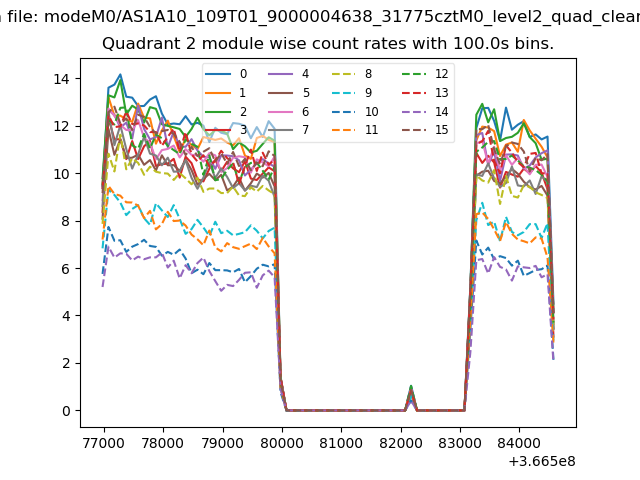
| Module-wise count rates for Quadrant A Data is divided into 100 sec bins |
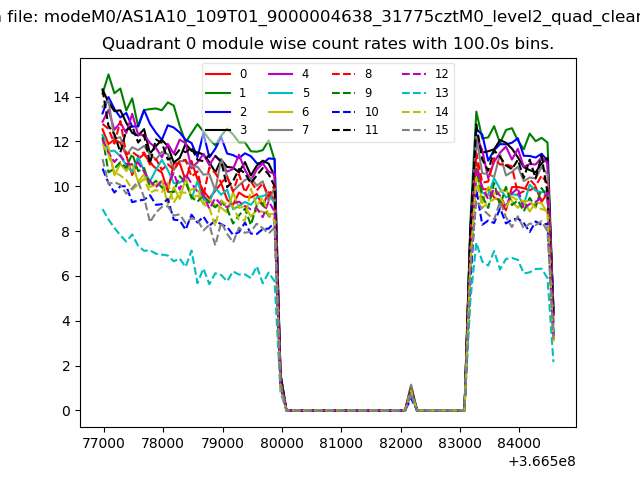 |
 |
| Module-wise count rates for Quadrant B Data is divided into 100 sec bins |
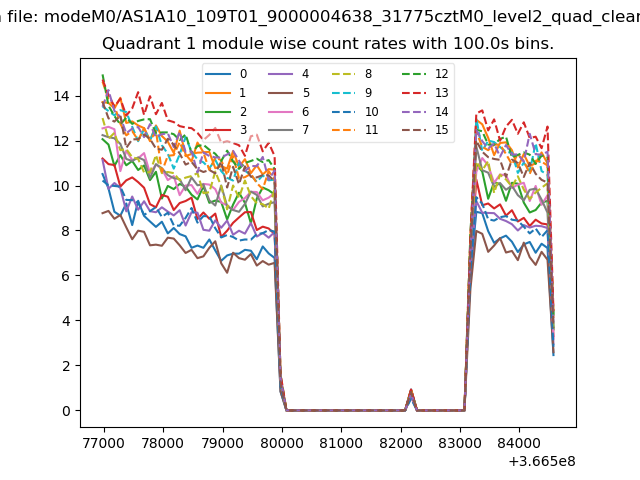 |
 |
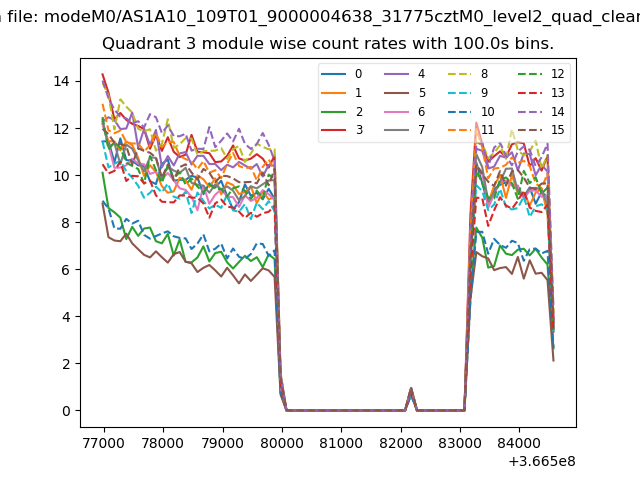
| Module-wise count rates for Quadrant C Data is divided into 100 sec bins |
 |
 |
| Module-wise count rates for Quadrant D Data is divided into 100 sec bins |
 |
 |
| Parameter | Plot |
|---|---|
| CZT HV Monitor | 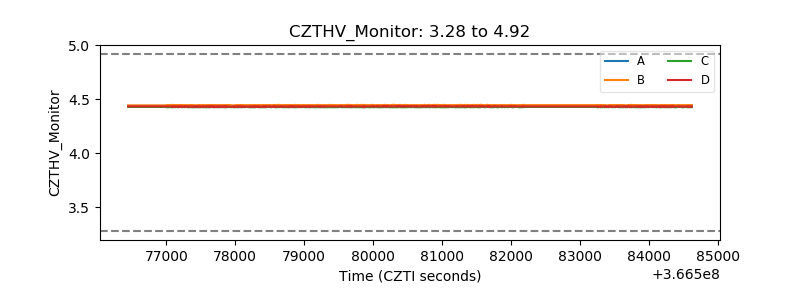 |
| D_VDD | 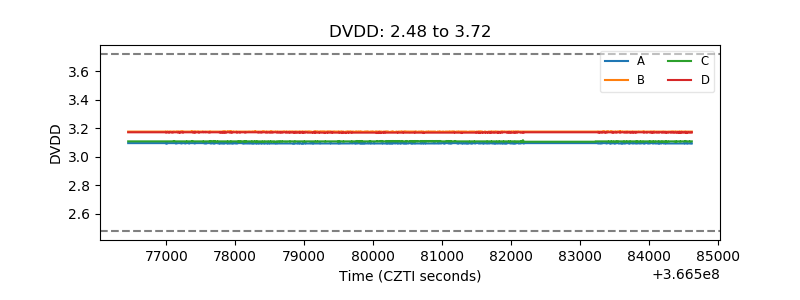 |
| Temperature 1 | 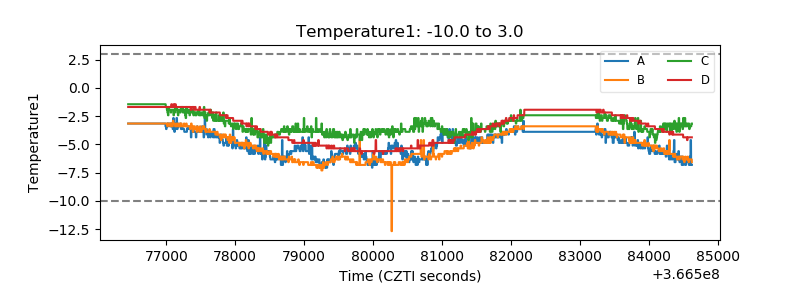 |
| Veto HV Monitor | 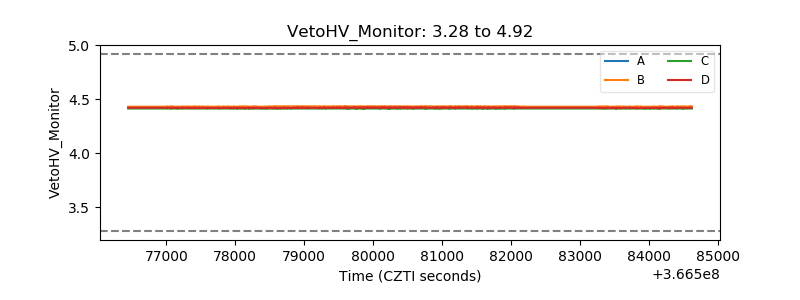 |
| Veto LLD |  |
| Alpha Counter | 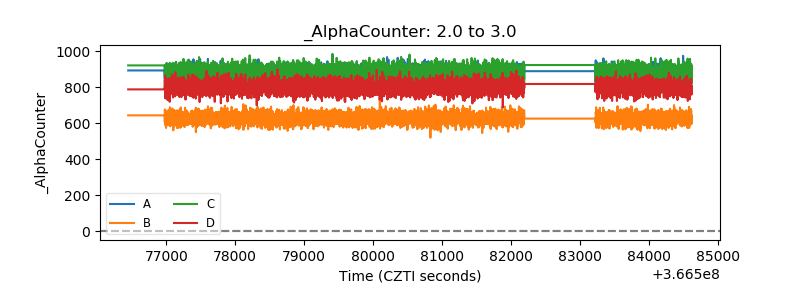 |
| _CPM_Rate | 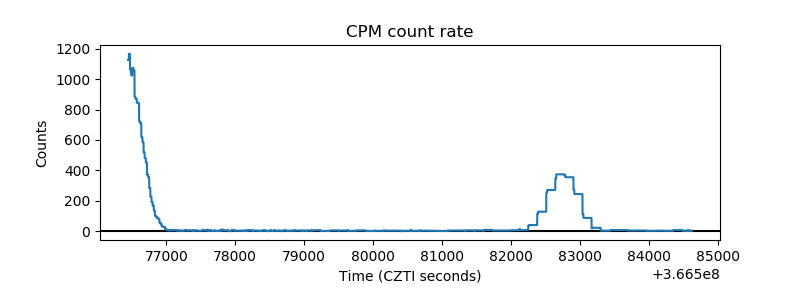 |
| CZT Counter | 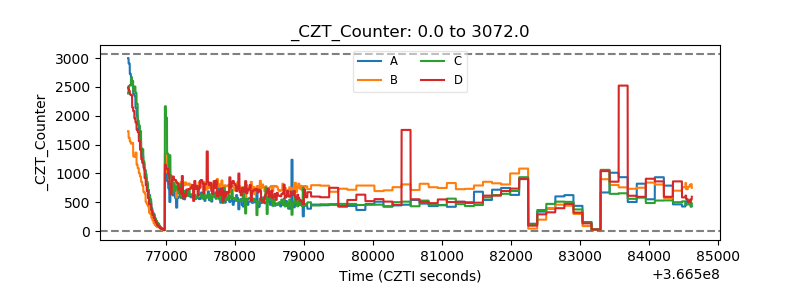 |
| +2.5 Volts monitor |  |
| +5 Volts monitor |  |
| _ROLL_ROT | 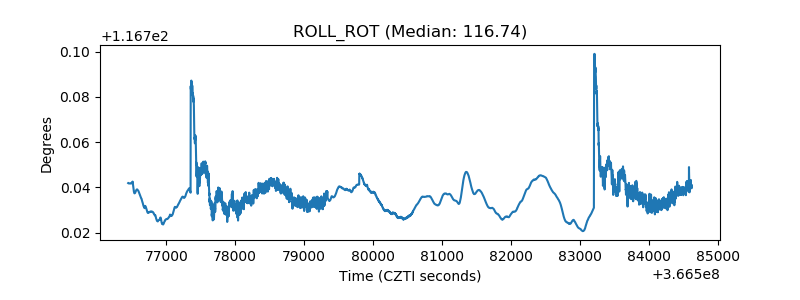 |
| _Roll_DEC | 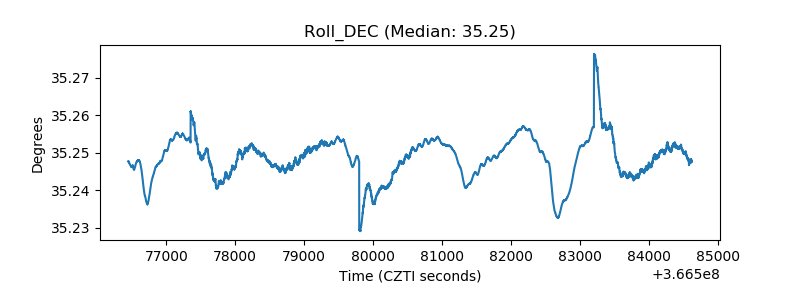 |
| _Roll_RA | 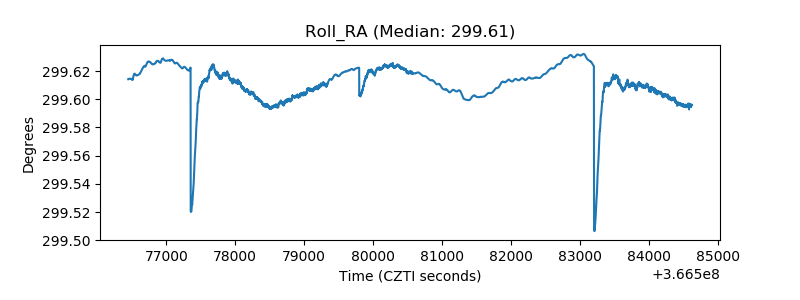 |
| Veto Counter | 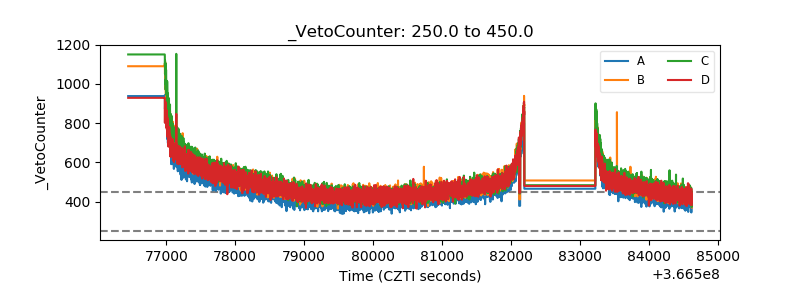 |