| Param | Original file | Final file |
|---|---|---|
| Filename | modeM0/AS1A10_109T01_9000004638_31776cztM0_level2.evt | modeM0/AS1A10_109T01_9000004638_31776cztM0_level2_quad_clean.evt |
| Size (bytes) | 580,985,280 | 107,608,320 |
| Size | 554.1 MB | 102.6 MB |
| Events in quadrant A | 3,860,897 | 709,820 |
| Events in quadrant B | 5,313,311 | 711,949 |
| Events in quadrant C | 3,589,823 | 689,276 |
| Events in quadrant D | 4,367,930 | 671,073 |
| Mode M0 | |||
|---|---|---|---|
| Quadrant | BADHDUFLAG | Total packets | Discarded packets |
| A | 0 | 15905 | 1 |
| B | 0 | 20696 | 1 |
| C | 0 | 14802 | 1 |
| D | 0 | 17708 | 1 |
| Mode M9 | |||
|---|---|---|---|
| Quadrant | BADHDUFLAG | Total packets | Discarded packets |
| A | 0 | 7 | 0 |
| B | 0 | 7 | 0 |
| C | 0 | 7 | 0 |
| D | 0 | 7 | 0 |
| Mode SS | |||
|---|---|---|---|
| Quadrant | BADHDUFLAG | Total packets | Discarded packets |
| A | 0 | 138 | 0 |
| B | 0 | 138 | 0 |
| C | 0 | 138 | 0 |
| D | 0 | 138 | 0 |
| Quadrant | Total seconds | Saturated seconds | Saturation percentage |
|---|---|---|---|
| A | 6846 | 147 | 2.147239% |
| B | 6846 | 106 | 1.548349% |
| C | 6847 | 158 | 2.307580% |
| D | 6847 | 70 | 1.022346% |
Noise dominated data is calculated using 1-second bins in cleaned event files. If a bin has >2000 counts, and if more than 50% of those come from <1% of pixels, then it is considered to be noise-dominated and hence unusable.
| Quadrant | # 1 sec bins | Bins with >0 counts | Bins with >2000 counts | High rate bins dominated by noise | Noise dominated (total time) | Noise dominated (detector-on time) | Marked lightcurve |
|---|---|---|---|---|---|---|---|
| A | 7506 | 6847 | 61 | 61 | 0.81% | 0.89% | 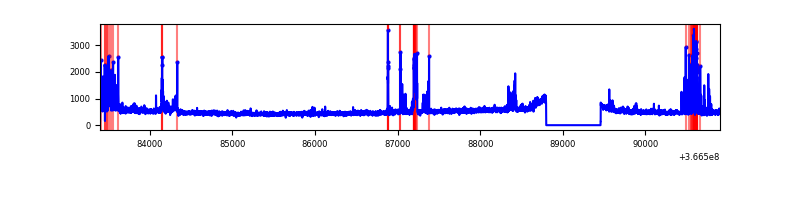 |
| B | 7506 | 6847 | 0 | 0 | 0.00% | 0.00% | 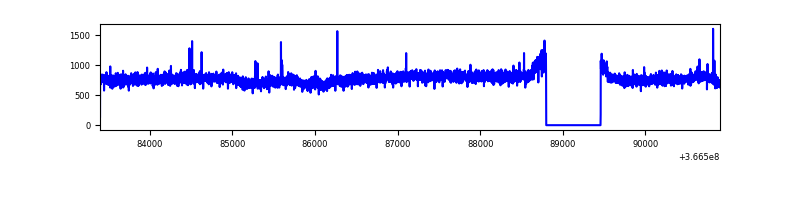 |
| C | 7507 | 6848 | 10 | 10 | 0.13% | 0.15% | 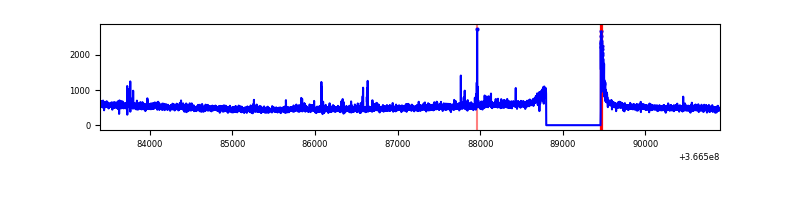 |
| D | 7507 | 6848 | 34 | 34 | 0.45% | 0.50% | 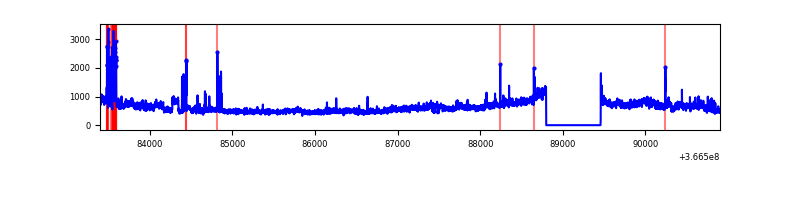 |
Top three noisy pixels from each quadrant. If the there are fewer than three noisy pixels in the level2.evt file, extra rows are filled as -1
| Pixel properties | Quadrant properties | ||||||
|---|---|---|---|---|---|---|---|
| Quadrant | DetID | PixID | Counts | Sigma | Mean | Median | Sigma |
| A | 0 | 13 | 510495 | 2929.96 | 864 | 850 | 173.9 |
| A | 14 | 238 | 17489 | 95.66 | 864 | 850 | 173.9 |
| A | 13 | 254 | 11253 | 59.81 | 864 | 850 | 173.9 |
| B | 6 | 159 | 1904361 | 11510.87 | 858 | 837 | 165.4 |
| B | 12 | 111 | 20119 | 116.6 | 858 | 837 | 165.4 |
| B | 11 | 111 | 18374 | 106.05 | 858 | 837 | 165.4 |
| C | 14 | 238 | 140853 | 711.21 | 839 | 847 | 196.9 |
| C | 0 | 10 | 98757 | 497.37 | 839 | 847 | 196.9 |
| C | 3 | 233 | 41640 | 207.22 | 839 | 847 | 196.9 |
| D | 8 | 195 | 917430 | 4533.41 | 843 | 825 | 202.2 |
| D | 10 | 203 | 103508 | 507.86 | 843 | 825 | 202.2 |
| D | 12 | 218 | 82107 | 402.01 | 843 | 825 | 202.2 |
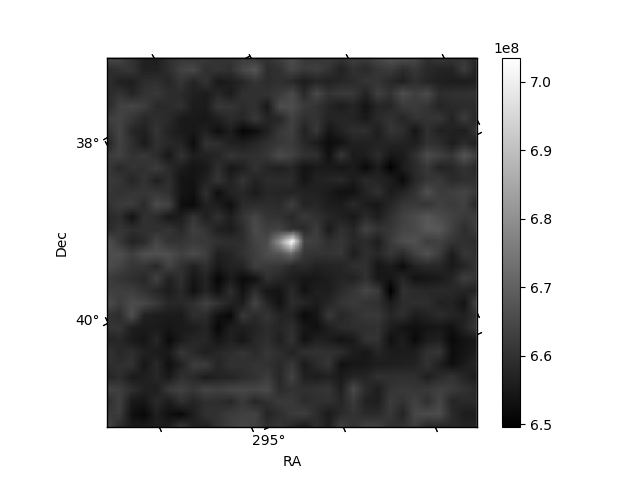
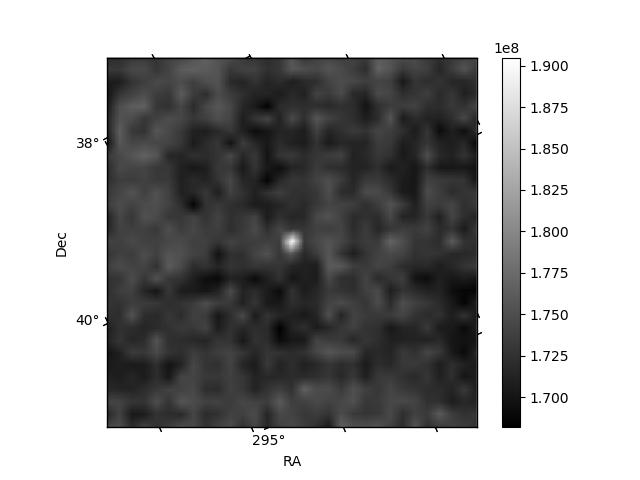
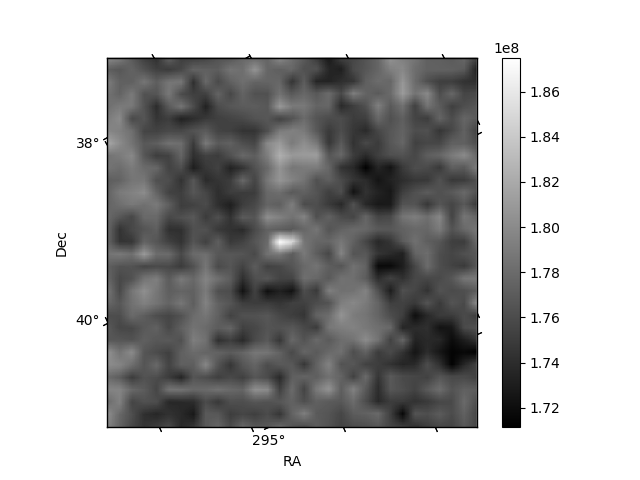
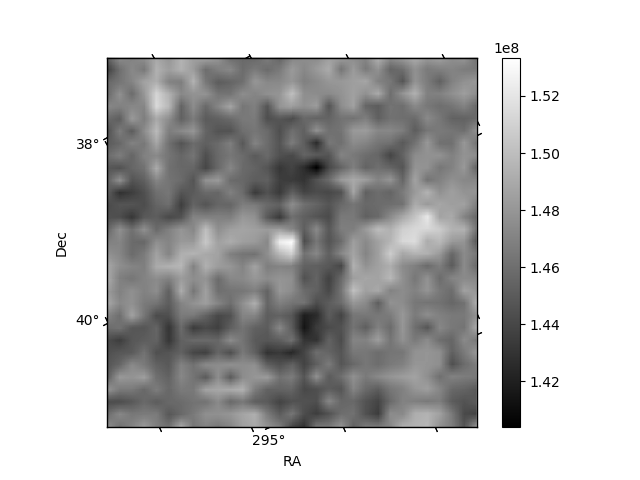
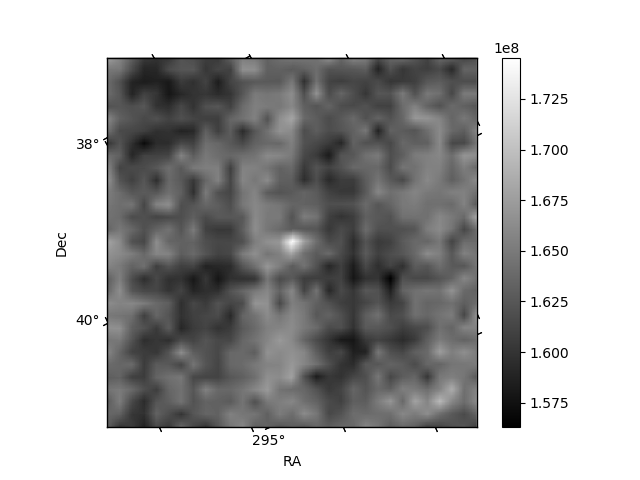
Histogram calculated using DETX and DETY for each event in the final _common_clean file
| Quadrant A | 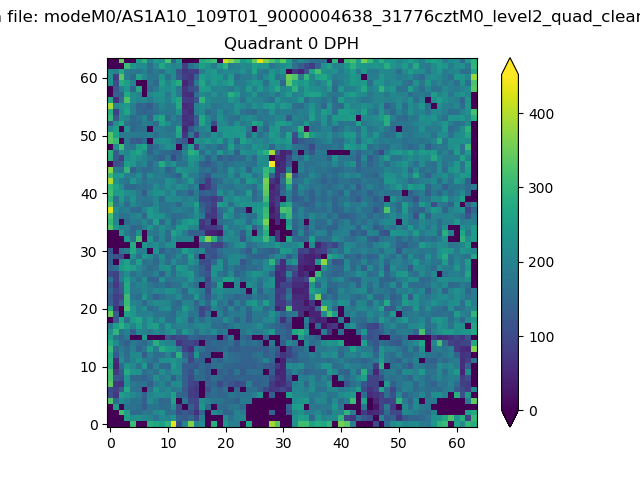 |
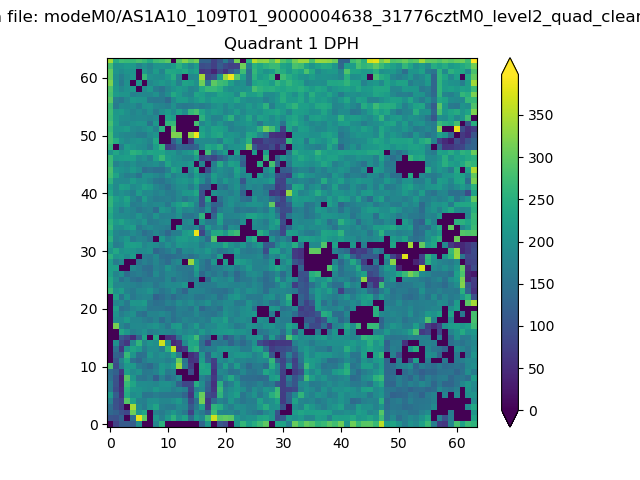 |
Quadrant B |
|---|---|---|---|
| Quadrant D | 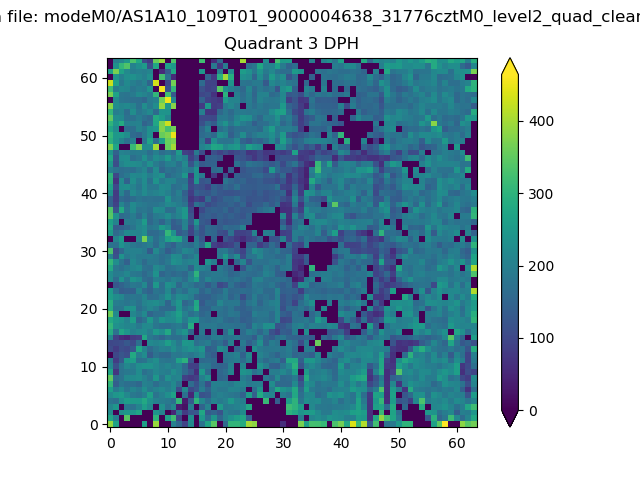 |
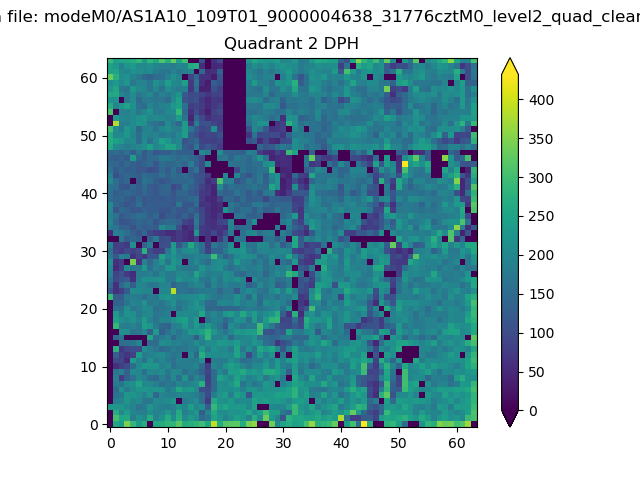 |
Quadrant C |
| Plot type | Count rate plots | Images |
|---|---|---|
| Comparison with Poisson distribution Blue bars denote a histogram of data divided into 1 sec bins. Red curve is a Poisson curve with rate = median count rate of data. |
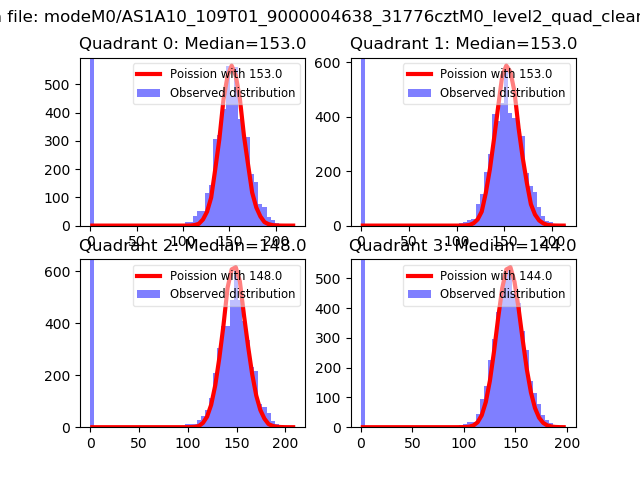 |
 |
| Quadrant-wise count rates Data is divided into 100 sec bins |
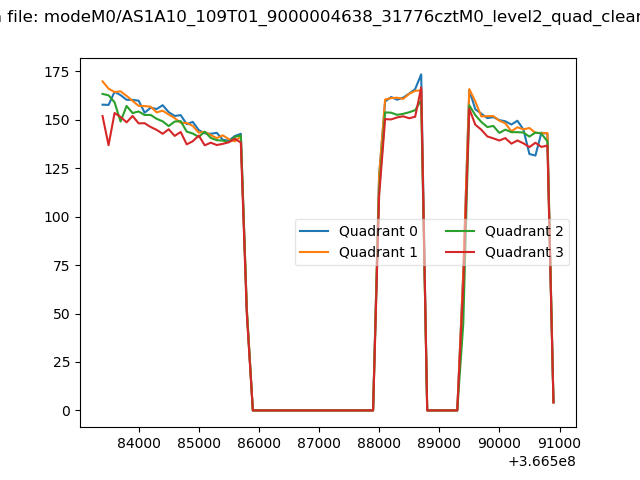 |
|
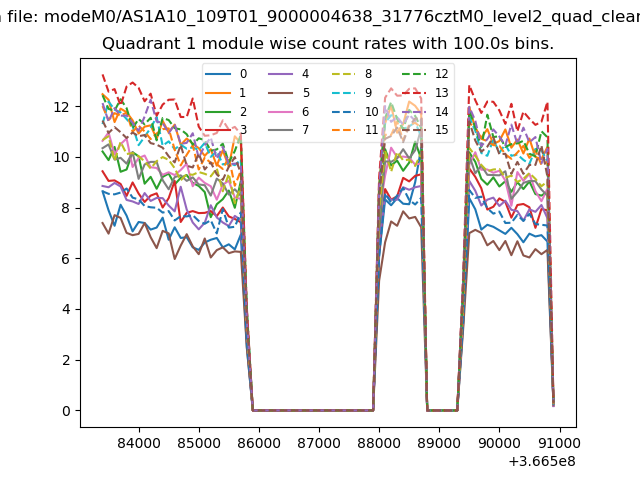
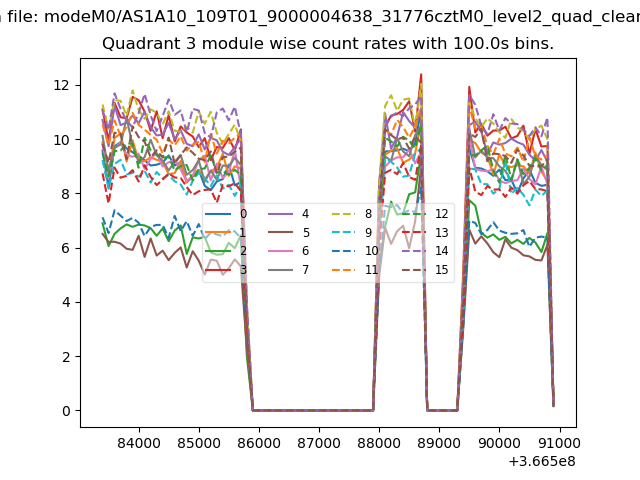
| Module-wise count rates for Quadrant A Data is divided into 100 sec bins |
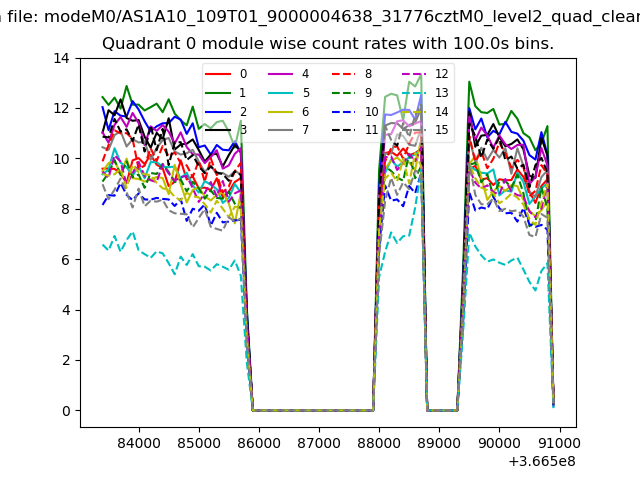 |
 |
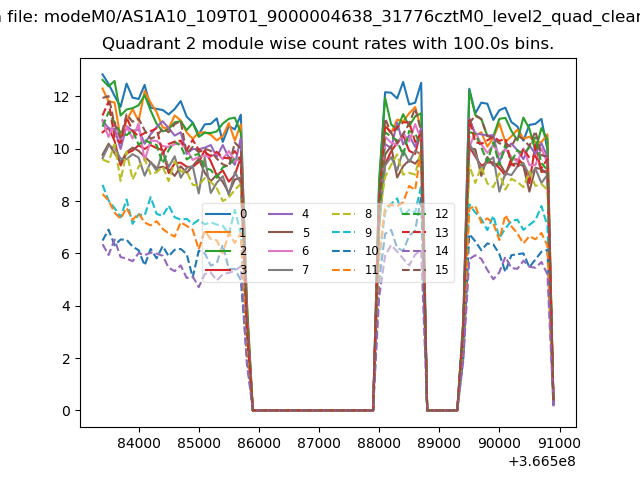
| Module-wise count rates for Quadrant B Data is divided into 100 sec bins |
 |
 |
| Module-wise count rates for Quadrant C Data is divided into 100 sec bins |
 |
 |
| Module-wise count rates for Quadrant D Data is divided into 100 sec bins |
 |
 |
| Parameter | Plot |
|---|---|
| CZT HV Monitor |  |
| D_VDD | 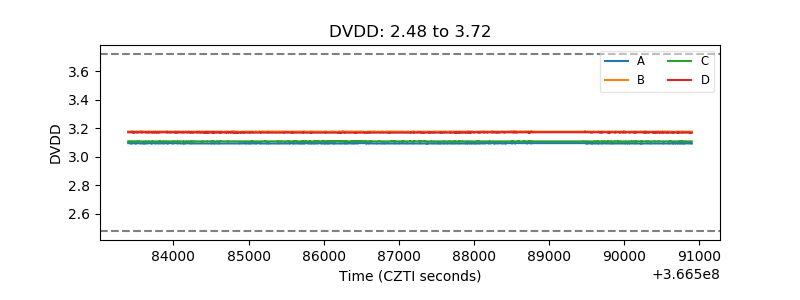 |
| Temperature 1 |  |
| Veto HV Monitor | 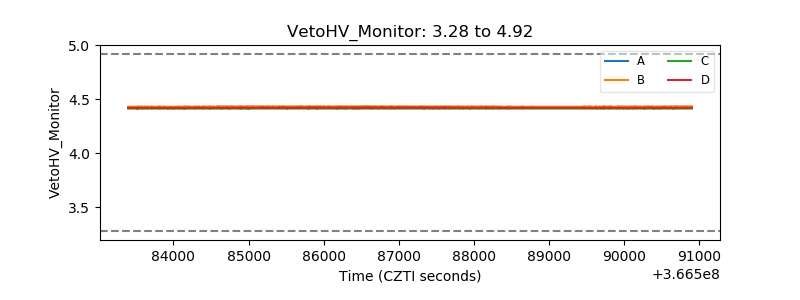 |
| Veto LLD | 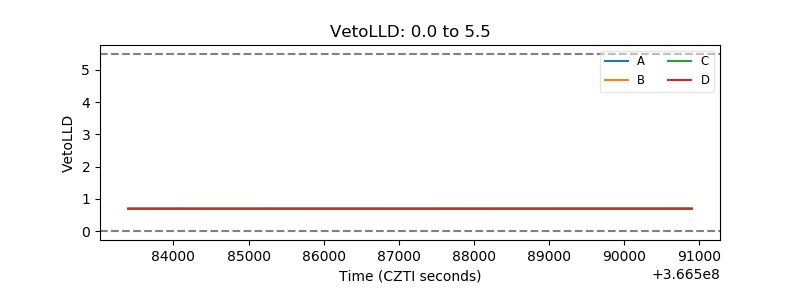 |
| Alpha Counter | 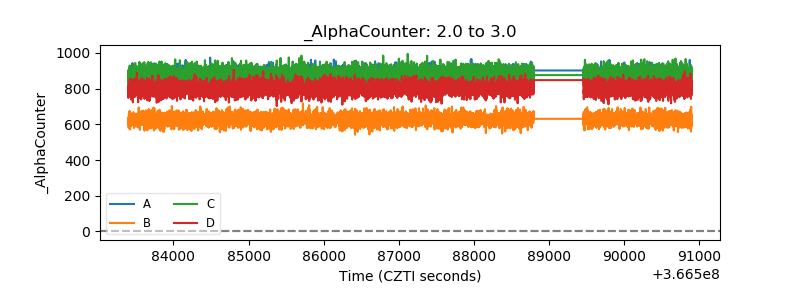 |
| _CPM_Rate | 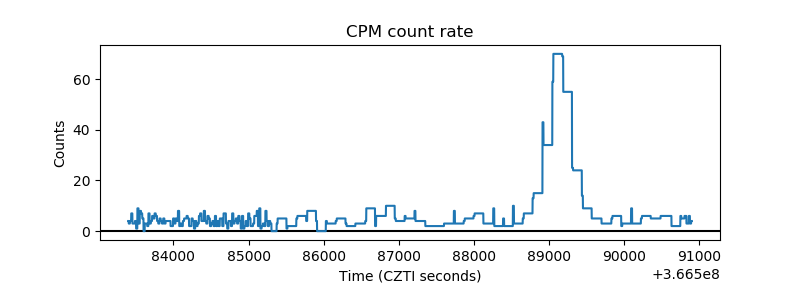 |
| CZT Counter | 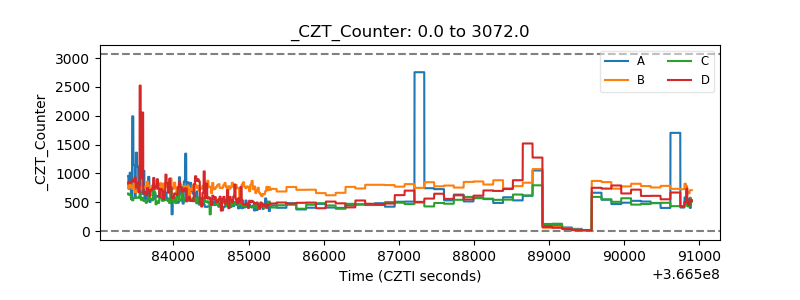 |
| +2.5 Volts monitor |  |
| +5 Volts monitor | 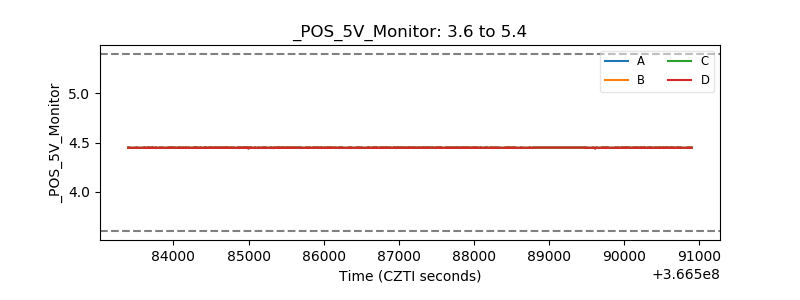 |
| _ROLL_ROT | 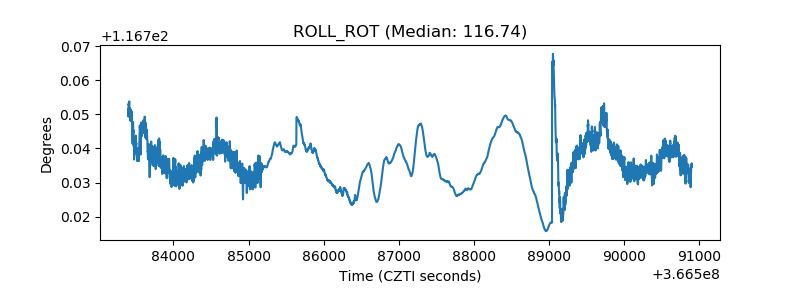 |
| _Roll_DEC | 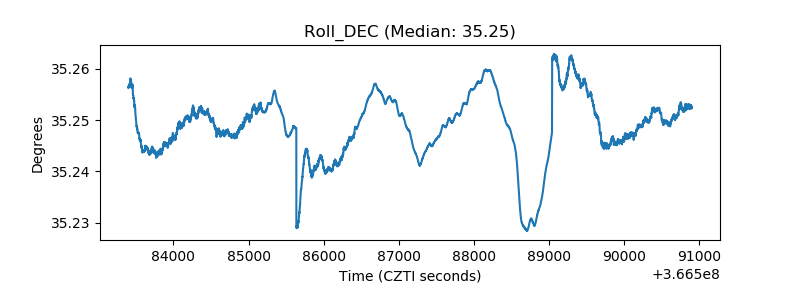 |
| _Roll_RA | 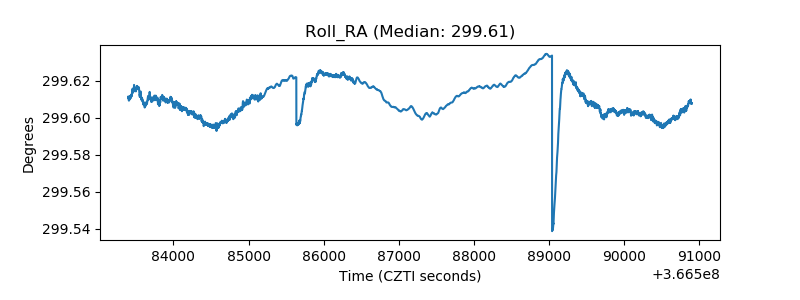 |
| Veto Counter | 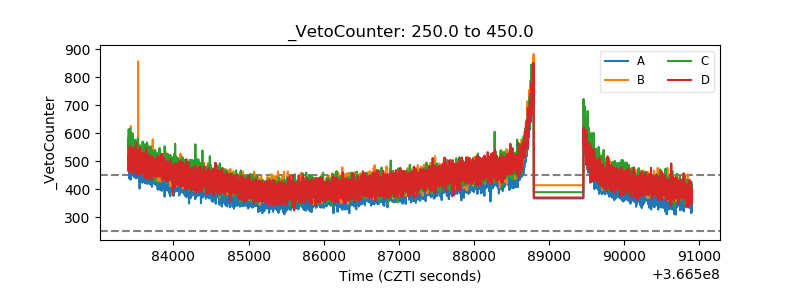 |