| Param | Original file | Final file |
|---|---|---|
| Filename | modeM0/AS1A10_109T01_9000004638_31777cztM0_level2.evt | modeM0/AS1A10_109T01_9000004638_31777cztM0_level2_quad_clean.evt |
| Size (bytes) | 618,059,520 | 117,483,840 |
| Size | 589.4 MB | 112.0 MB |
| Events in quadrant A | 3,907,348 | 779,526 |
| Events in quadrant B | 5,749,122 | 778,861 |
| Events in quadrant C | 3,852,716 | 750,922 |
| Events in quadrant D | 4,707,813 | 733,388 |
| Mode M0 | |||
|---|---|---|---|
| Quadrant | BADHDUFLAG | Total packets | Discarded packets |
| A | 0 | 16273 | 2 |
| B | 0 | 22515 | 2 |
| C | 0 | 16062 | 2 |
| D | 0 | 19166 | 2 |
| Mode M9 | |||
|---|---|---|---|
| Quadrant | BADHDUFLAG | Total packets | Discarded packets |
| A | 0 | 9 | 0 |
| B | 0 | 10 | 0 |
| C | 0 | 10 | 0 |
| D | 0 | 10 | 0 |
| Mode SS | |||
|---|---|---|---|
| Quadrant | BADHDUFLAG | Total packets | Discarded packets |
| A | 0 | 150 | 0 |
| B | 0 | 150 | 0 |
| C | 0 | 150 | 0 |
| D | 0 | 150 | 0 |
| Quadrant | Total seconds | Saturated seconds | Saturation percentage |
|---|---|---|---|
| A | 7413 | 69 | 0.930797% |
| B | 7413 | 86 | 1.160124% |
| C | 7413 | 162 | 2.185350% |
| D | 7413 | 38 | 0.512613% |
Noise dominated data is calculated using 1-second bins in cleaned event files. If a bin has >2000 counts, and if more than 50% of those come from <1% of pixels, then it is considered to be noise-dominated and hence unusable.
| Quadrant | # 1 sec bins | Bins with >0 counts | Bins with >2000 counts | High rate bins dominated by noise | Noise dominated (total time) | Noise dominated (detector-on time) | Marked lightcurve |
|---|---|---|---|---|---|---|---|
| A | 7718 | 7415 | 39 | 39 | 0.51% | 0.53% | 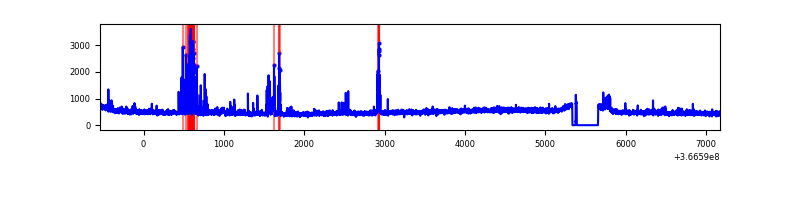 |
| B | 7718 | 7415 | 7 | 7 | 0.09% | 0.09% | 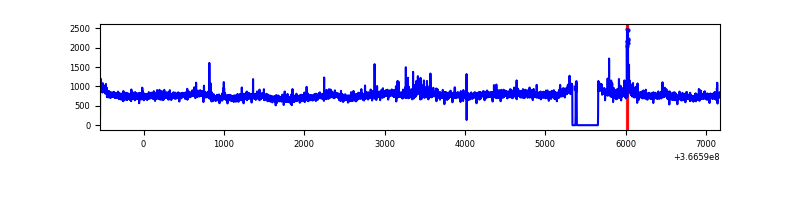 |
| C | 7718 | 7415 | 38 | 38 | 0.49% | 0.51% | 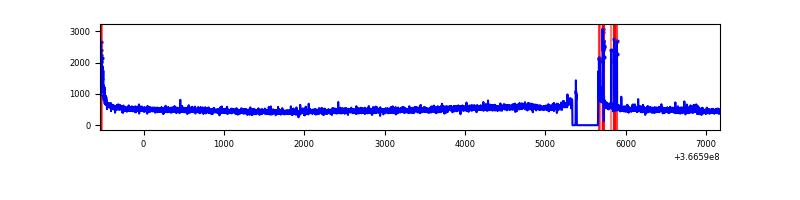 |
| D | 7718 | 7415 | 24 | 24 | 0.31% | 0.32% | 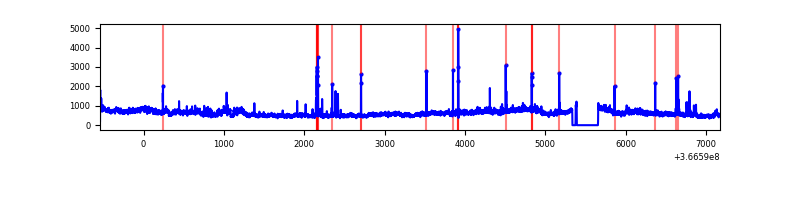 |
Top three noisy pixels from each quadrant. If the there are fewer than three noisy pixels in the level2.evt file, extra rows are filled as -1
| Pixel properties | Quadrant properties | ||||||
|---|---|---|---|---|---|---|---|
| Quadrant | DetID | PixID | Counts | Sigma | Mean | Median | Sigma |
| A | 0 | 13 | 323336 | 1737.59 | 923 | 906 | 185.6 |
| A | 14 | 238 | 23979 | 124.34 | 923 | 906 | 185.6 |
| A | 13 | 254 | 13214 | 66.33 | 923 | 906 | 185.6 |
| B | 6 | 159 | 2011441 | 11427.62 | 915 | 891 | 175.9 |
| B | 0 | 229 | 64403 | 360.99 | 915 | 891 | 175.9 |
| B | 10 | 245 | 29791 | 164.26 | 915 | 891 | 175.9 |
| C | 14 | 238 | 146349 | 691.08 | 894 | 902 | 210.5 |
| C | 0 | 10 | 101034 | 475.77 | 894 | 902 | 210.5 |
| C | 10 | 22 | 73586 | 345.35 | 894 | 902 | 210.5 |
| D | 8 | 195 | 1149569 | 5330.07 | 898 | 877 | 215.5 |
| D | 12 | 218 | 78736 | 361.28 | 898 | 877 | 215.5 |
| D | 2 | 250 | 39004 | 176.91 | 898 | 877 | 215.5 |
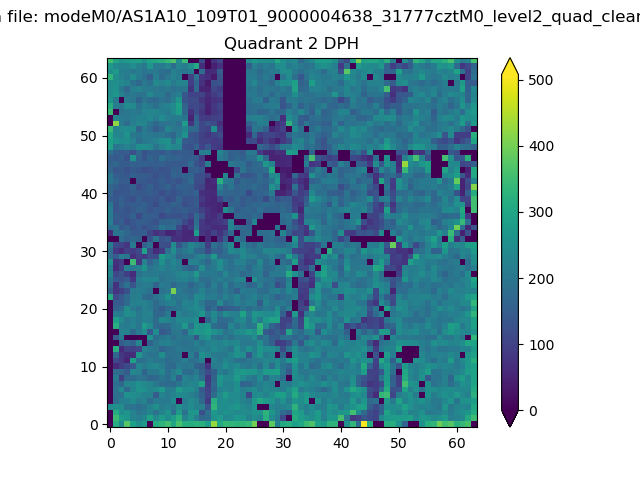
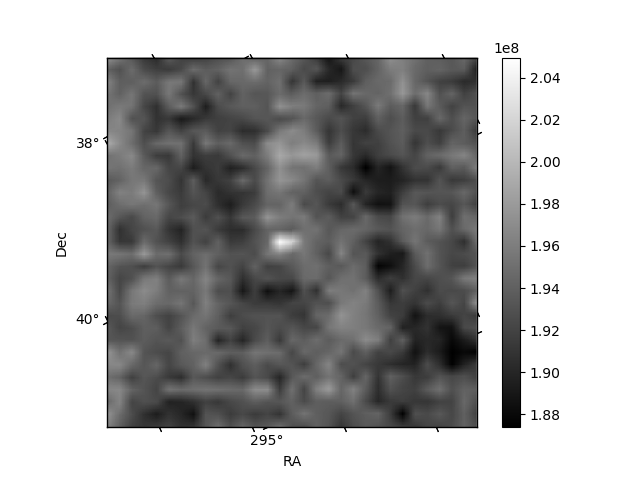
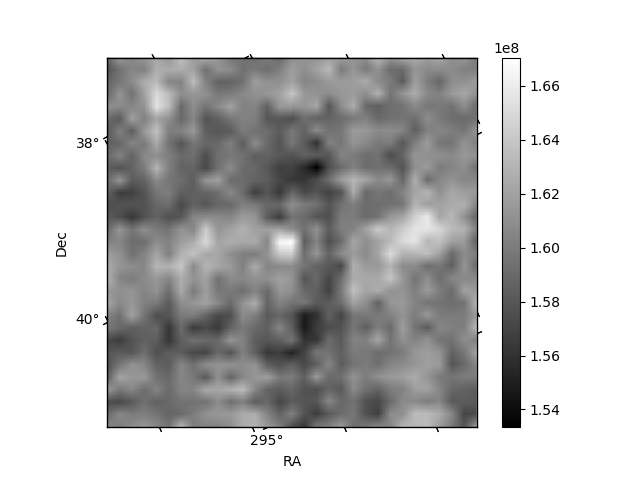
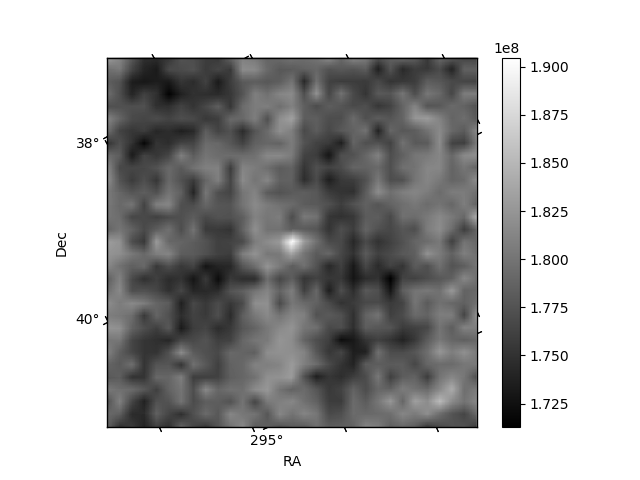
Histogram calculated using DETX and DETY for each event in the final _common_clean file
| Quadrant A | 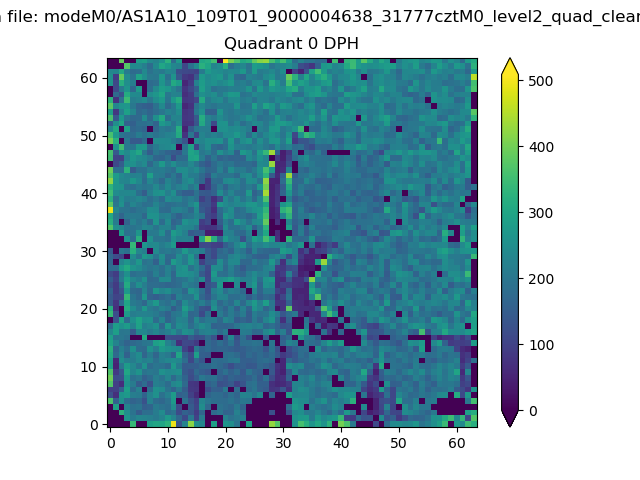 |
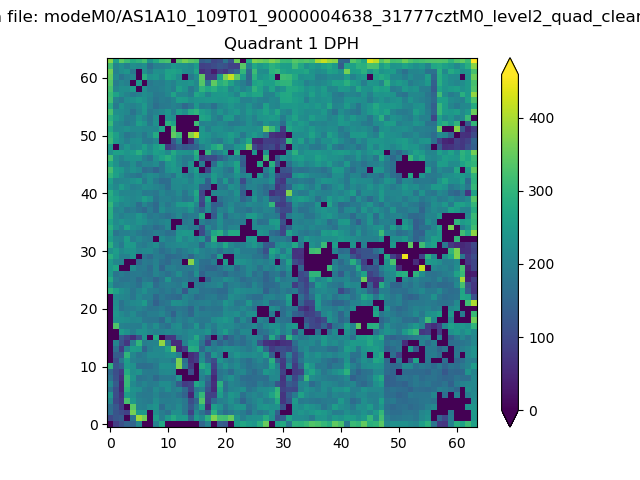 |
Quadrant B |
|---|---|---|---|
| Quadrant D | 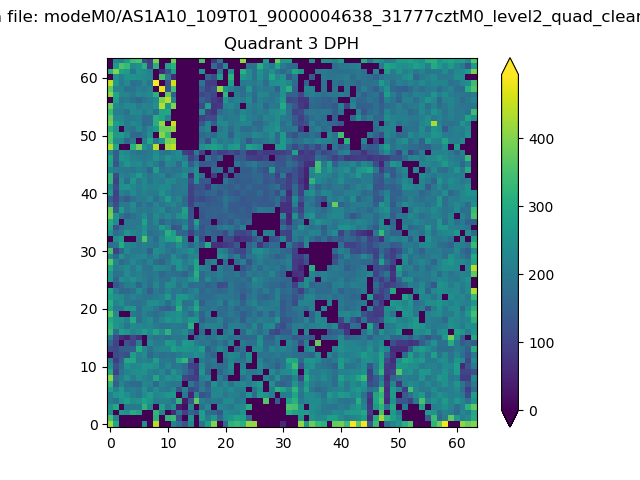 |
 |
Quadrant C |
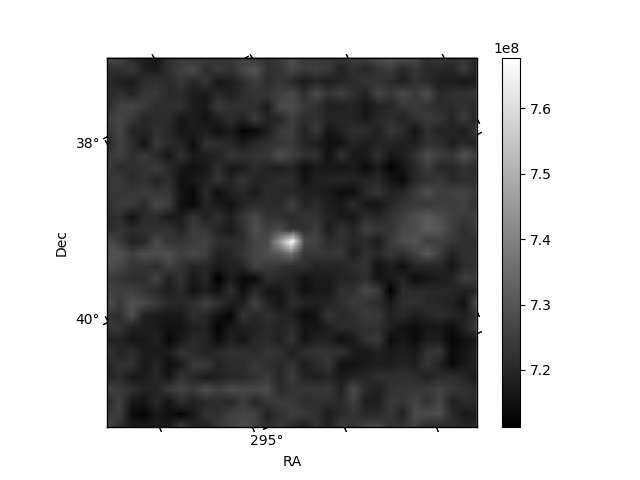
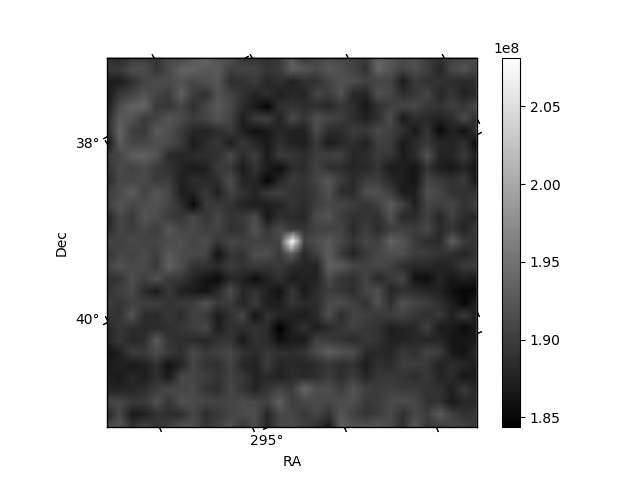
| Plot type | Count rate plots | Images |
|---|---|---|
| Comparison with Poisson distribution Blue bars denote a histogram of data divided into 1 sec bins. Red curve is a Poisson curve with rate = median count rate of data. |
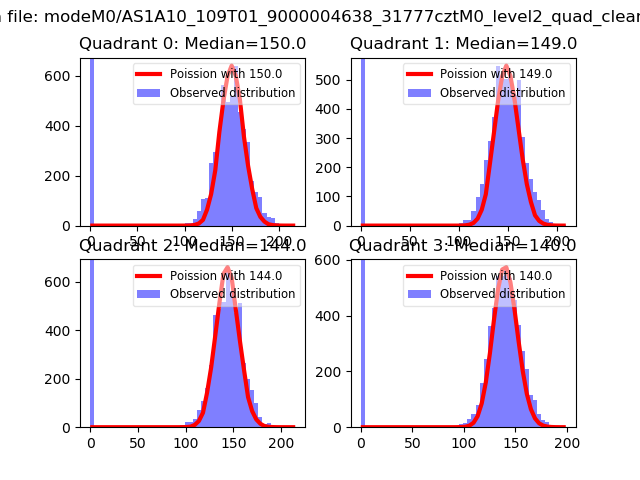 |
 |
| Quadrant-wise count rates Data is divided into 100 sec bins |
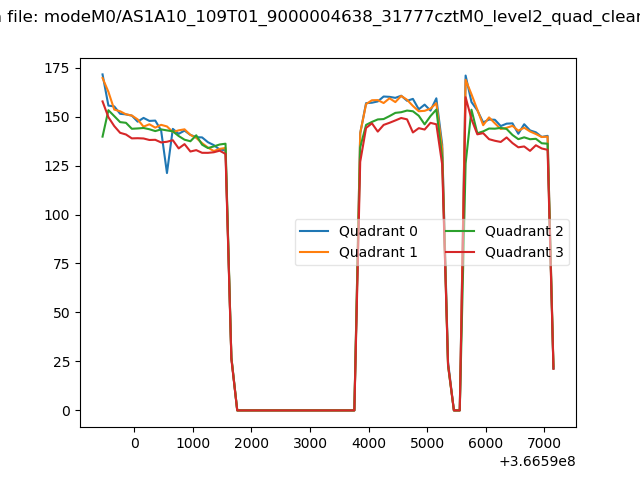 |
|
| Module-wise count rates for Quadrant A Data is divided into 100 sec bins |
 |
 |
| Module-wise count rates for Quadrant B Data is divided into 100 sec bins |
 |
 |
| Module-wise count rates for Quadrant C Data is divided into 100 sec bins |
 |
 |
| Module-wise count rates for Quadrant D Data is divided into 100 sec bins |
 |
 |
| Parameter | Plot |
|---|---|
| CZT HV Monitor |  |
| D_VDD | 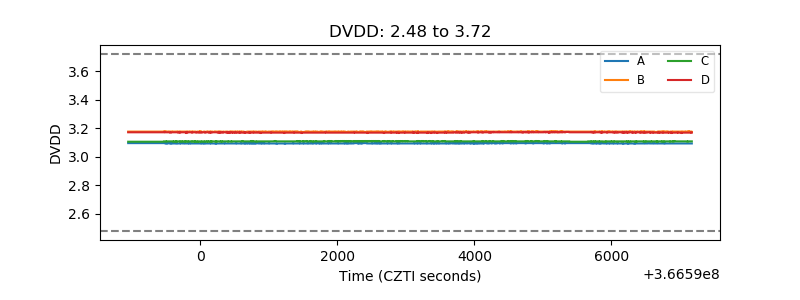 |
| Temperature 1 | 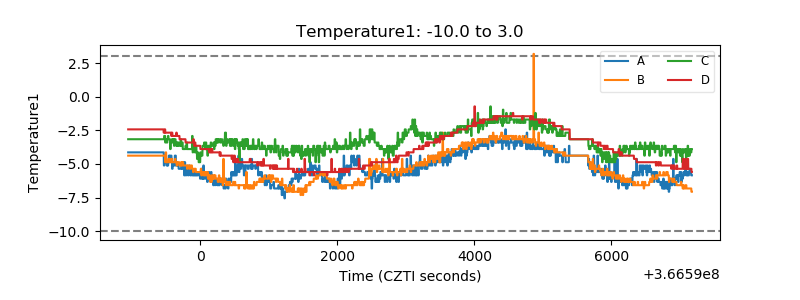 |
| Veto HV Monitor | 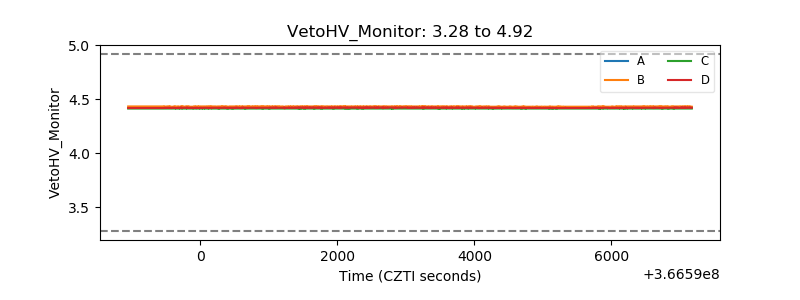 |
| Veto LLD | 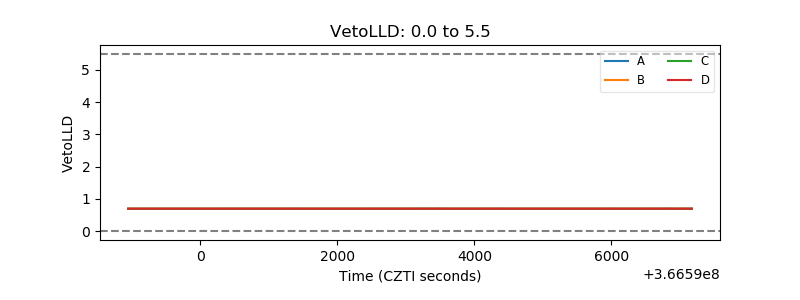 |
| Alpha Counter | 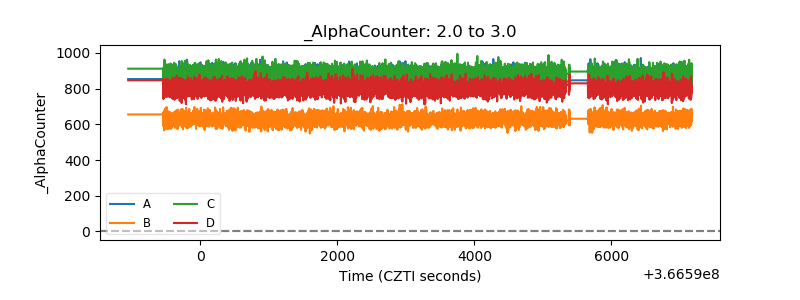 |
| _CPM_Rate | 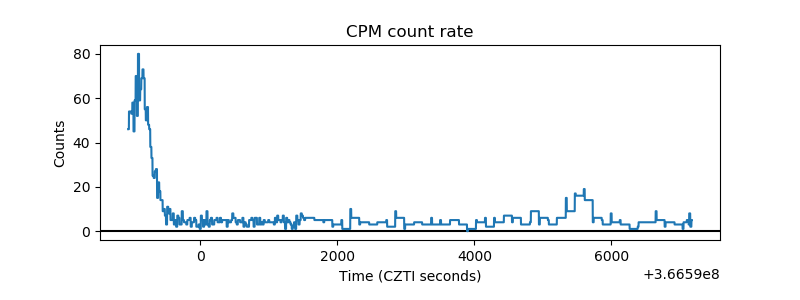 |
| CZT Counter | 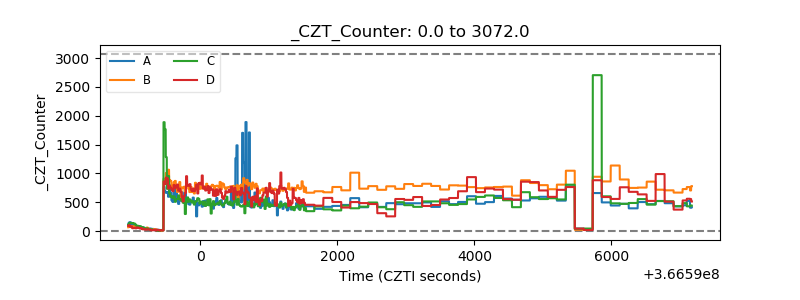 |
| +2.5 Volts monitor | 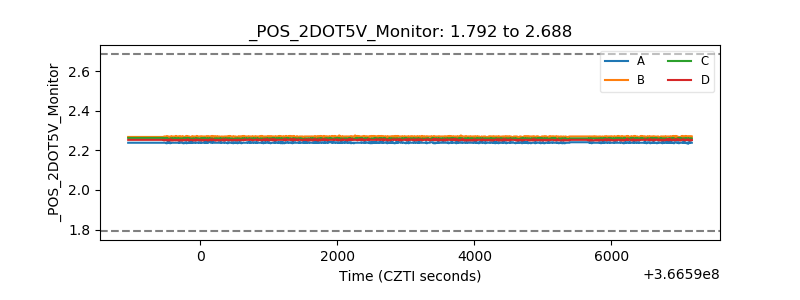 |
| +5 Volts monitor |  |
| _ROLL_ROT |  |
| _Roll_DEC | 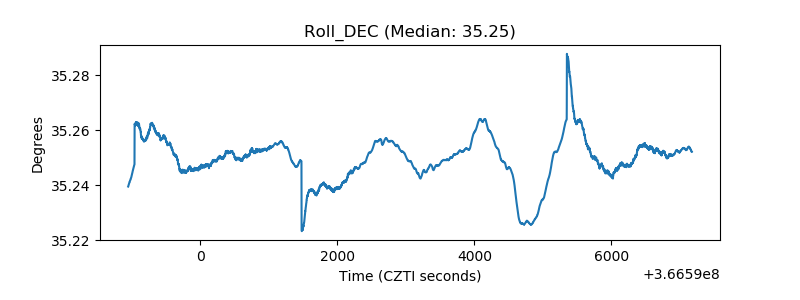 |
| _Roll_RA | 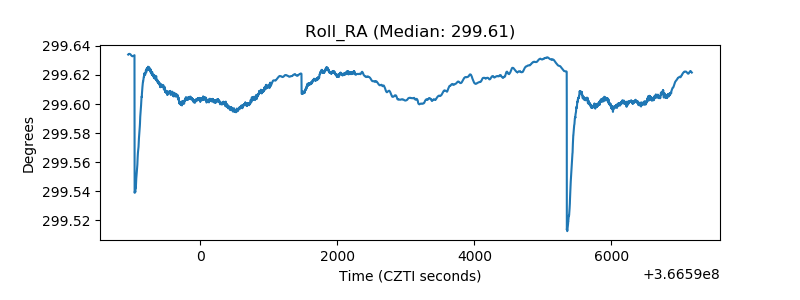 |
| Veto Counter | 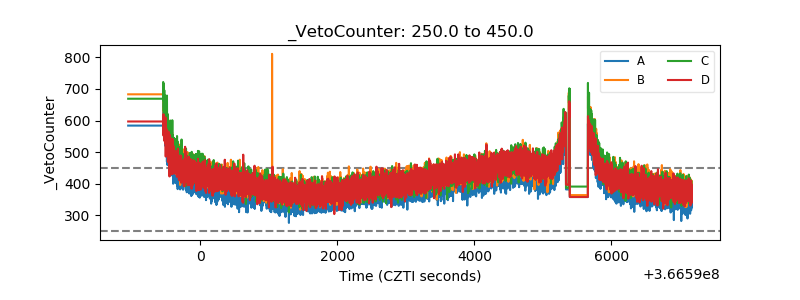 |