| Param | Original file | Final file |
|---|---|---|
| Filename | modeM0/AS1A10_109T01_9000004638_31781cztM0_level2.evt | modeM0/AS1A10_109T01_9000004638_31781cztM0_level2_quad_clean.evt |
| Size (bytes) | 1,516,242,240 | 233,403,840 |
| Size | 1.4 GB | 222.6 MB |
| Events in quadrant A | 9,908,847 | 1,482,799 |
| Events in quadrant B | 14,393,762 | 1,481,641 |
| Events in quadrant C | 9,197,663 | 1,443,529 |
| Events in quadrant D | 11,186,837 | 1,400,565 |
| Mode M0 | |||
|---|---|---|---|
| Quadrant | BADHDUFLAG | Total packets | Discarded packets |
| A | 0 | 40637 | 5 |
| B | 0 | 56742 | 3 |
| C | 0 | 38442 | 3 |
| D | 0 | 45396 | 3 |
| Mode M9 | |||
|---|---|---|---|
| Quadrant | BADHDUFLAG | Total packets | Discarded packets |
| A | 0 | 17 | 0 |
| B | 0 | 17 | 0 |
| C | 0 | 17 | 0 |
| D | 0 | 17 | 0 |
| Mode SS | |||
|---|---|---|---|
| Quadrant | BADHDUFLAG | Total packets | Discarded packets |
| A | 0 | 372 | 0 |
| B | 0 | 372 | 0 |
| C | 0 | 372 | 0 |
| D | 0 | 372 | 0 |
| Quadrant | Total seconds | Saturated seconds | Saturation percentage |
|---|---|---|---|
| A | 18288 | 408 | 2.230971% |
| B | 18289 | 437 | 2.389414% |
| C | 18289 | 283 | 1.547378% |
| D | 18289 | 226 | 1.235715% |
Noise dominated data is calculated using 1-second bins in cleaned event files. If a bin has >2000 counts, and if more than 50% of those come from <1% of pixels, then it is considered to be noise-dominated and hence unusable.
| Quadrant | # 1 sec bins | Bins with >0 counts | Bins with >2000 counts | High rate bins dominated by noise | Noise dominated (total time) | Noise dominated (detector-on time) | Marked lightcurve |
|---|---|---|---|---|---|---|---|
| A | 20003 | 18291 | 147 | 147 | 0.73% | 0.80% | 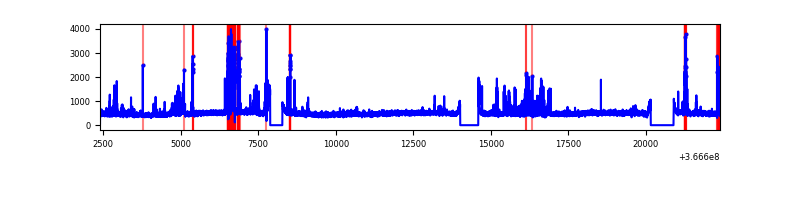 |
| B | 20004 | 18291 | 113 | 113 | 0.56% | 0.62% | 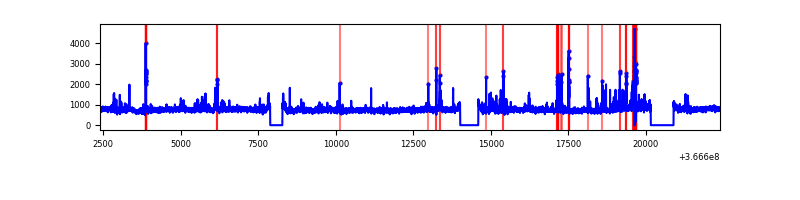 |
| C | 20004 | 18292 | 8 | 8 | 0.04% | 0.04% | 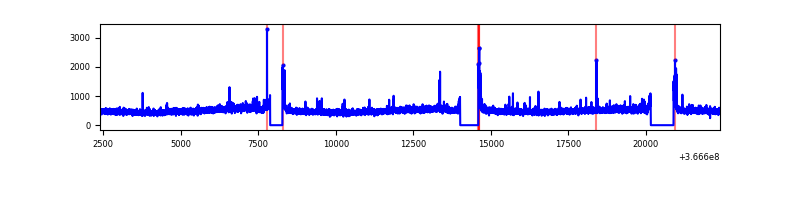 |
| D | 20004 | 18292 | 73 | 73 | 0.36% | 0.40% | 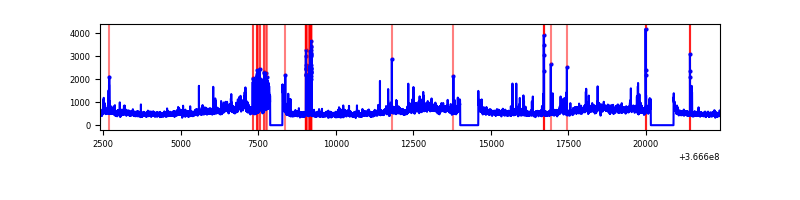 |
Top three noisy pixels from each quadrant. If the there are fewer than three noisy pixels in the level2.evt file, extra rows are filled as -1
| Pixel properties | Quadrant properties | ||||||
|---|---|---|---|---|---|---|---|
| Quadrant | DetID | PixID | Counts | Sigma | Mean | Median | Sigma |
| A | 0 | 13 | 1211400 | 2683.71 | 2249 | 2209 | 450.6 |
| A | 13 | 254 | 33817 | 70.15 | 2249 | 2209 | 450.6 |
| A | 3 | 137 | 23246 | 46.69 | 2249 | 2209 | 450.6 |
| B | 6 | 159 | 4794854 | 11206.92 | 2222 | 2161 | 427.7 |
| B | 0 | 229 | 583700 | 1359.83 | 2222 | 2161 | 427.7 |
| B | 4 | 80 | 132978 | 305.89 | 2222 | 2161 | 427.7 |
| C | 14 | 238 | 351837 | 687.04 | 2176 | 2200 | 508.9 |
| C | 0 | 10 | 211043 | 410.38 | 2176 | 2200 | 508.9 |
| C | 3 | 233 | 67139 | 127.61 | 2176 | 2200 | 508.9 |
| D | 8 | 195 | 2161987 | 4192.67 | 2183 | 2134 | 515.2 |
| D | 12 | 218 | 328005 | 632.57 | 2183 | 2134 | 515.2 |
| D | 2 | 250 | 211959 | 407.31 | 2183 | 2134 | 515.2 |
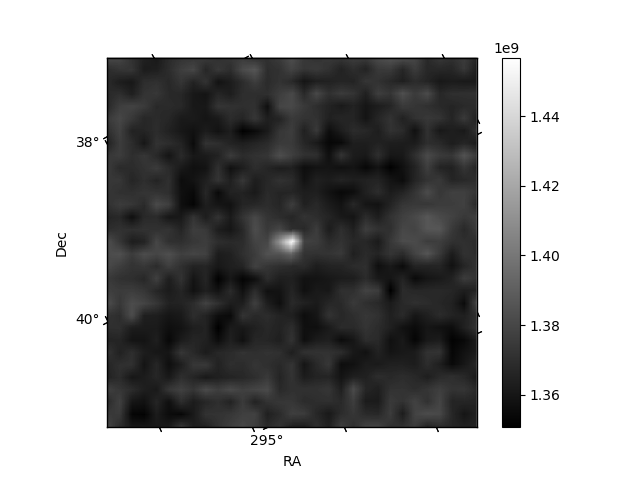
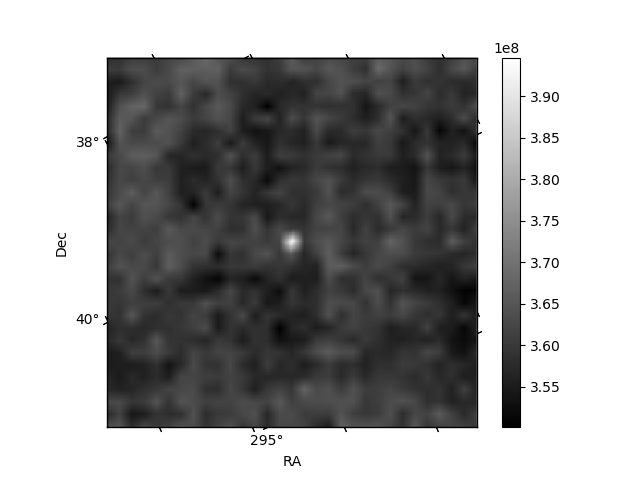
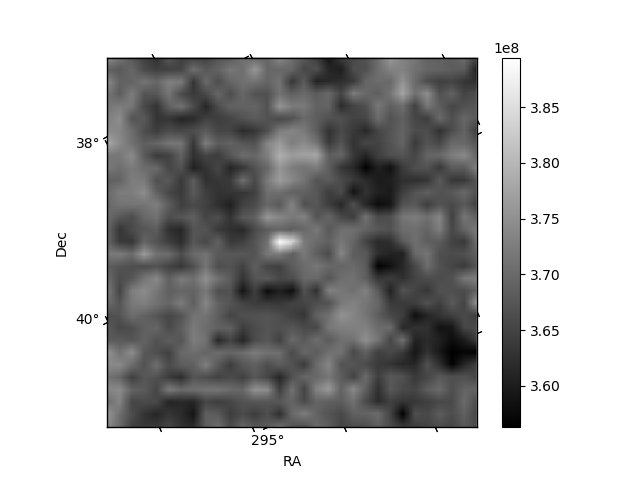
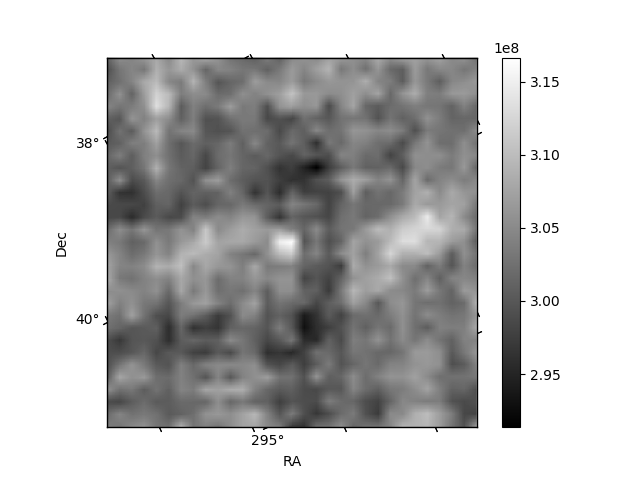
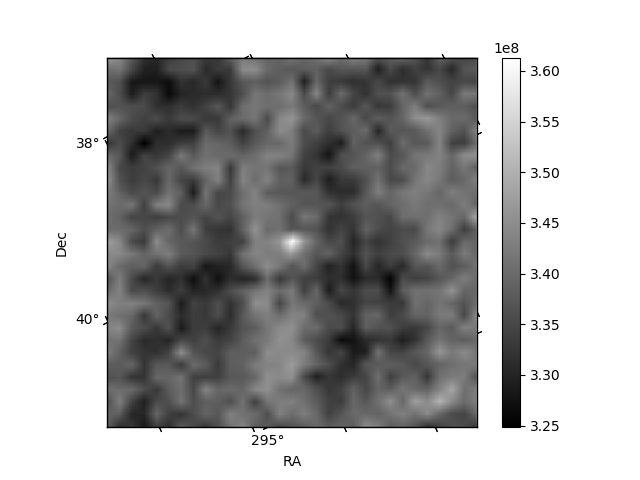
Histogram calculated using DETX and DETY for each event in the final _common_clean file
| Quadrant A | 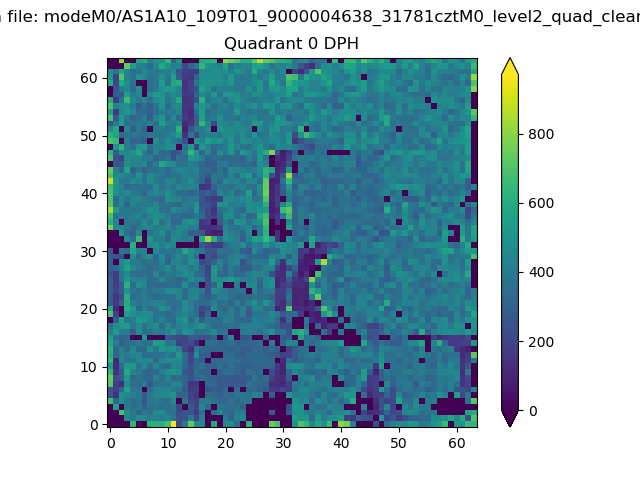 |
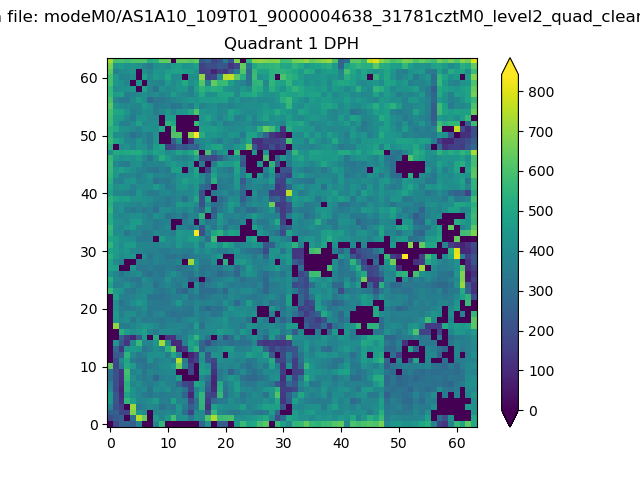 |
Quadrant B |
|---|---|---|---|
| Quadrant D | 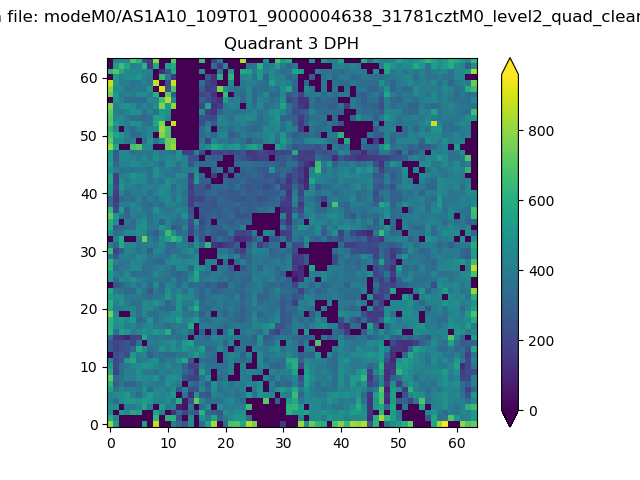 |
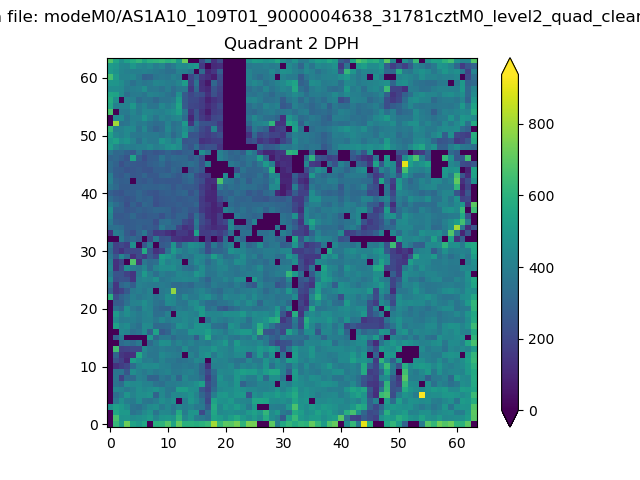 |
Quadrant C |
| Plot type | Count rate plots | Images |
|---|---|---|
| Comparison with Poisson distribution Blue bars denote a histogram of data divided into 1 sec bins. Red curve is a Poisson curve with rate = median count rate of data. |
 |
 |
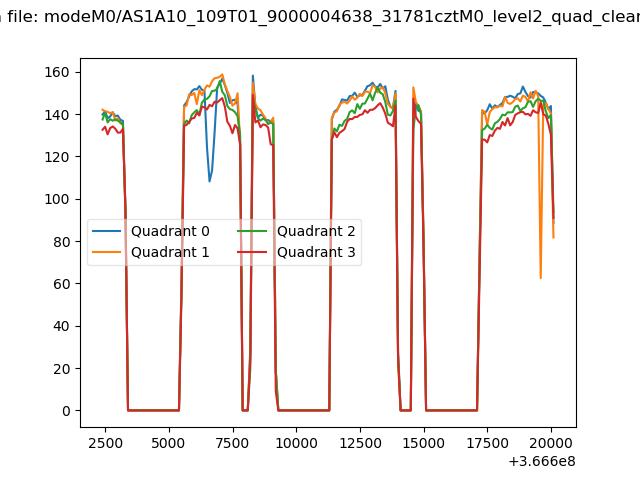
| Quadrant-wise count rates Data is divided into 100 sec bins |
 |
|
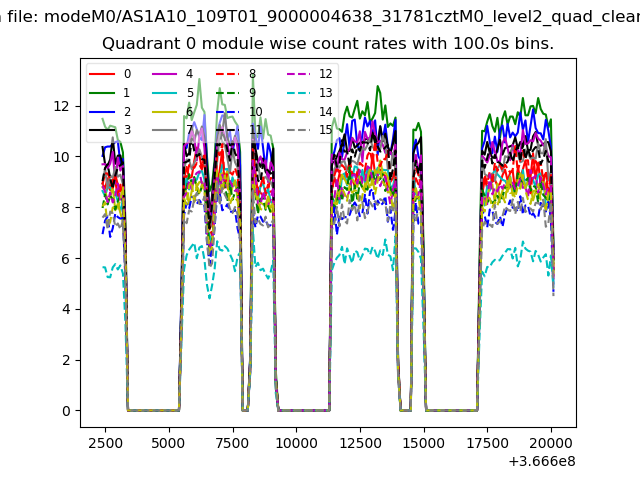
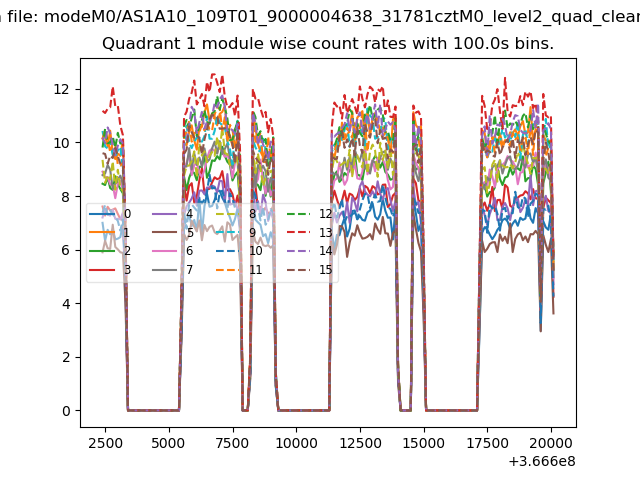
| Module-wise count rates for Quadrant A Data is divided into 100 sec bins |
 |
 |
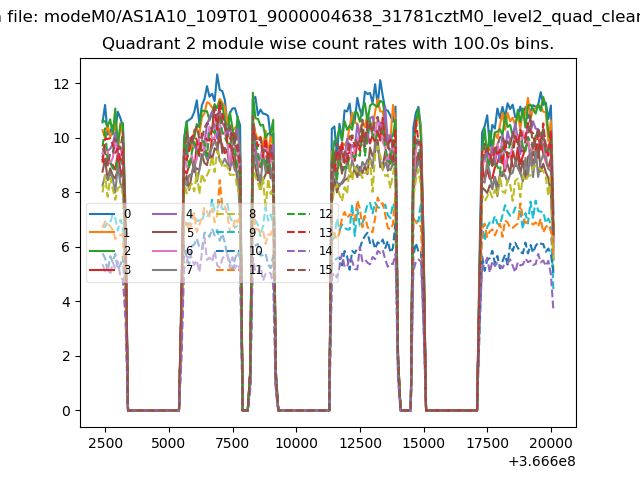
| Module-wise count rates for Quadrant B Data is divided into 100 sec bins |
 |
 |
| Module-wise count rates for Quadrant C Data is divided into 100 sec bins |
 |
 |
| Module-wise count rates for Quadrant D Data is divided into 100 sec bins |
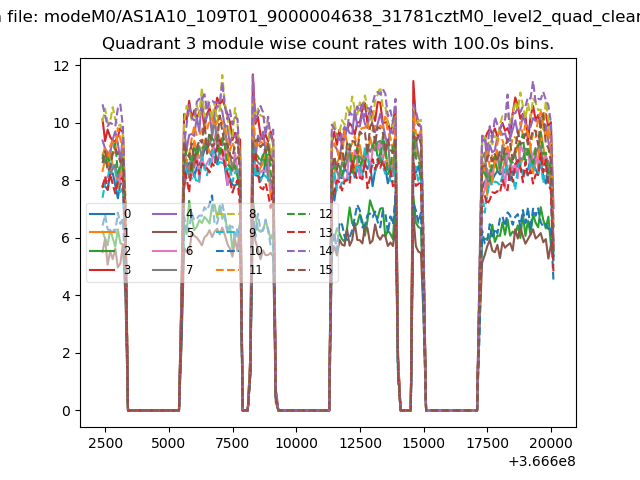 |
 |
| Parameter | Plot |
|---|---|
| CZT HV Monitor |  |
| D_VDD | 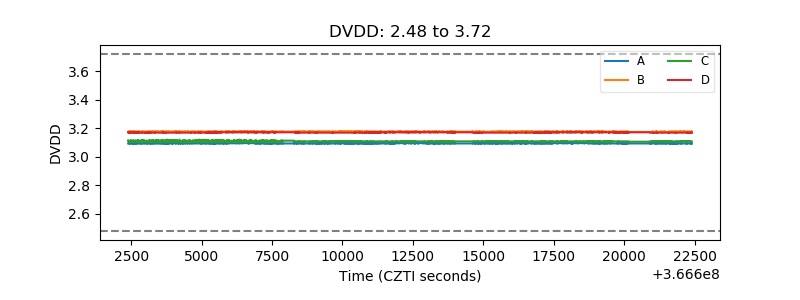 |
| Temperature 1 | 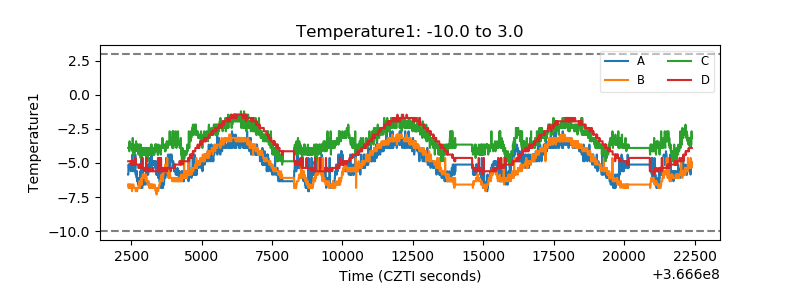 |
| Veto HV Monitor | 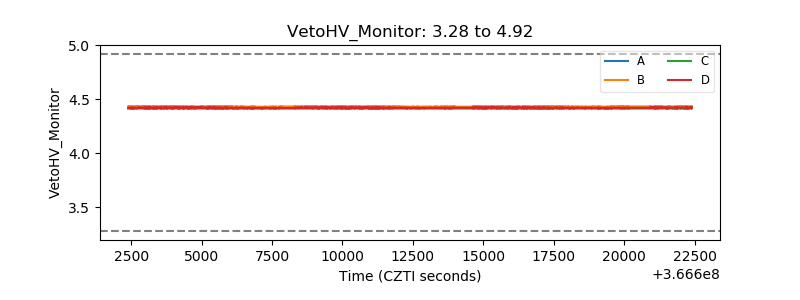 |
| Veto LLD |  |
| Alpha Counter | 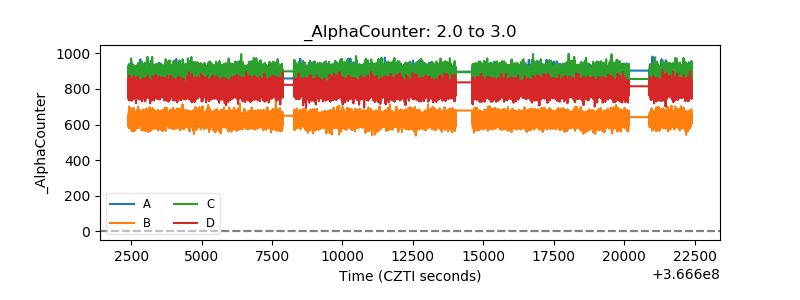 |
| _CPM_Rate | 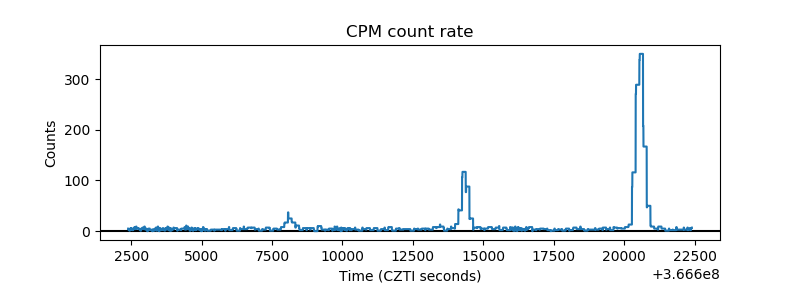 |
| CZT Counter | 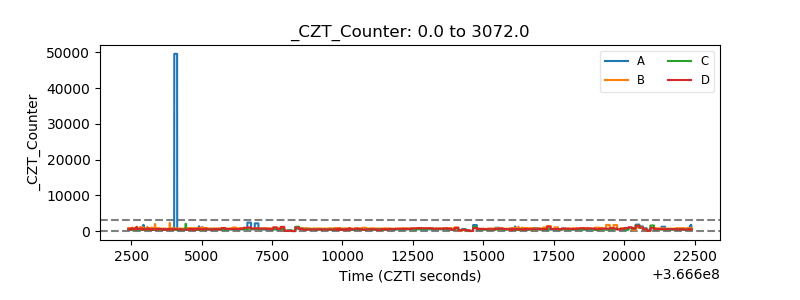 |
| +2.5 Volts monitor |  |
| +5 Volts monitor |  |
| _ROLL_ROT |  |
| _Roll_DEC | 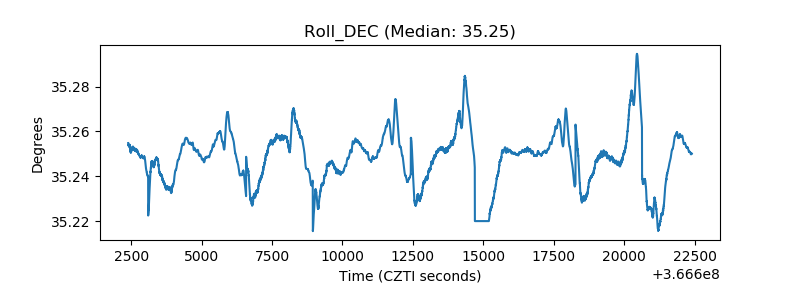 |
| _Roll_RA | 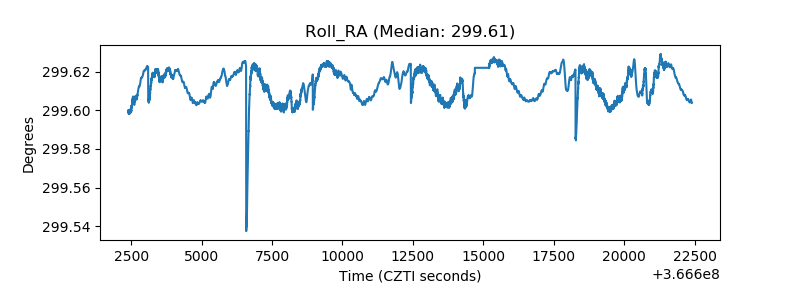 |
| Veto Counter |  |