| Param | Original file | Final file |
|---|---|---|
| Filename | modeM0/AS1A10_109T01_9000004638_31782cztM0_level2.evt | modeM0/AS1A10_109T01_9000004638_31782cztM0_level2_quad_clean.evt |
| Size (bytes) | 564,094,080 | 75,651,840 |
| Size | 538.0 MB | 72.1 MB |
| Events in quadrant A | 3,887,618 | 464,197 |
| Events in quadrant B | 5,264,960 | 464,170 |
| Events in quadrant C | 3,609,867 | 448,499 |
| Events in quadrant D | 3,858,234 | 437,428 |
| Mode M0 | |||
|---|---|---|---|
| Quadrant | BADHDUFLAG | Total packets | Discarded packets |
| A | 0 | 15688 | 2 |
| B | 0 | 20660 | 2 |
| C | 0 | 14682 | 2 |
| D | 0 | 15994 | 2 |
| Mode M9 | |||
|---|---|---|---|
| Quadrant | BADHDUFLAG | Total packets | Discarded packets |
| A | 0 | 13 | 3 |
| B | 0 | 14 | 3 |
| C | 0 | 14 | 3 |
| D | 0 | 14 | 1 |
| Mode SS | |||
|---|---|---|---|
| Quadrant | BADHDUFLAG | Total packets | Discarded packets |
| A | 0 | 140 | 0 |
| B | 0 | 140 | 0 |
| C | 0 | 140 | 0 |
| D | 0 | 140 | 0 |
| Quadrant | Total seconds | Saturated seconds | Saturation percentage |
|---|---|---|---|
| A | 6832 | 123 | 1.800351% |
| B | 6832 | 110 | 1.610070% |
| C | 6832 | 168 | 2.459016% |
| D | 6832 | 70 | 1.024590% |
Noise dominated data is calculated using 1-second bins in cleaned event files. If a bin has >2000 counts, and if more than 50% of those come from <1% of pixels, then it is considered to be noise-dominated and hence unusable.
| Quadrant | # 1 sec bins | Bins with >0 counts | Bins with >2000 counts | High rate bins dominated by noise | Noise dominated (total time) | Noise dominated (detector-on time) | Marked lightcurve |
|---|---|---|---|---|---|---|---|
| A | 7772 | 6833 | 33 | 33 | 0.42% | 0.48% | 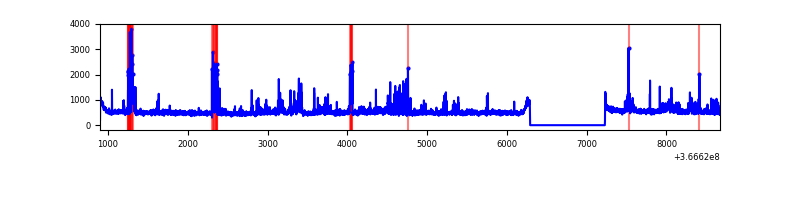 |
| B | 7772 | 6833 | 1 | 1 | 0.01% | 0.01% | 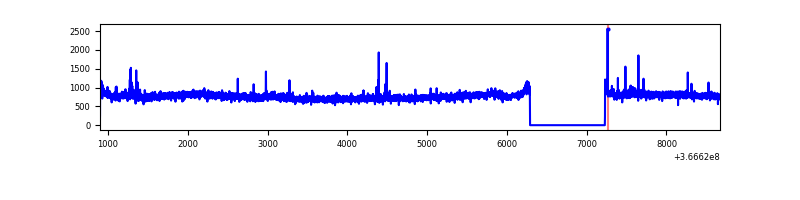 |
| C | 7772 | 6833 | 14 | 14 | 0.18% | 0.20% | 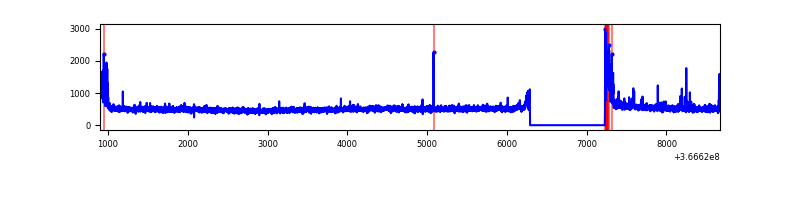 |
| D | 7772 | 6833 | 20 | 20 | 0.26% | 0.29% | 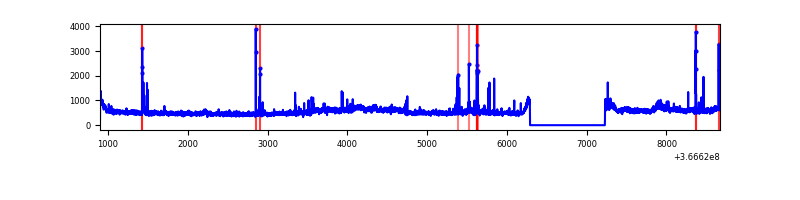 |
Top three noisy pixels from each quadrant. If the there are fewer than three noisy pixels in the level2.evt file, extra rows are filled as -1
| Pixel properties | Quadrant properties | ||||||
|---|---|---|---|---|---|---|---|
| Quadrant | DetID | PixID | Counts | Sigma | Mean | Median | Sigma |
| A | 0 | 13 | 507302 | 2901.81 | 873 | 859 | 174.5 |
| A | 13 | 254 | 12568 | 67.09 | 873 | 859 | 174.5 |
| A | 3 | 137 | 8758 | 45.26 | 873 | 859 | 174.5 |
| B | 6 | 159 | 1799027 | 10783.75 | 862 | 842 | 166.7 |
| B | 0 | 229 | 35247 | 206.33 | 862 | 842 | 166.7 |
| B | 0 | 183 | 26024 | 151.02 | 862 | 842 | 166.7 |
| C | 0 | 10 | 177542 | 896.83 | 833 | 840 | 197.0 |
| C | 14 | 238 | 133886 | 675.26 | 833 | 840 | 197.0 |
| C | 3 | 233 | 25615 | 125.74 | 833 | 840 | 197.0 |
| D | 8 | 195 | 508967 | 2551.28 | 840 | 818 | 199.2 |
| D | 2 | 250 | 101422 | 505.11 | 840 | 818 | 199.2 |
| D | 12 | 218 | 38761 | 190.5 | 840 | 818 | 199.2 |
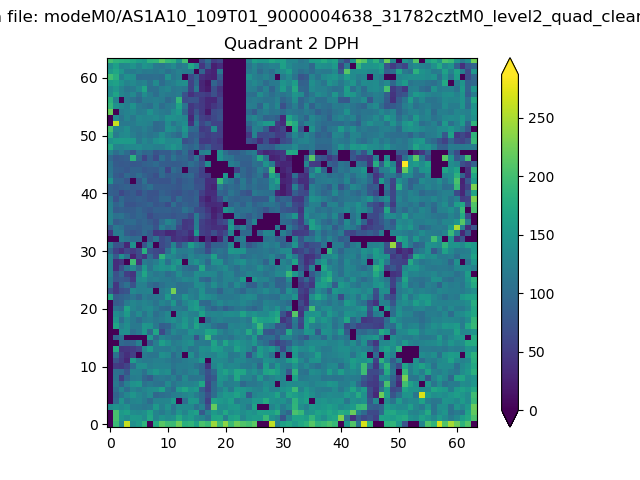
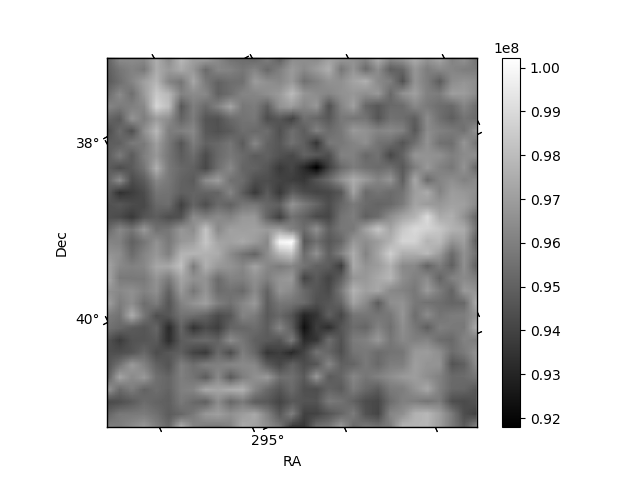
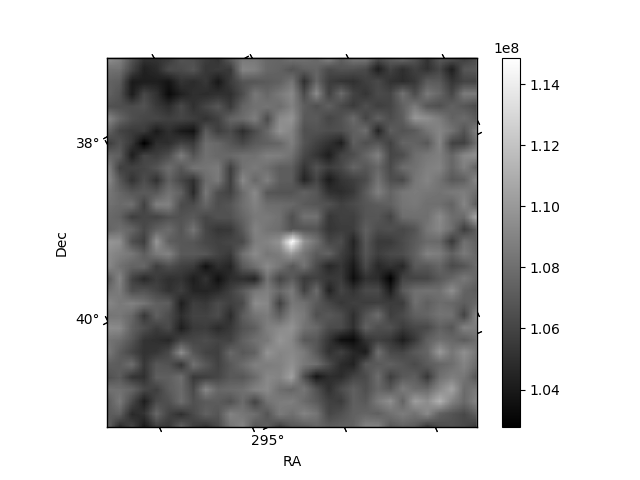
Histogram calculated using DETX and DETY for each event in the final _common_clean file
| Quadrant A | 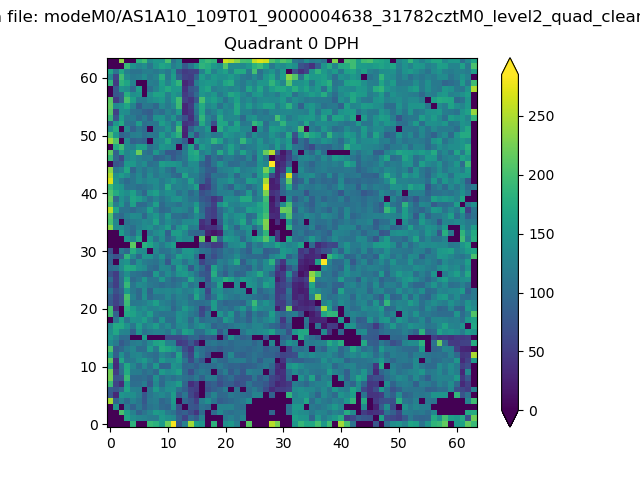 |
 |
Quadrant B |
|---|---|---|---|
| Quadrant D |  |
 |
Quadrant C |
| Plot type | Count rate plots | Images |
|---|---|---|
| Comparison with Poisson distribution Blue bars denote a histogram of data divided into 1 sec bins. Red curve is a Poisson curve with rate = median count rate of data. |
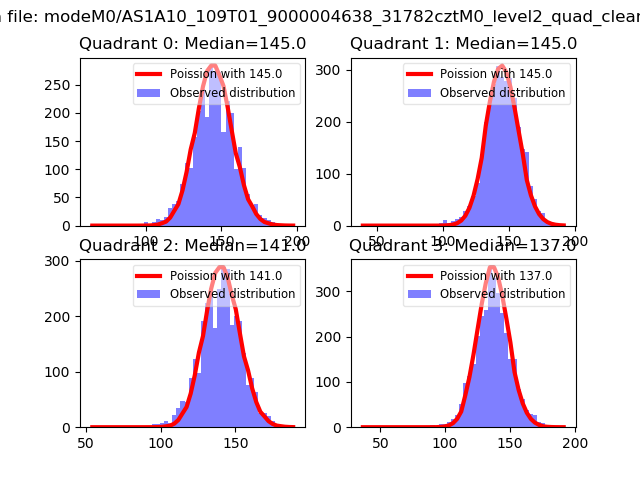 |
 |
| Quadrant-wise count rates Data is divided into 100 sec bins |
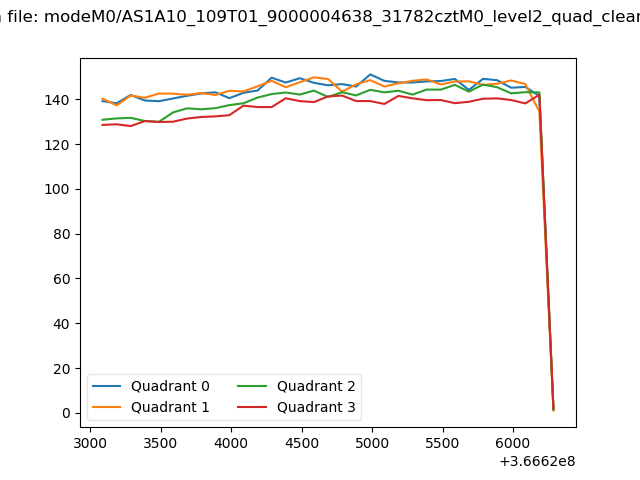 |
|
| Module-wise count rates for Quadrant A Data is divided into 100 sec bins |
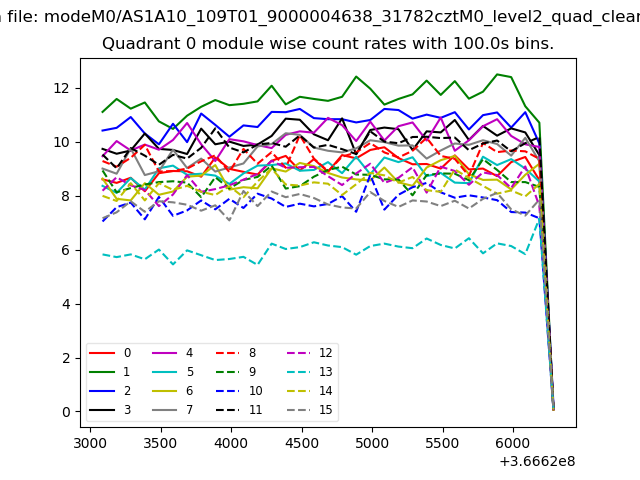 |
 |
| Module-wise count rates for Quadrant B Data is divided into 100 sec bins |
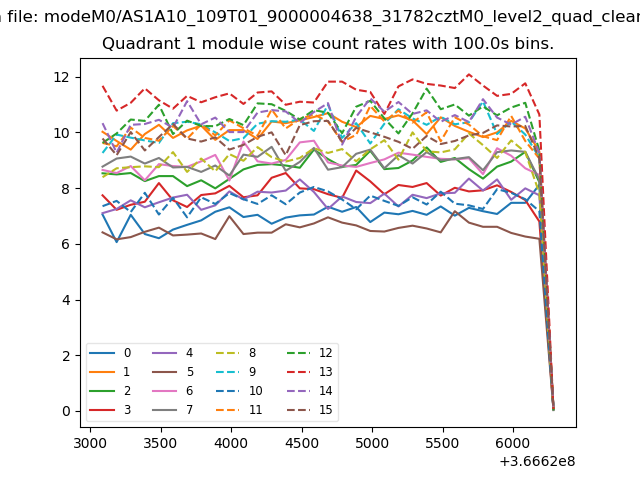 |
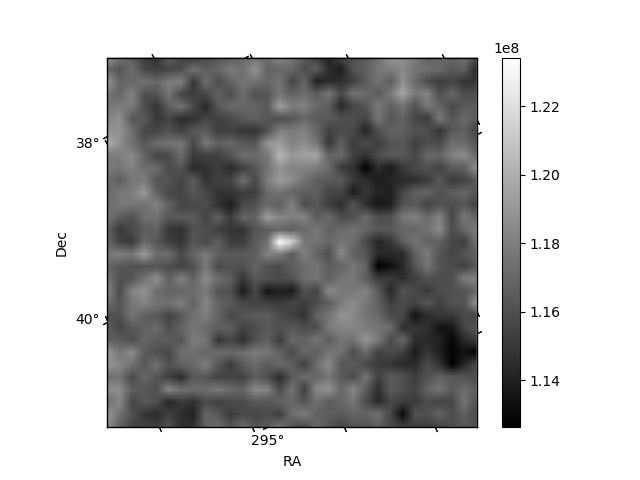 |
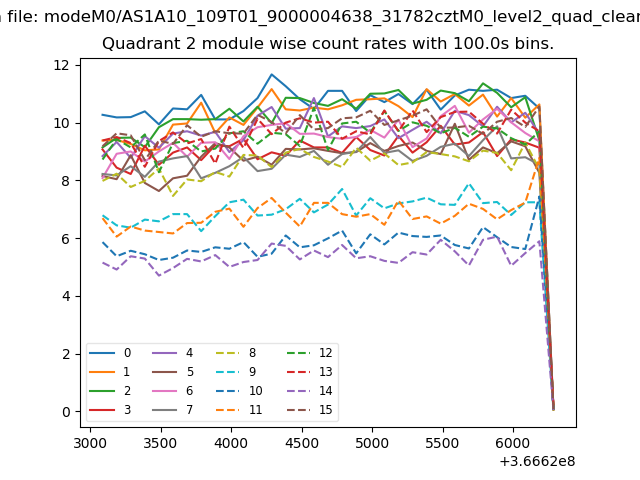
| Module-wise count rates for Quadrant C Data is divided into 100 sec bins |
 |
 |
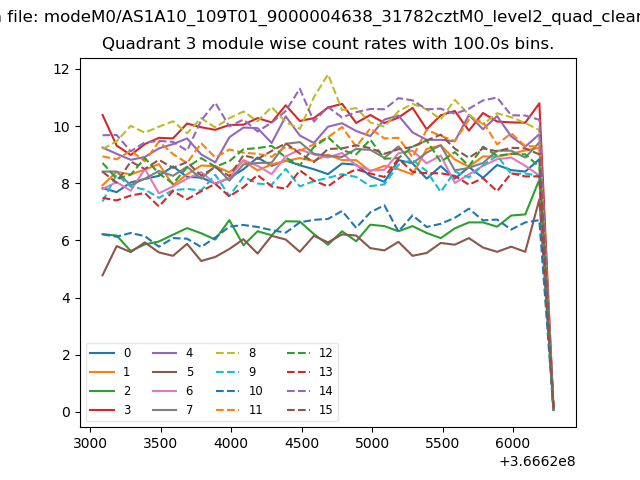
| Module-wise count rates for Quadrant D Data is divided into 100 sec bins |
 |
 |
| Parameter | Plot |
|---|---|
| CZT HV Monitor |  |
| D_VDD | 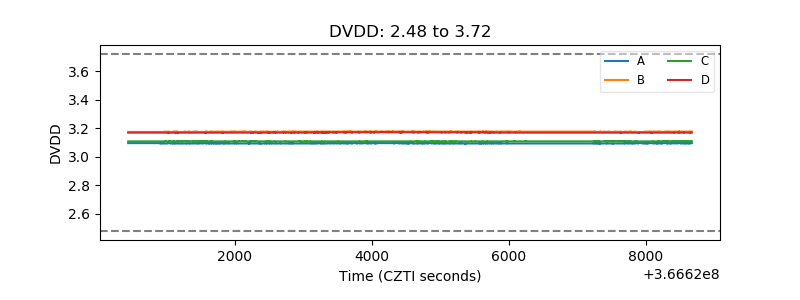 |
| Temperature 1 |  |
| Veto HV Monitor | 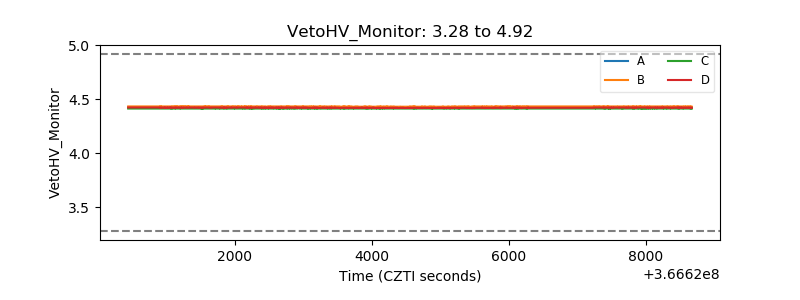 |
| Veto LLD | 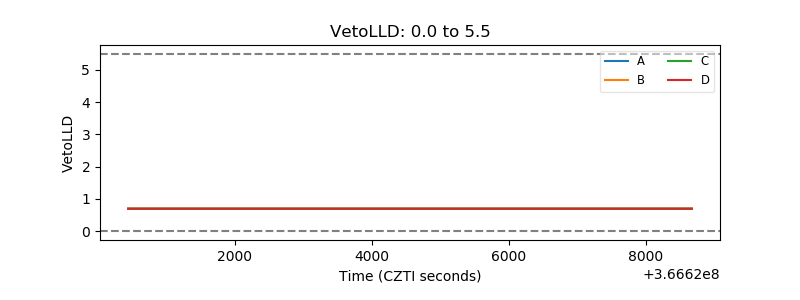 |
| Alpha Counter | 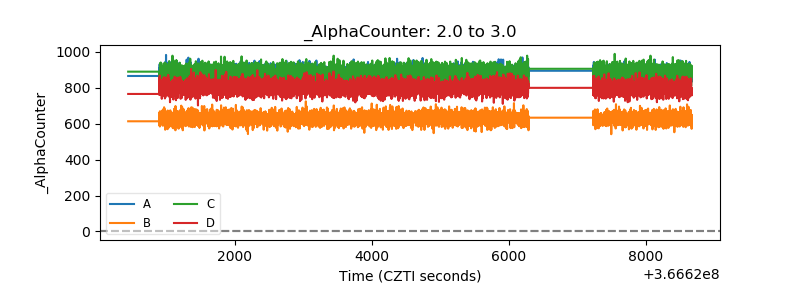 |
| _CPM_Rate | 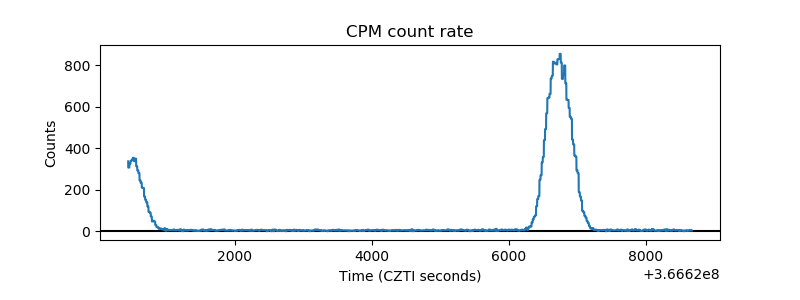 |
| CZT Counter | 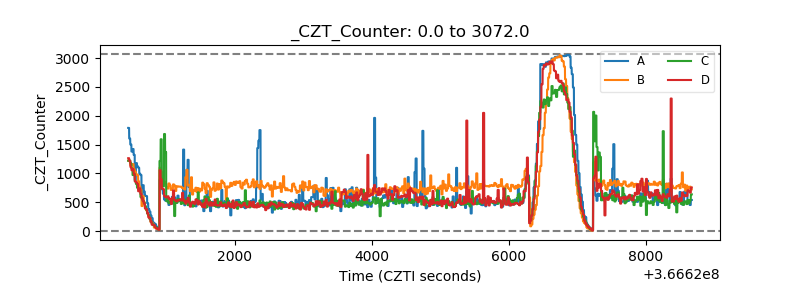 |
| +2.5 Volts monitor |  |
| +5 Volts monitor |  |
| _ROLL_ROT | 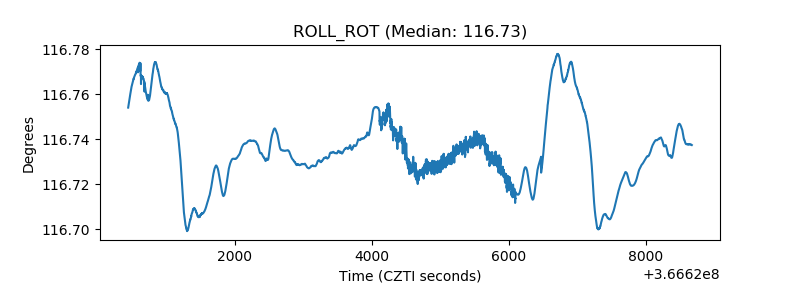 |
| _Roll_DEC | 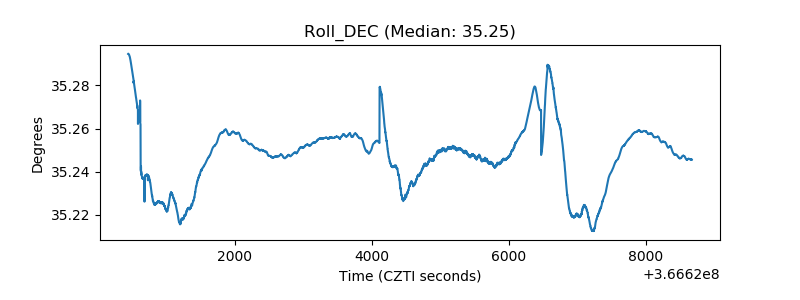 |
| _Roll_RA | 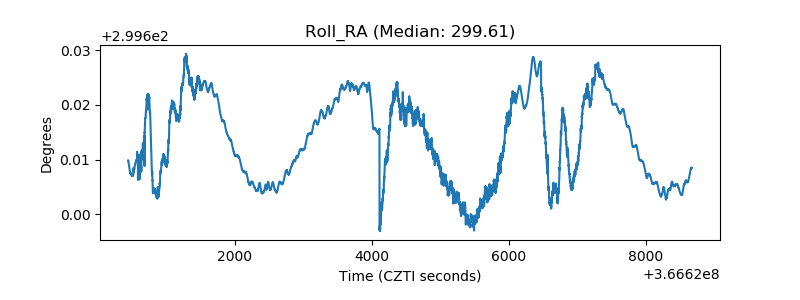 |
| Veto Counter | 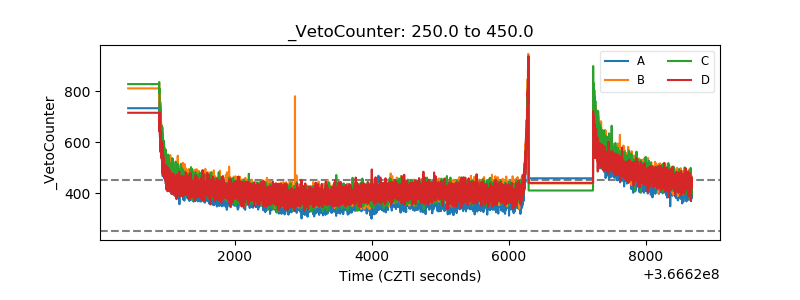 |