| Param | Original file | Final file |
|---|---|---|
| Filename | modeM0/AS1A10_109T01_9000004638_31785cztM0_level2.evt | modeM0/AS1A10_109T01_9000004638_31785cztM0_level2_quad_clean.evt |
| Size (bytes) | 639,469,440 | 111,902,400 |
| Size | 609.8 MB | 106.7 MB |
| Events in quadrant A | 4,232,997 | 747,330 |
| Events in quadrant B | 5,707,895 | 746,989 |
| Events in quadrant C | 4,106,408 | 717,338 |
| Events in quadrant D | 4,848,770 | 692,447 |
| Mode M0 | |||
|---|---|---|---|
| Quadrant | BADHDUFLAG | Total packets | Discarded packets |
| A | 0 | 17109 | 2 |
| B | 0 | 21763 | 2 |
| C | 0 | 16535 | 2 |
| D | 0 | 18954 | 2 |
| Mode M9 | |||
|---|---|---|---|
| Quadrant | BADHDUFLAG | Total packets | Discarded packets |
| A | 0 | 23 | 0 |
| B | 0 | 23 | 0 |
| C | 0 | 23 | 0 |
| D | 0 | 23 | 0 |
| Mode SS | |||
|---|---|---|---|
| Quadrant | BADHDUFLAG | Total packets | Discarded packets |
| A | 0 | 144 | 0 |
| B | 0 | 144 | 0 |
| C | 0 | 144 | 0 |
| D | 0 | 144 | 0 |
| Quadrant | Total seconds | Saturated seconds | Saturation percentage |
|---|---|---|---|
| A | 6957 | 223 | 3.205405% |
| B | 6957 | 205 | 2.946672% |
| C | 6958 | 268 | 3.851682% |
| D | 6958 | 231 | 3.319920% |
Noise dominated data is calculated using 1-second bins in cleaned event files. If a bin has >2000 counts, and if more than 50% of those come from <1% of pixels, then it is considered to be noise-dominated and hence unusable.
| Quadrant | # 1 sec bins | Bins with >0 counts | Bins with >2000 counts | High rate bins dominated by noise | Noise dominated (total time) | Noise dominated (detector-on time) | Marked lightcurve |
|---|---|---|---|---|---|---|---|
| A | 9227 | 6959 | 60 | 60 | 0.65% | 0.86% | 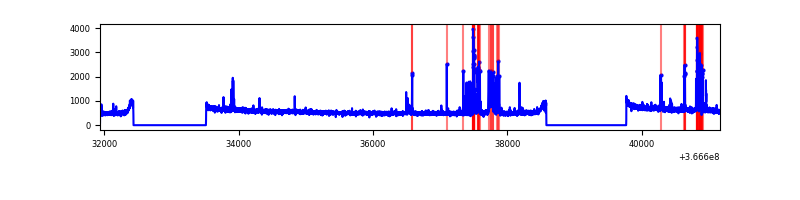 |
| B | 9227 | 6959 | 1 | 1 | 0.01% | 0.01% | 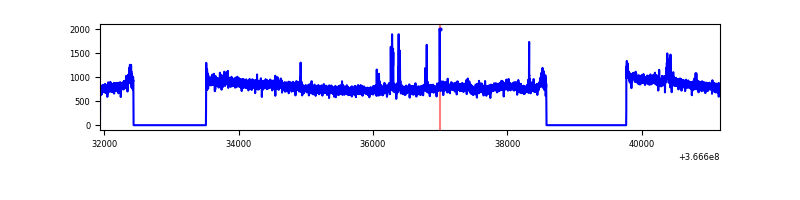 |
| C | 9228 | 6960 | 23 | 23 | 0.25% | 0.33% | 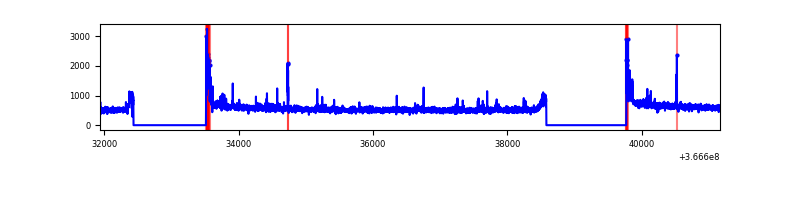 |
| D | 9228 | 6960 | 122 | 122 | 1.32% | 1.75% | 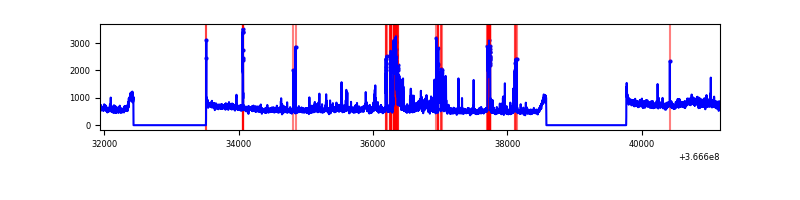 |
Top three noisy pixels from each quadrant. If the there are fewer than three noisy pixels in the level2.evt file, extra rows are filled as -1
| Pixel properties | Quadrant properties | ||||||
|---|---|---|---|---|---|---|---|
| Quadrant | DetID | PixID | Counts | Sigma | Mean | Median | Sigma |
| A | 0 | 13 | 402476 | 2050.76 | 992 | 979 | 195.8 |
| A | 13 | 254 | 12932 | 61.05 | 992 | 979 | 195.8 |
| A | 3 | 137 | 9359 | 42.8 | 992 | 979 | 195.8 |
| B | 6 | 159 | 1804365 | 9808.28 | 968 | 949 | 183.9 |
| B | 0 | 229 | 52723 | 281.58 | 968 | 949 | 183.9 |
| B | 0 | 190 | 32234 | 170.15 | 968 | 949 | 183.9 |
| C | 0 | 10 | 233544 | 1059.51 | 937 | 946 | 219.5 |
| C | 14 | 238 | 155417 | 703.63 | 937 | 946 | 219.5 |
| C | 3 | 233 | 24306 | 106.41 | 937 | 946 | 219.5 |
| D | 12 | 218 | 588127 | 2574.81 | 956 | 935 | 228.1 |
| D | 8 | 195 | 516463 | 2260.57 | 956 | 935 | 228.1 |
| D | 7 | 223 | 61713 | 266.51 | 956 | 935 | 228.1 |
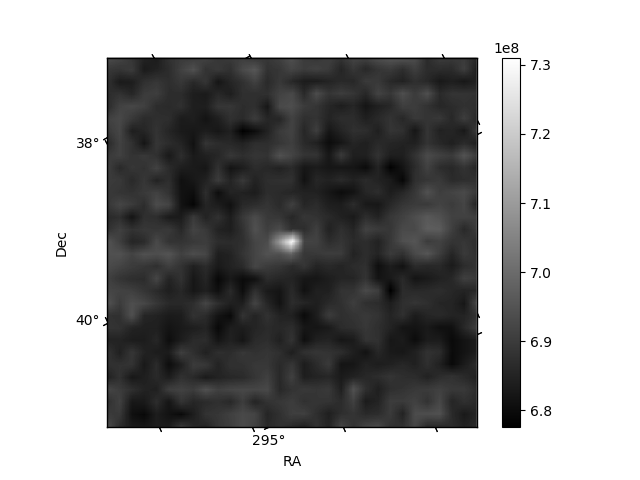
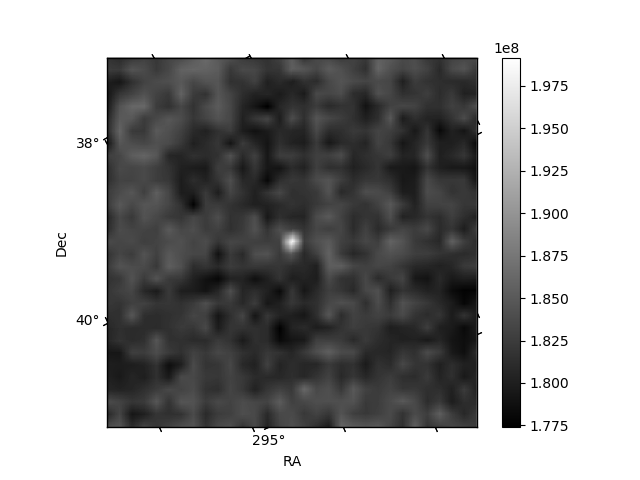
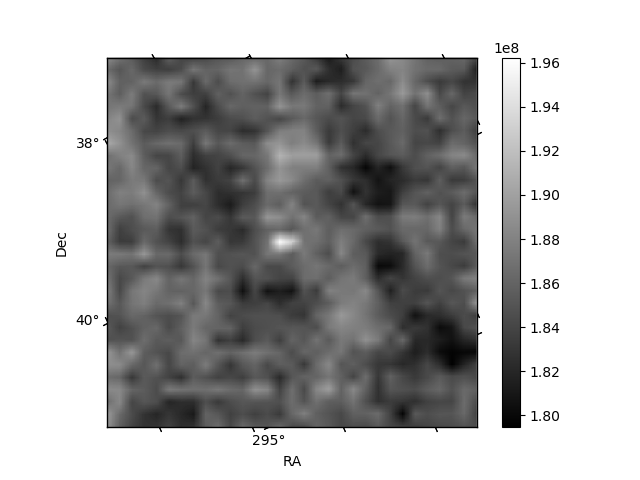
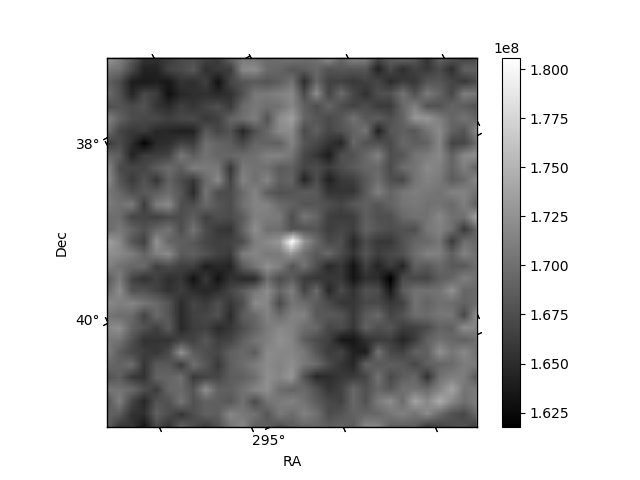
Histogram calculated using DETX and DETY for each event in the final _common_clean file
| Quadrant A | 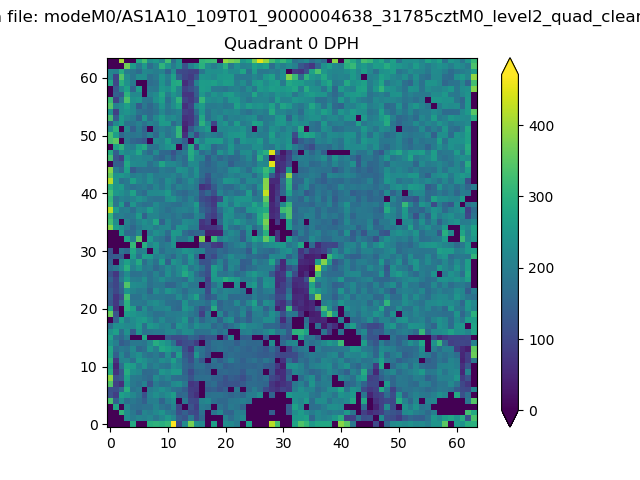 |
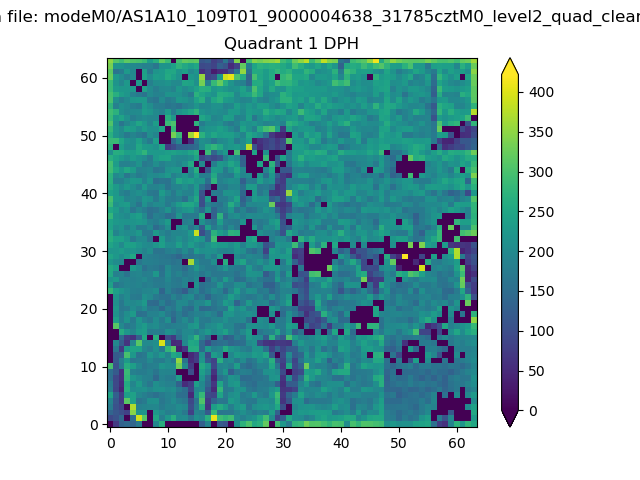 |
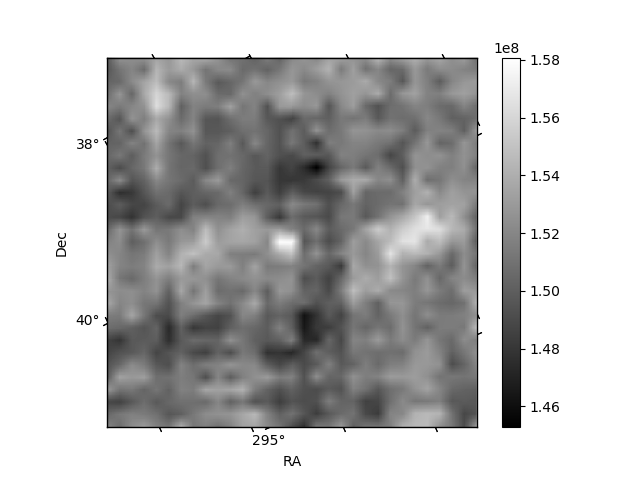
Quadrant B |
|---|---|---|---|
| Quadrant D |  |
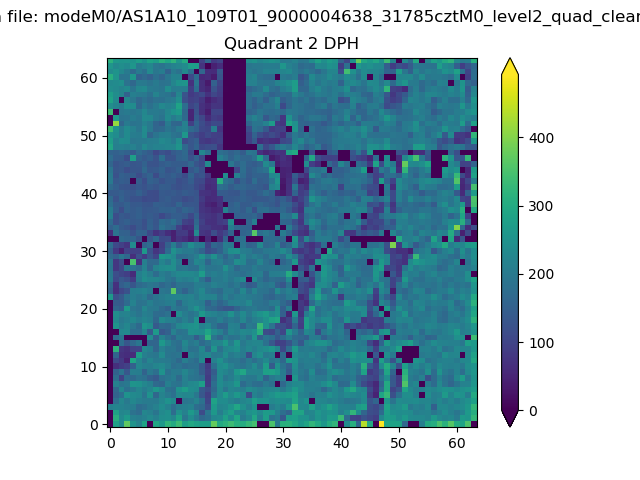 |
Quadrant C |
| Plot type | Count rate plots | Images |
|---|---|---|
| Comparison with Poisson distribution Blue bars denote a histogram of data divided into 1 sec bins. Red curve is a Poisson curve with rate = median count rate of data. |
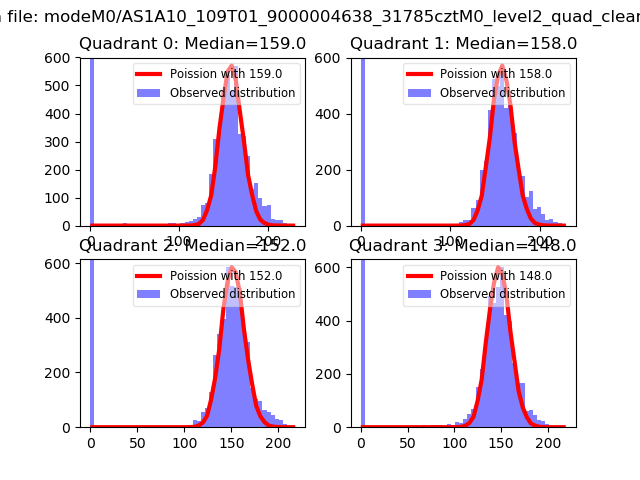 |
 |
| Quadrant-wise count rates Data is divided into 100 sec bins |
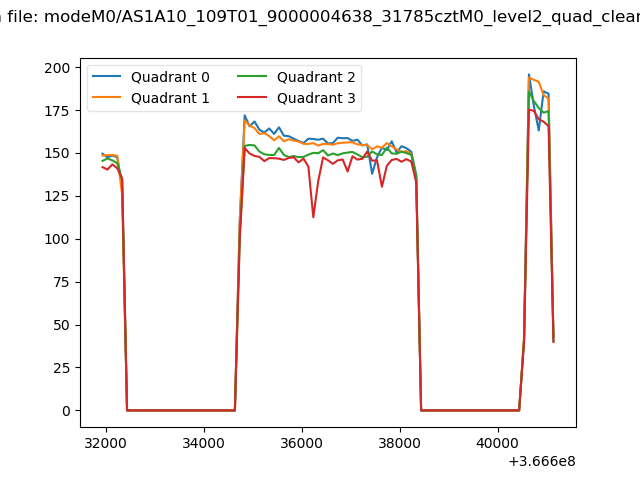 |
|
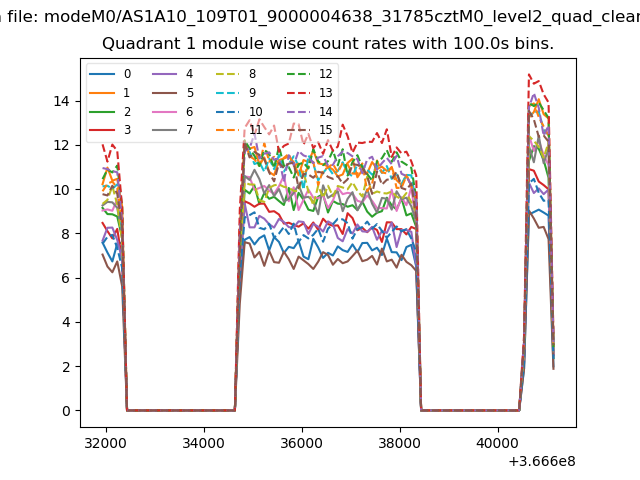
| Module-wise count rates for Quadrant A Data is divided into 100 sec bins |
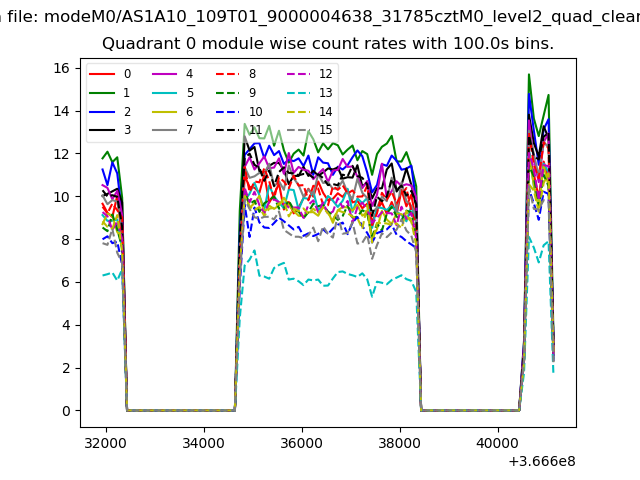 |
 |
| Module-wise count rates for Quadrant B Data is divided into 100 sec bins |
 |
 |
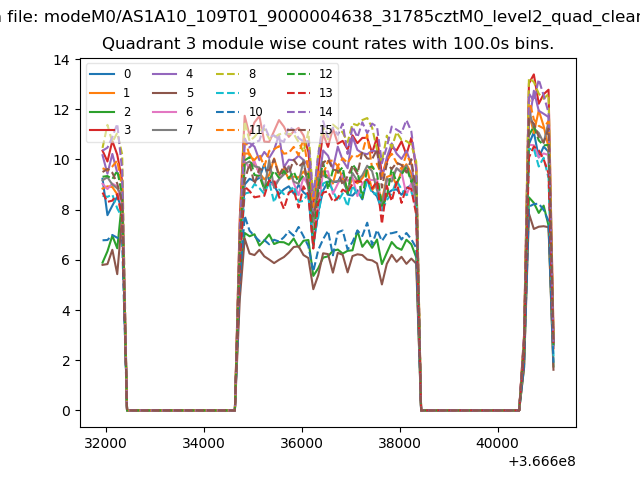
| Module-wise count rates for Quadrant C Data is divided into 100 sec bins |
 |
 |
| Module-wise count rates for Quadrant D Data is divided into 100 sec bins |
 |
 |
| Parameter | Plot |
|---|---|
| CZT HV Monitor |  |
| D_VDD | 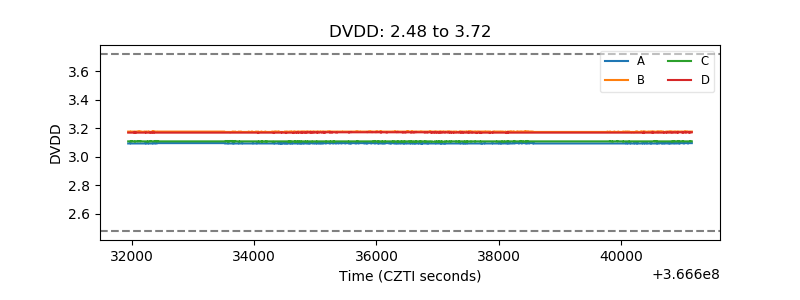 |
| Temperature 1 | 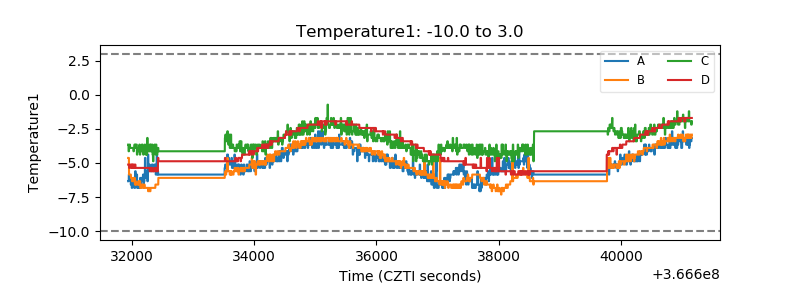 |
| Veto HV Monitor | 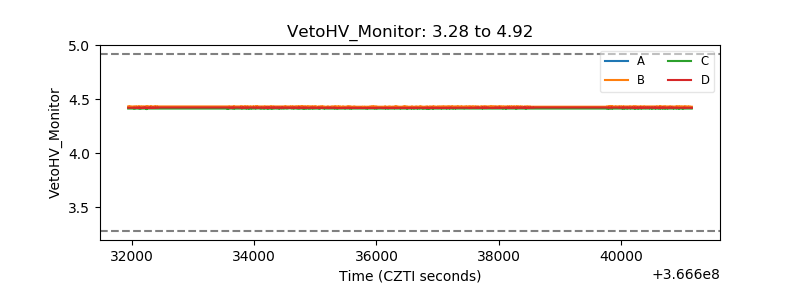 |
| Veto LLD | 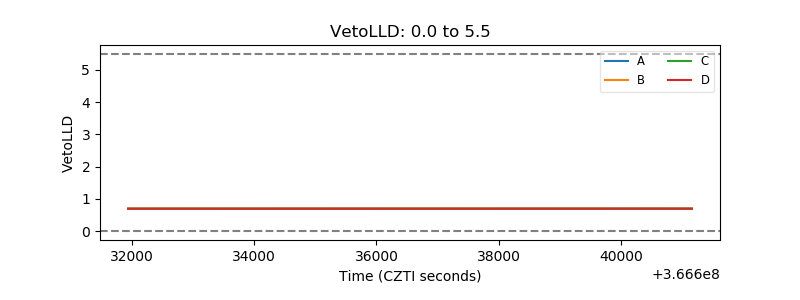 |
| Alpha Counter | 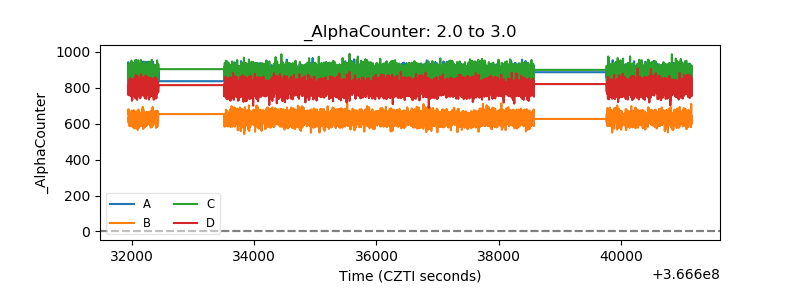 |
| _CPM_Rate | 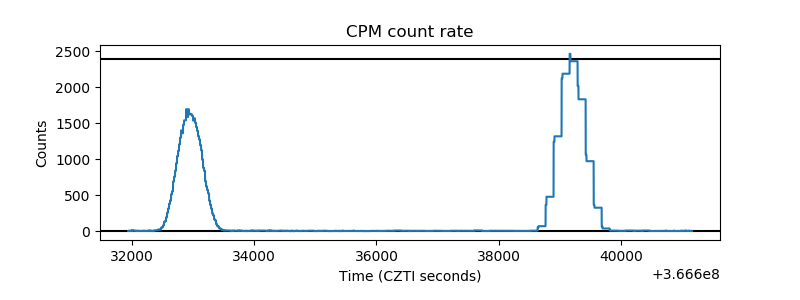 |
| CZT Counter | 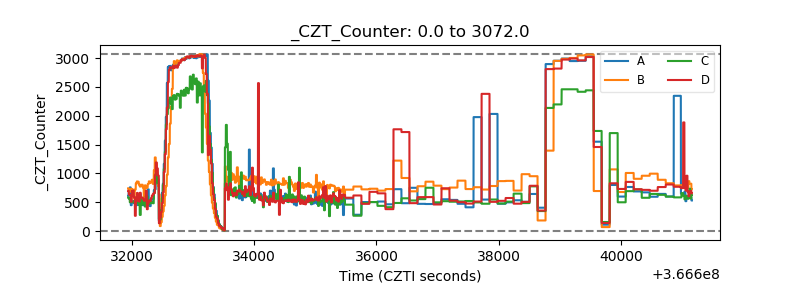 |
| +2.5 Volts monitor |  |
| +5 Volts monitor | 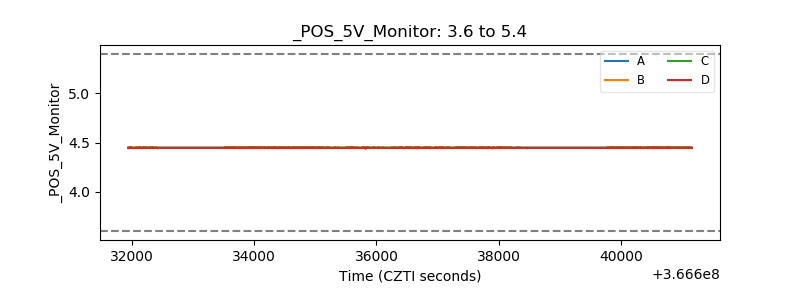 |
| _ROLL_ROT | 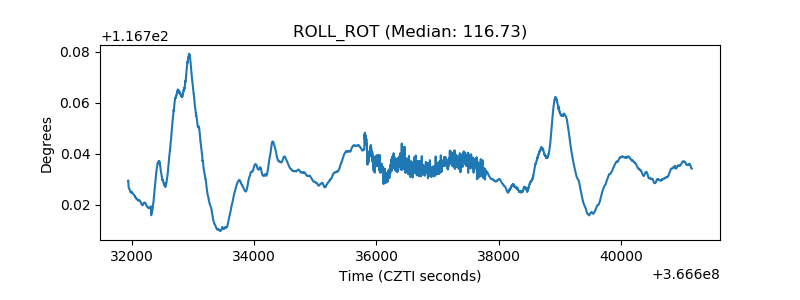 |
| _Roll_DEC | 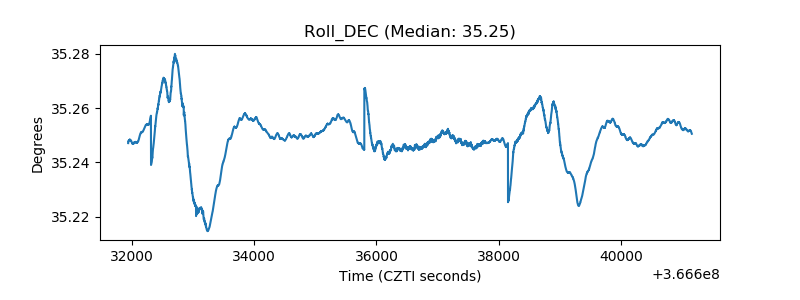 |
| _Roll_RA | 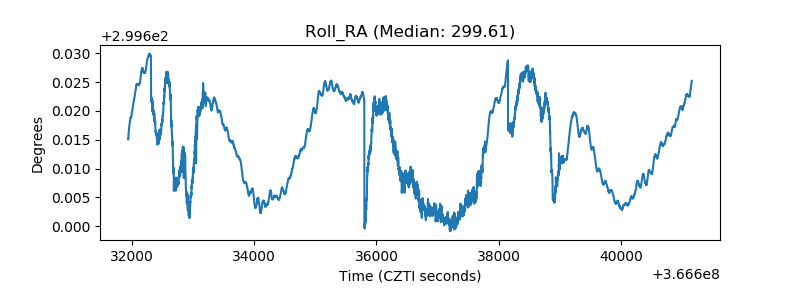 |
| Veto Counter | 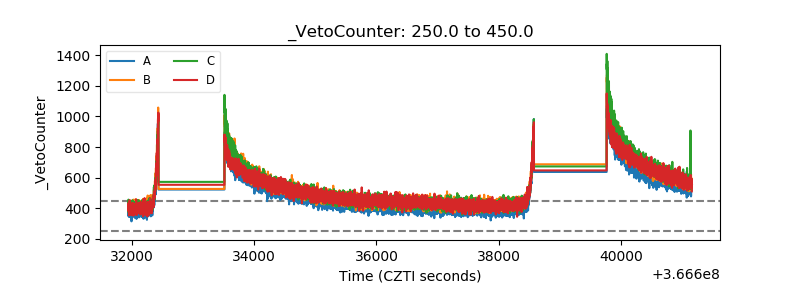 |