| Param | Original file | Final file |
|---|---|---|
| Filename | modeM0/AS1A10_109T01_9000004638_31786cztM0_level2.evt | modeM0/AS1A10_109T01_9000004638_31786cztM0_level2_quad_clean.evt |
| Size (bytes) | 201,971,520 | 29,658,240 |
| Size | 192.6 MB | 28.3 MB |
| Events in quadrant A | 1,513,921 | 192,410 |
| Events in quadrant B | 1,695,720 | 196,591 |
| Events in quadrant C | 1,297,511 | 186,218 |
| Events in quadrant D | 1,475,242 | 180,389 |
| Mode M0 | |||
|---|---|---|---|
| Quadrant | BADHDUFLAG | Total packets | Discarded packets |
| A | 0 | 6034 | 1 |
| B | 0 | 6350 | 1 |
| C | 0 | 5258 | 1 |
| D | 0 | 5830 | 1 |
| Mode M9 | |||
|---|---|---|---|
| Quadrant | BADHDUFLAG | Total packets | Discarded packets |
| A | 0 | 12 | 0 |
| B | 0 | 12 | 0 |
| C | 0 | 12 | 0 |
| D | 0 | 12 | 0 |
| Mode SS | |||
|---|---|---|---|
| Quadrant | BADHDUFLAG | Total packets | Discarded packets |
| A | 0 | 40 | 0 |
| B | 0 | 40 | 0 |
| C | 0 | 40 | 0 |
| D | 0 | 40 | 0 |
| Quadrant | Total seconds | Saturated seconds | Saturation percentage |
|---|---|---|---|
| A | 1955 | 125 | 6.393862% |
| B | 1955 | 78 | 3.989770% |
| C | 1956 | 115 | 5.879346% |
| D | 1956 | 51 | 2.607362% |
Noise dominated data is calculated using 1-second bins in cleaned event files. If a bin has >2000 counts, and if more than 50% of those come from <1% of pixels, then it is considered to be noise-dominated and hence unusable.
| Quadrant | # 1 sec bins | Bins with >0 counts | Bins with >2000 counts | High rate bins dominated by noise | Noise dominated (total time) | Noise dominated (detector-on time) | Marked lightcurve |
|---|---|---|---|---|---|---|---|
| A | 3145 | 1956 | 45 | 45 | 1.43% | 2.30% | 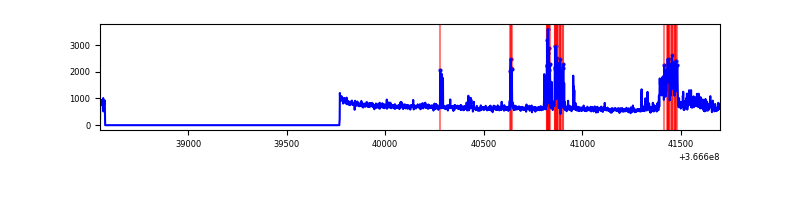 |
| B | 3145 | 1956 | 0 | 0 | 0.00% | 0.00% | 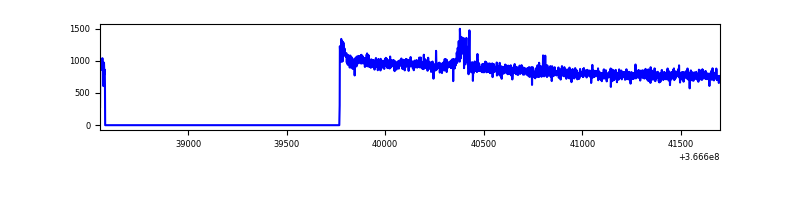 |
| C | 3146 | 1957 | 7 | 7 | 0.22% | 0.36% | 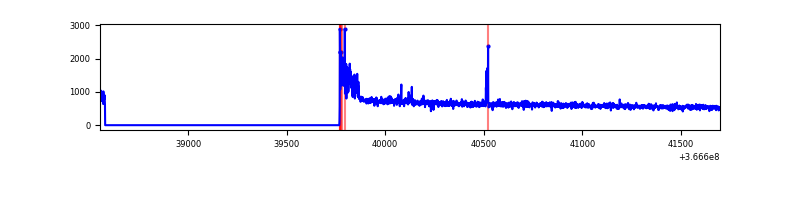 |
| D | 3146 | 1957 | 5 | 5 | 0.16% | 0.26% | 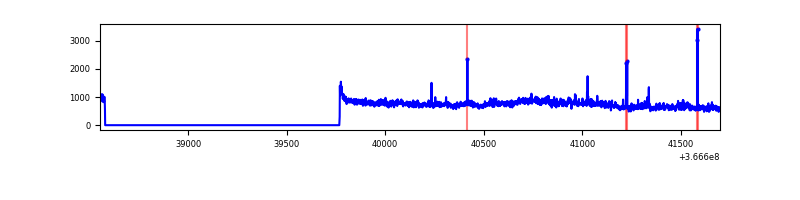 |
Top three noisy pixels from each quadrant. If the there are fewer than three noisy pixels in the level2.evt file, extra rows are filled as -1
| Pixel properties | Quadrant properties | ||||||
|---|---|---|---|---|---|---|---|
| Quadrant | DetID | PixID | Counts | Sigma | Mean | Median | Sigma |
| A | 0 | 13 | 304222 | 4848.85 | 313 | 309 | 62.7 |
| A | 13 | 254 | 3205 | 46.2 | 313 | 309 | 62.7 |
| A | 3 | 137 | 2737 | 38.74 | 313 | 309 | 62.7 |
| B | 6 | 159 | 472848 | 8156.5 | 304 | 299 | 57.9 |
| B | 0 | 190 | 24281 | 413.94 | 304 | 299 | 57.9 |
| B | 12 | 111 | 6525 | 107.46 | 304 | 299 | 57.9 |
| C | 0 | 10 | 86377 | 1244.58 | 294 | 297 | 69.2 |
| C | 14 | 238 | 49571 | 712.43 | 294 | 297 | 69.2 |
| C | 4 | 175 | 7742 | 107.64 | 294 | 297 | 69.2 |
| D | 8 | 195 | 261879 | 3597.36 | 304 | 298 | 72.7 |
| D | 7 | 223 | 28811 | 392.12 | 304 | 298 | 72.7 |
| D | 2 | 250 | 13111 | 176.21 | 304 | 298 | 72.7 |
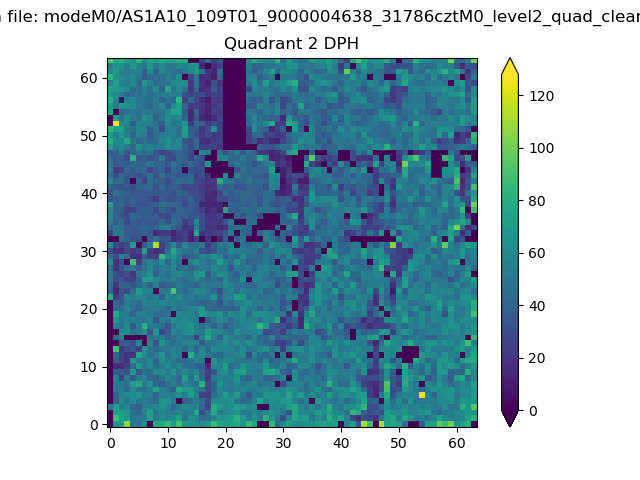
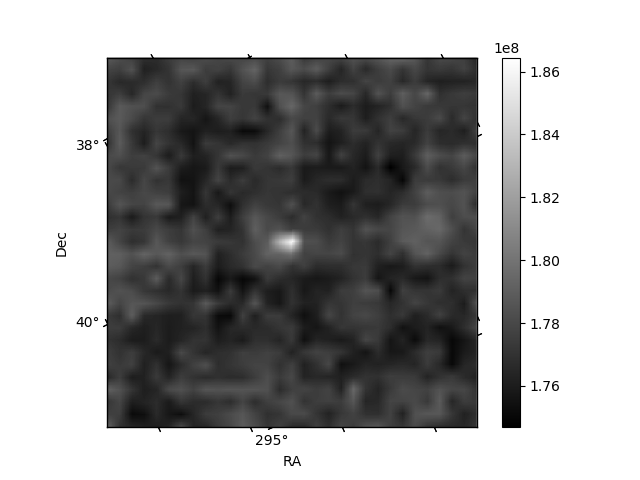
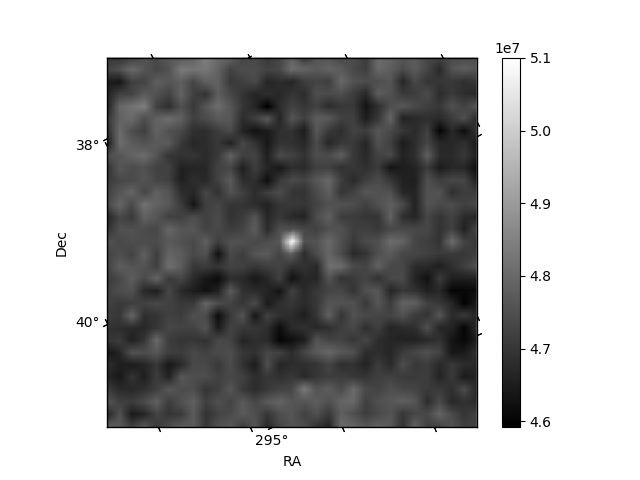
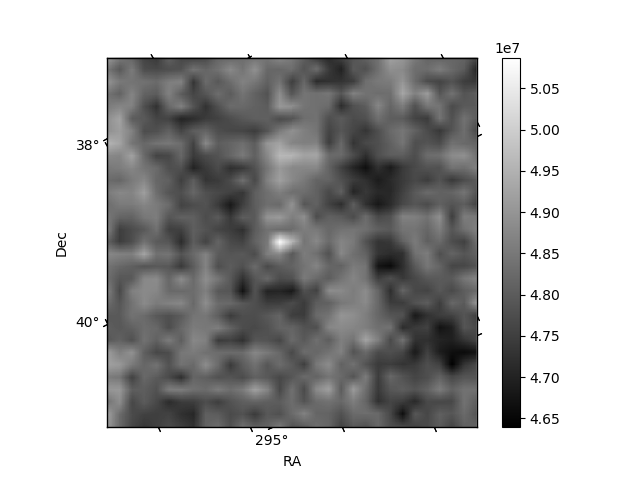
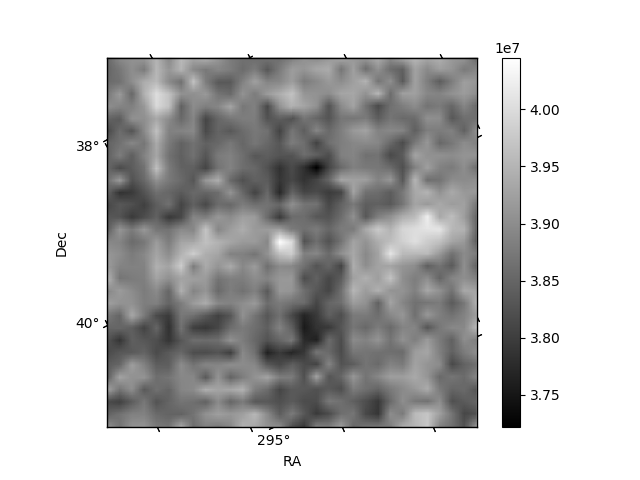
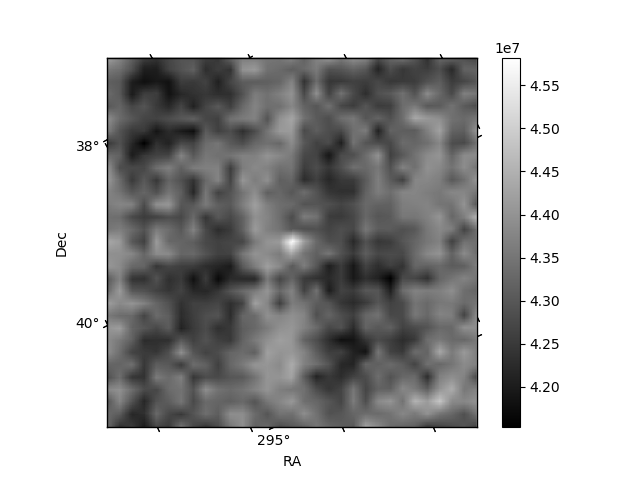
Histogram calculated using DETX and DETY for each event in the final _common_clean file
| Quadrant A | 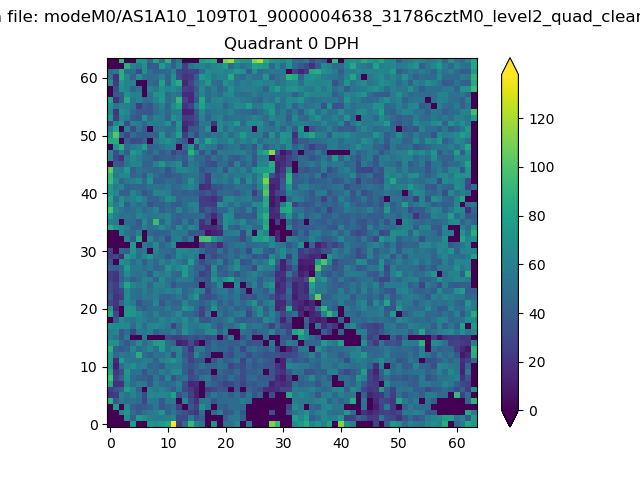 |
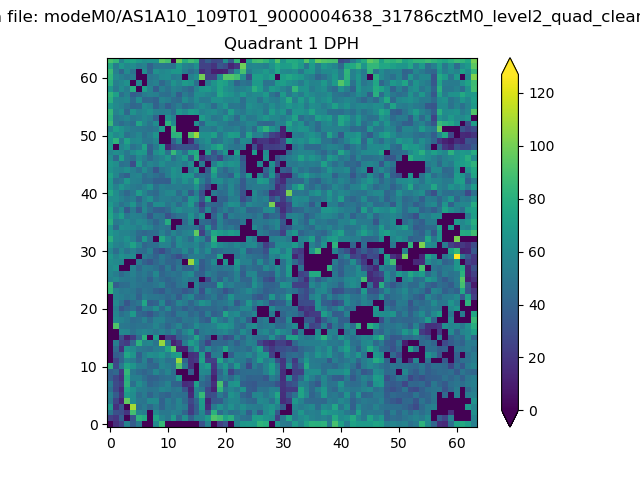 |
Quadrant B |
|---|---|---|---|
| Quadrant D | 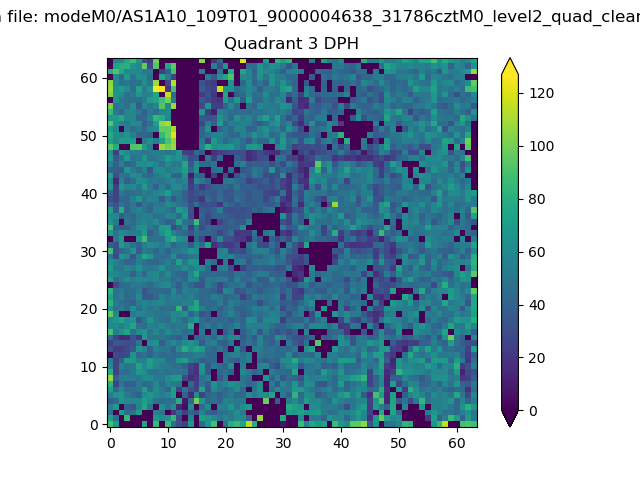 |
 |
Quadrant C |
| Plot type | Count rate plots | Images |
|---|---|---|
| Comparison with Poisson distribution Blue bars denote a histogram of data divided into 1 sec bins. Red curve is a Poisson curve with rate = median count rate of data. |
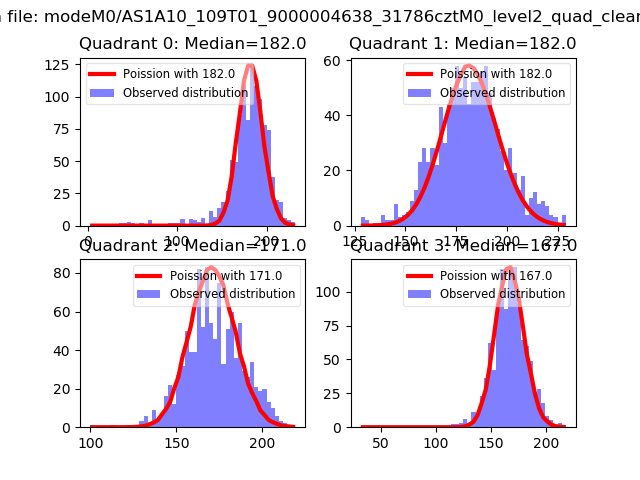 |
 |
| Quadrant-wise count rates Data is divided into 100 sec bins |
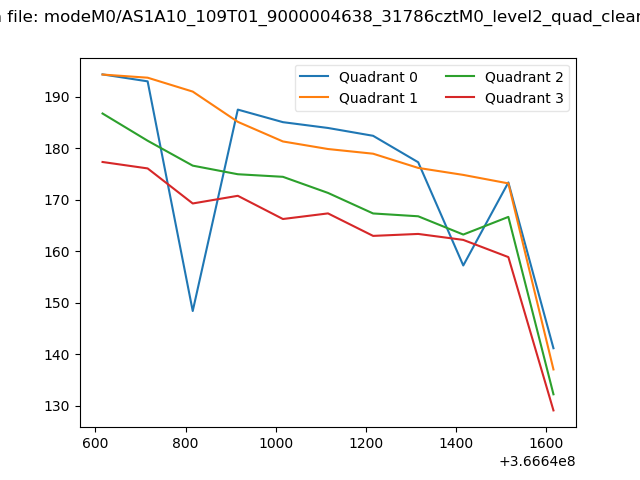 |
|
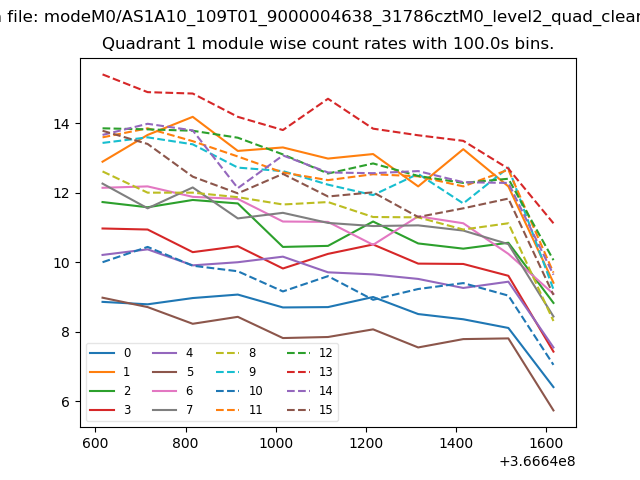
| Module-wise count rates for Quadrant A Data is divided into 100 sec bins |
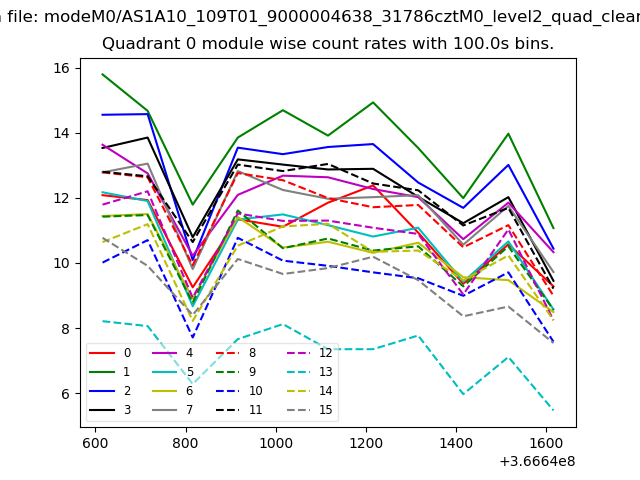 |
 |
| Module-wise count rates for Quadrant B Data is divided into 100 sec bins |
 |
 |
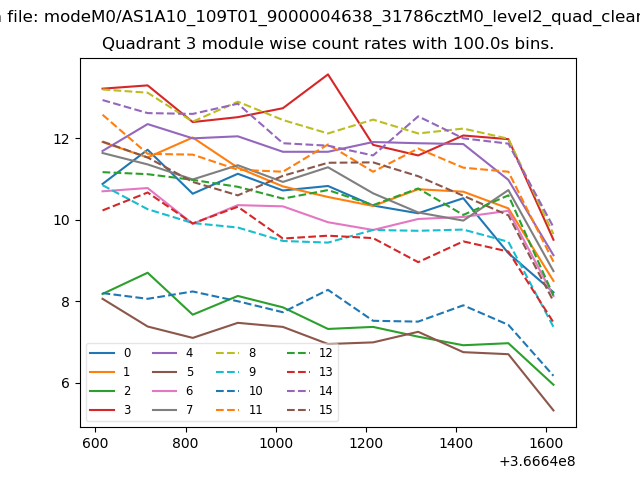
| Module-wise count rates for Quadrant C Data is divided into 100 sec bins |
 |
 |
| Module-wise count rates for Quadrant D Data is divided into 100 sec bins |
 |
 |
| Parameter | Plot |
|---|---|
| CZT HV Monitor | 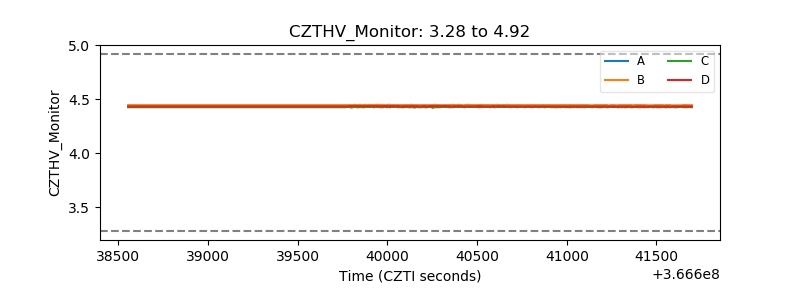 |
| D_VDD | 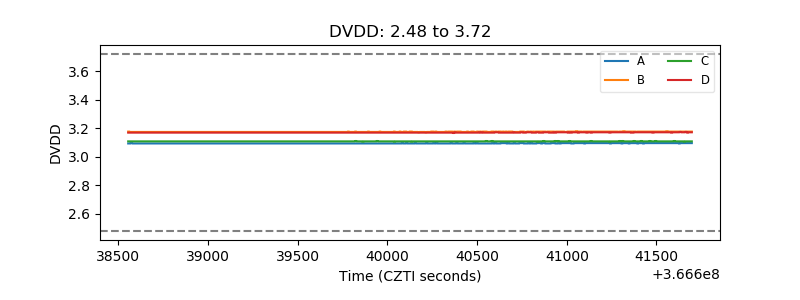 |
| Temperature 1 |  |
| Veto HV Monitor | 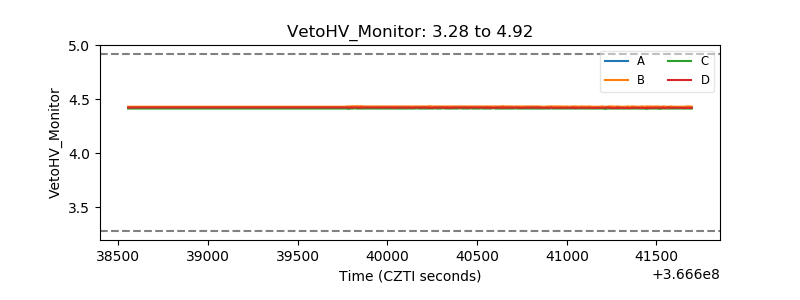 |
| Veto LLD | 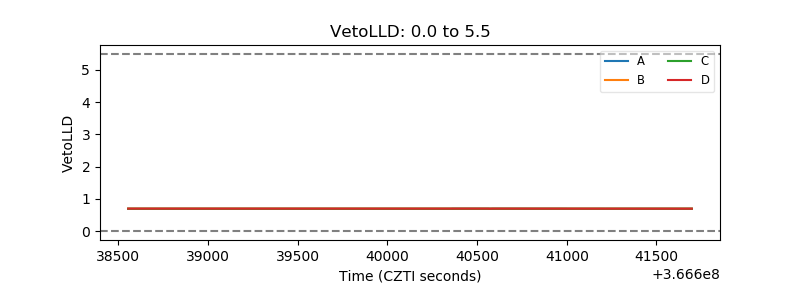 |
| Alpha Counter | 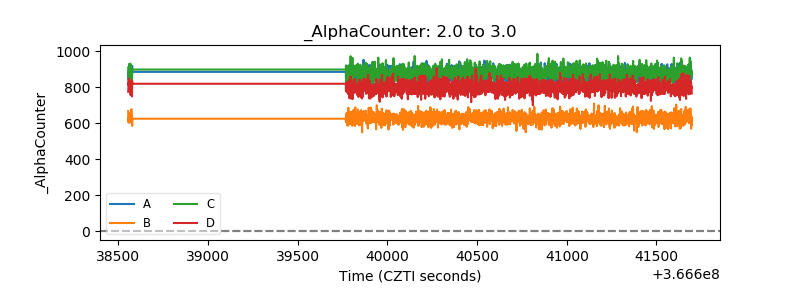 |
| _CPM_Rate | 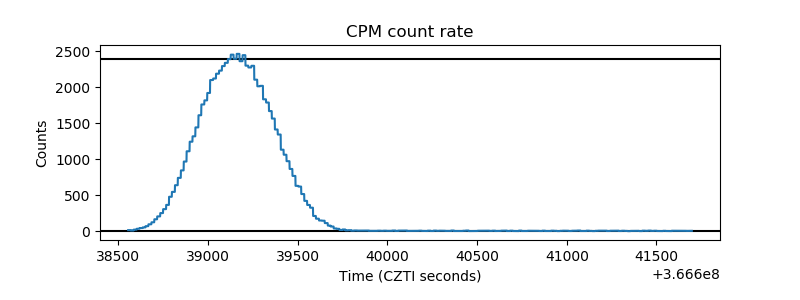 |
| CZT Counter | 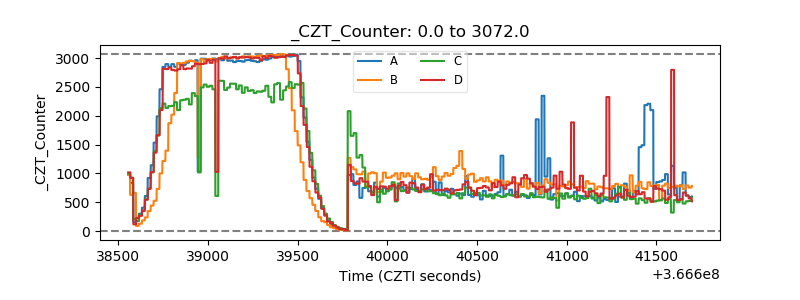 |
| +2.5 Volts monitor |  |
| +5 Volts monitor | 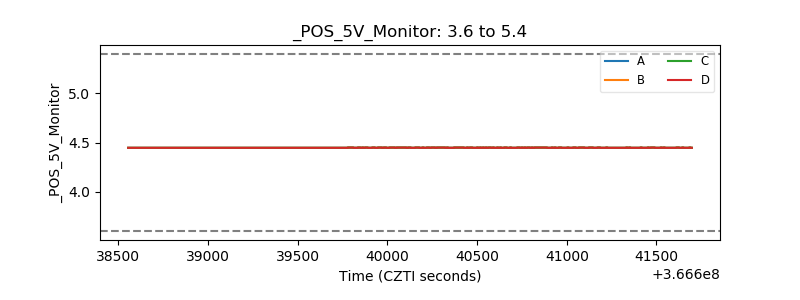 |
| _ROLL_ROT | 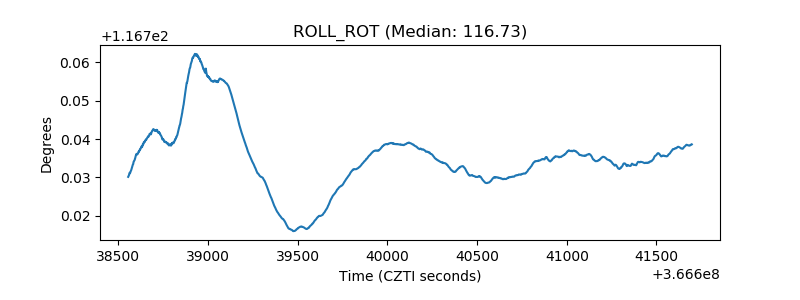 |
| _Roll_DEC | 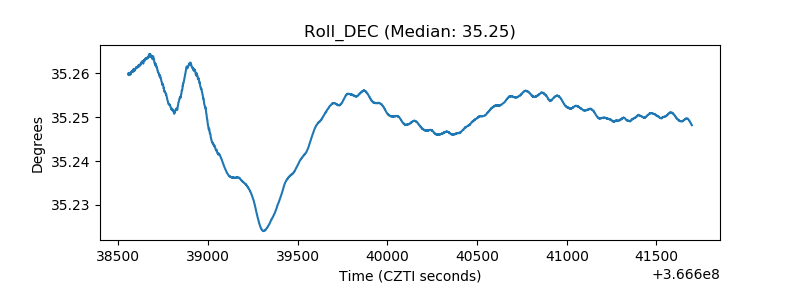 |
| _Roll_RA | 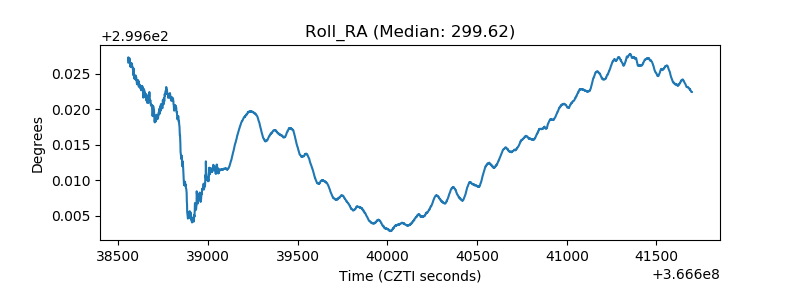 |
| Veto Counter | 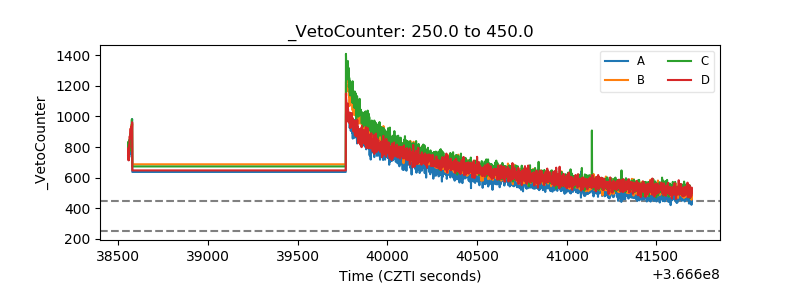 |