| Param | Original file | Final file |
|---|---|---|
| Filename | modeM0/AS1A10_109T01_9000004638_31950cztM0_level2.evt | modeM0/AS1A10_109T01_9000004638_31950cztM0_level2_quad_clean.evt |
| Size (bytes) | 414,115,200 | 31,720,320 |
| Size | 394.9 MB | 30.3 MB |
| Events in quadrant A | 1,560,105 | 214,155 |
| Events in quadrant B | 5,255,287 | 120,524 |
| Events in quadrant C | 3,179,656 | 203,593 |
| Events in quadrant D | 2,337,224 | 202,413 |
| Mode M0 | |||
|---|---|---|---|
| Quadrant | BADHDUFLAG | Total packets | Discarded packets |
| A | 0 | 6562 | 83 |
| B | 0 | 17952 | 265 |
| C | 0 | 11717 | 169 |
| D | 0 | 9144 | 108 |
| Mode M9 | |||
|---|---|---|---|
| Quadrant | BADHDUFLAG | Total packets | Discarded packets |
| A | 0 | 5 | 0 |
| B | 0 | 5 | 0 |
| C | 0 | 5 | 0 |
| D | 0 | 5 | 0 |
| Mode SS | |||
|---|---|---|---|
| Quadrant | BADHDUFLAG | Total packets | Discarded packets |
| A | 0 | 65 | 1 |
| B | 0 | 65 | 1 |
| C | 0 | 65 | 1 |
| D | 0 | 65 | 1 |
| Quadrant | Total seconds | Saturated seconds | Saturation percentage |
|---|---|---|---|
| A | 3072 | 43 | 1.399740% |
| B | 3065 | 1830 | 59.706362% |
| C | 3068 | 502 | 16.362451% |
| D | 3070 | 240 | 7.817590% |
Noise dominated data is calculated using 1-second bins in cleaned event files. If a bin has >2000 counts, and if more than 50% of those come from <1% of pixels, then it is considered to be noise-dominated and hence unusable.
| Quadrant | # 1 sec bins | Bins with >0 counts | Bins with >2000 counts | High rate bins dominated by noise | Noise dominated (total time) | Noise dominated (detector-on time) | Marked lightcurve |
|---|---|---|---|---|---|---|---|
| A | 3604 | 3075 | 0 | 0 | 0.00% | 0.00% | 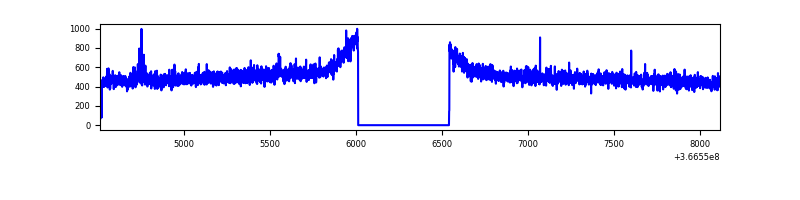 |
| B | 3602 | 3072 | 1294 | 1294 | 35.92% | 42.12% | 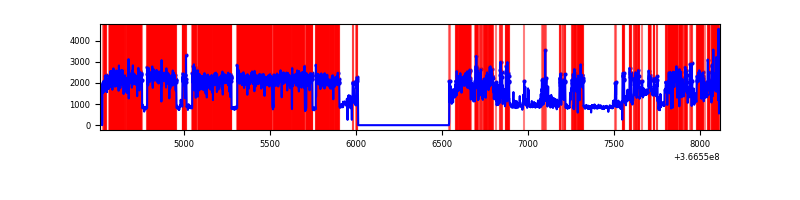 |
| C | 3602 | 3073 | 39 | 39 | 1.08% | 1.27% | 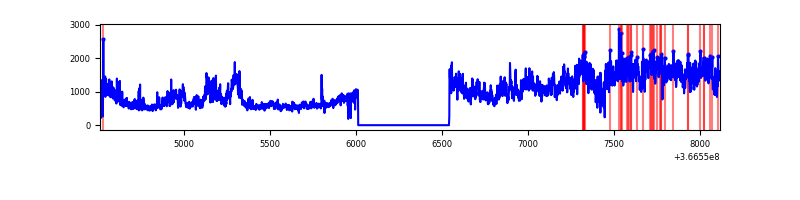 |
| D | 3606 | 3076 | 157 | 157 | 4.35% | 5.10% | 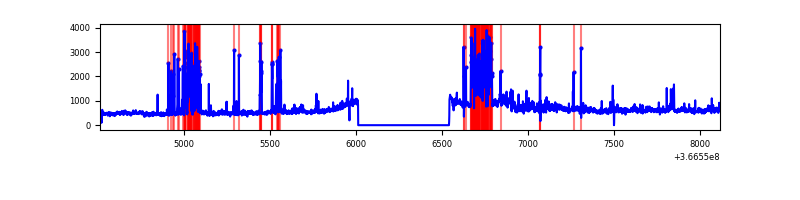 |
Top three noisy pixels from each quadrant. If the there are fewer than three noisy pixels in the level2.evt file, extra rows are filled as -1
| Pixel properties | Quadrant properties | ||||||
|---|---|---|---|---|---|---|---|
| Quadrant | DetID | PixID | Counts | Sigma | Mean | Median | Sigma |
| A | 12 | 96 | 7915 | 92.15 | 400 | 392 | 81.6 |
| A | 13 | 254 | 5882 | 67.25 | 400 | 392 | 81.6 |
| A | 13 | 6 | 5114 | 57.84 | 400 | 392 | 81.6 |
| B | 4 | 80 | 3099594 | 54259.0 | 290 | 282 | 57.1 |
| B | 6 | 159 | 727707 | 12734.88 | 290 | 282 | 57.1 |
| B | 5 | 172 | 251890 | 4404.85 | 290 | 282 | 57.1 |
| C | 3 | 233 | 1612947 | 18646.25 | 363 | 364 | 86.5 |
| C | 14 | 238 | 77576 | 892.8 | 363 | 364 | 86.5 |
| C | 14 | 254 | 28947 | 330.5 | 363 | 364 | 86.5 |
| D | 8 | 195 | 317082 | 3532.69 | 376 | 366 | 89.7 |
| D | 2 | 120 | 244230 | 2720.09 | 376 | 366 | 89.7 |
| D | 13 | 249 | 229103 | 2551.36 | 376 | 366 | 89.7 |
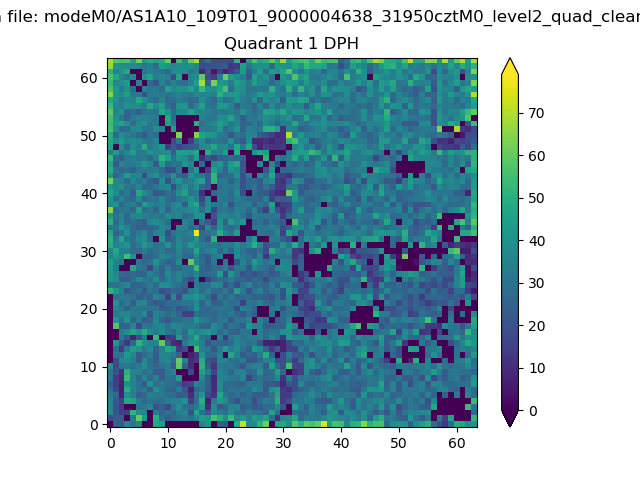
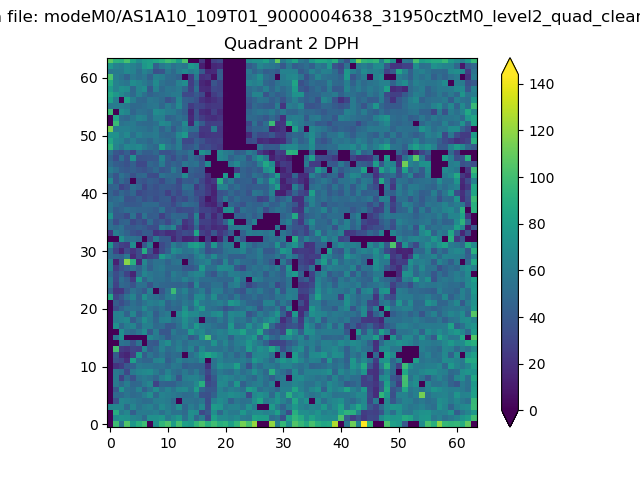
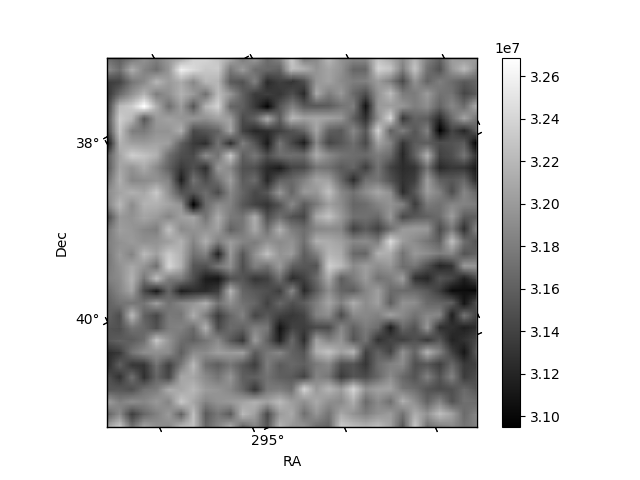
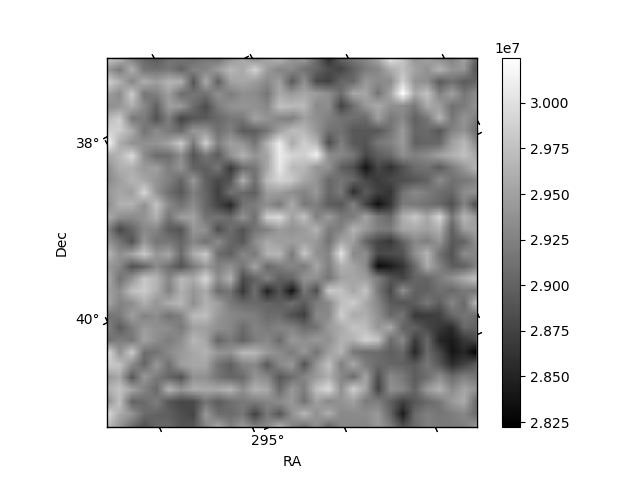
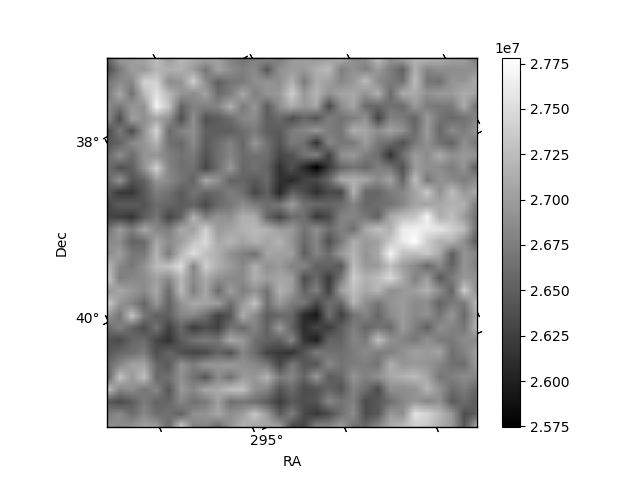
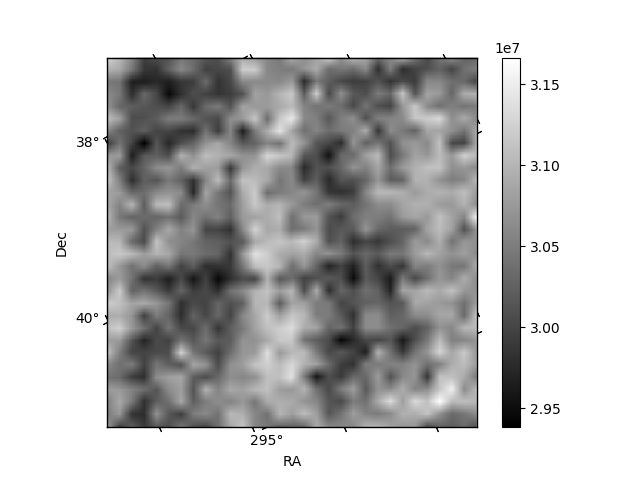
Histogram calculated using DETX and DETY for each event in the final _common_clean file
| Quadrant A |  |
 |
Quadrant B |
|---|---|---|---|
| Quadrant D |  |
 |
Quadrant C |
| Plot type | Count rate plots | Images |
|---|---|---|
| Comparison with Poisson distribution Blue bars denote a histogram of data divided into 1 sec bins. Red curve is a Poisson curve with rate = median count rate of data. |
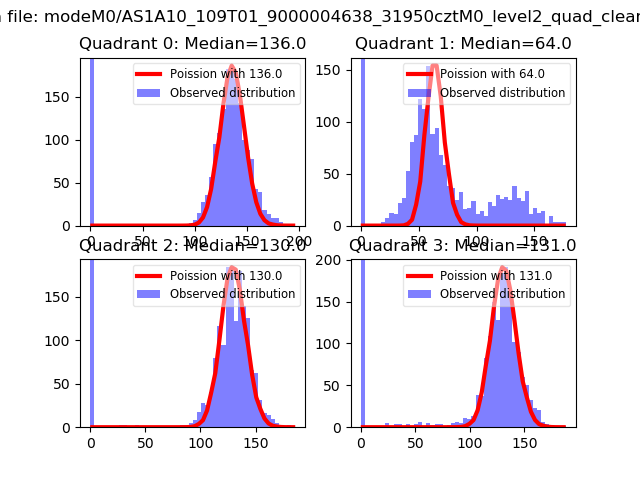 |
 |
| Quadrant-wise count rates Data is divided into 100 sec bins |
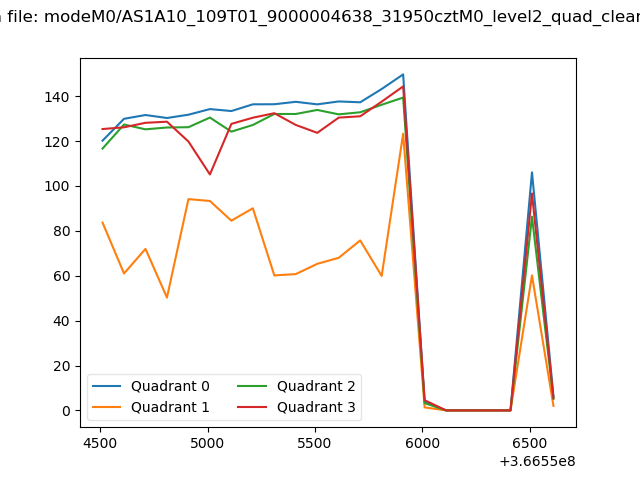 |
|
| Module-wise count rates for Quadrant A Data is divided into 100 sec bins |
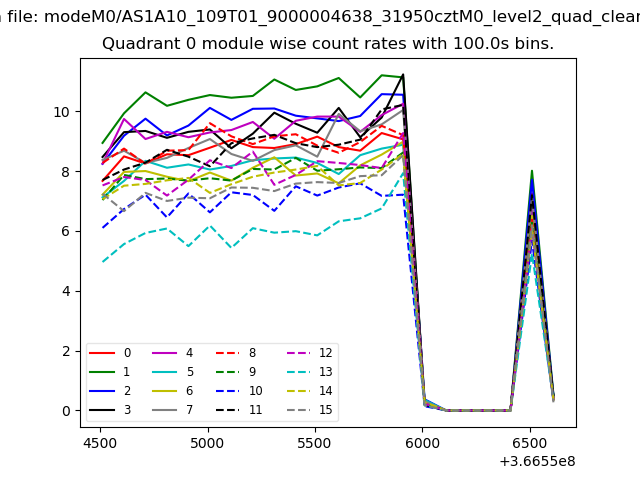 |
 |
| Module-wise count rates for Quadrant B Data is divided into 100 sec bins |
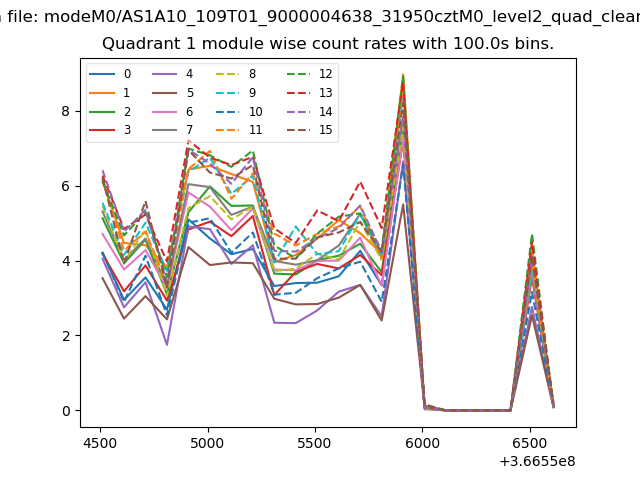 |
 |
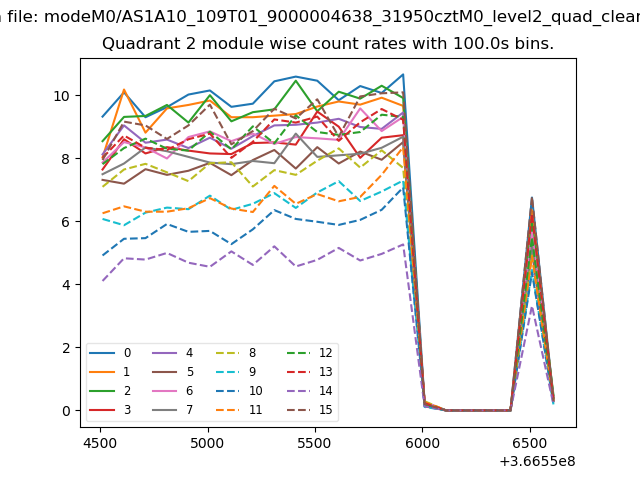
| Module-wise count rates for Quadrant C Data is divided into 100 sec bins |
 |
 |
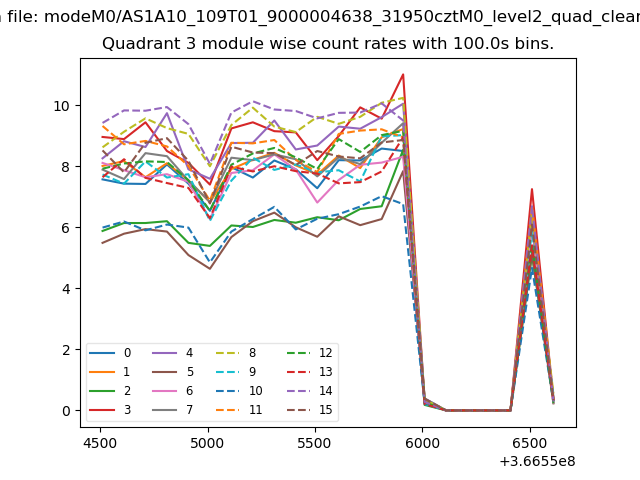
| Module-wise count rates for Quadrant D Data is divided into 100 sec bins |
 |
 |
| Parameter | Plot |
|---|---|
| CZT HV Monitor | 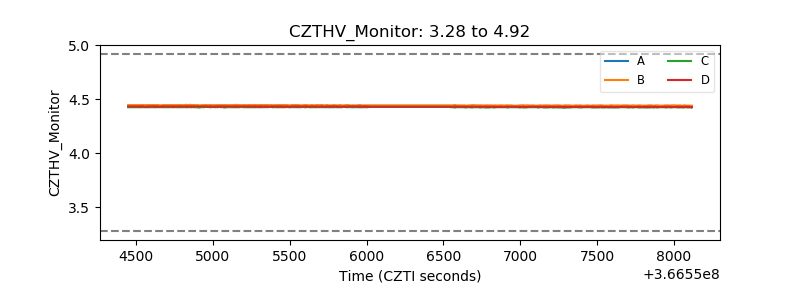 |
| D_VDD | 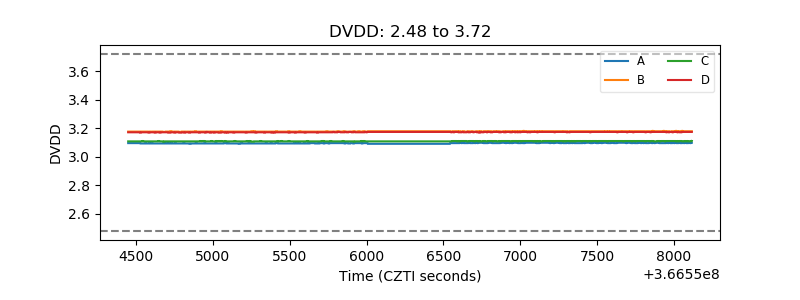 |
| Temperature 1 | 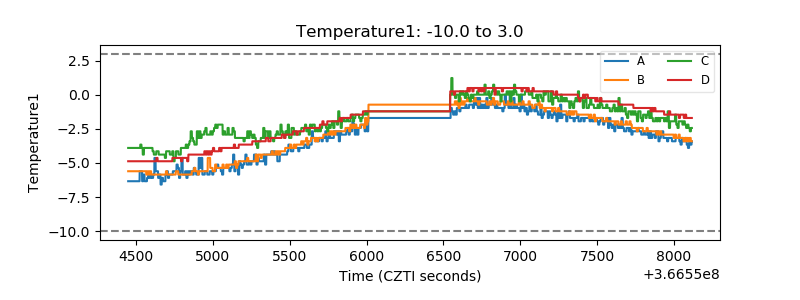 |
| Veto HV Monitor | 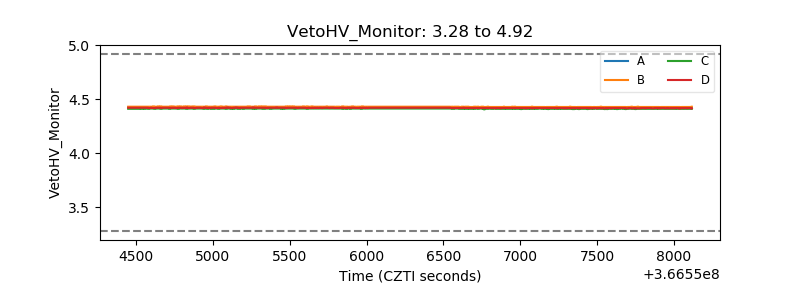 |
| Veto LLD | 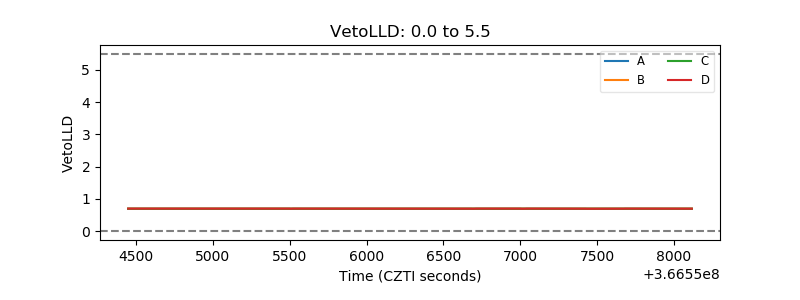 |
| Alpha Counter | 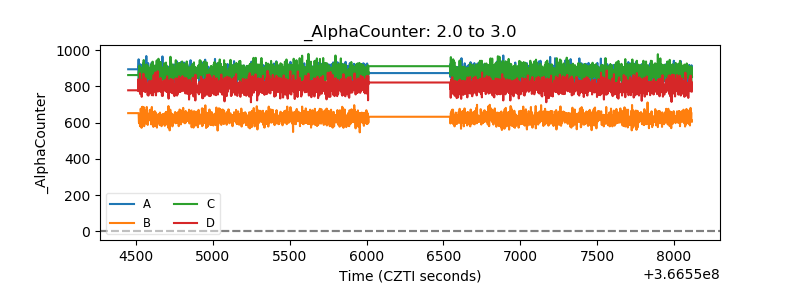 |
| _CPM_Rate | 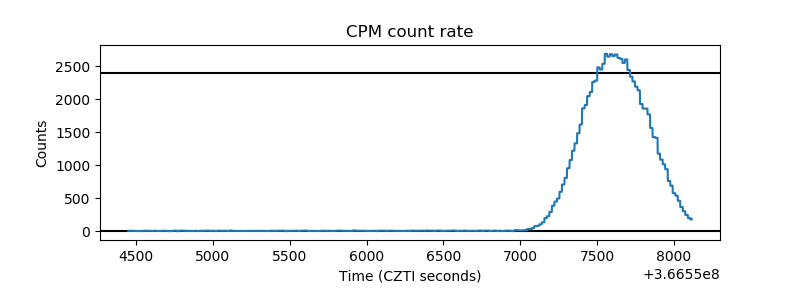 |
| CZT Counter | 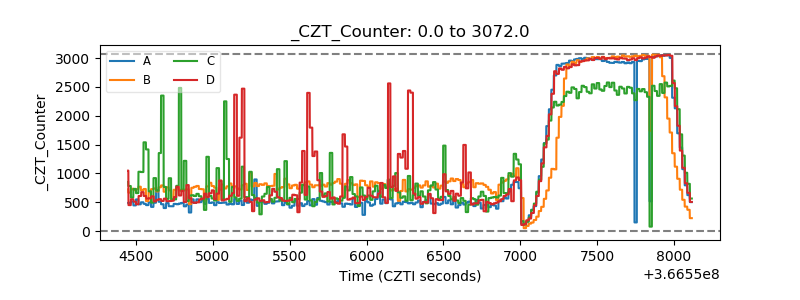 |
| +2.5 Volts monitor |  |
| +5 Volts monitor | 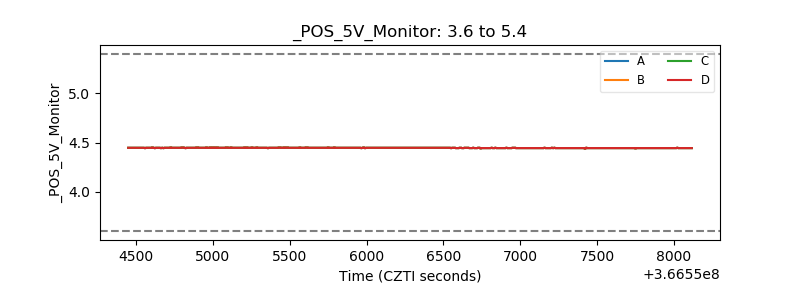 |
| _ROLL_ROT | 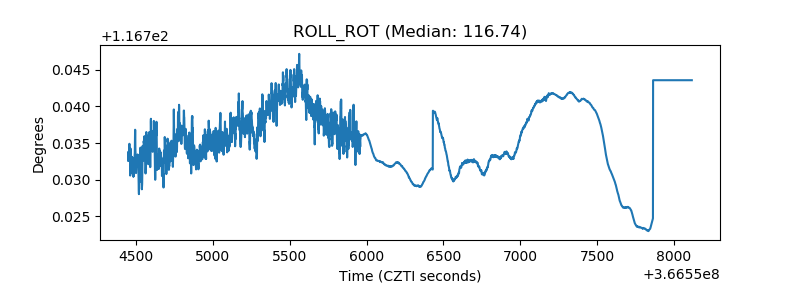 |
| _Roll_DEC | 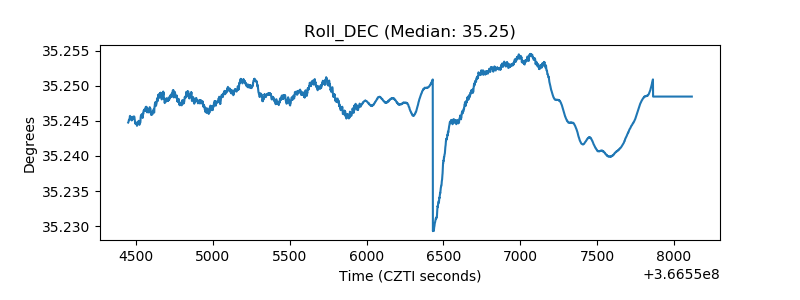 |
| _Roll_RA | 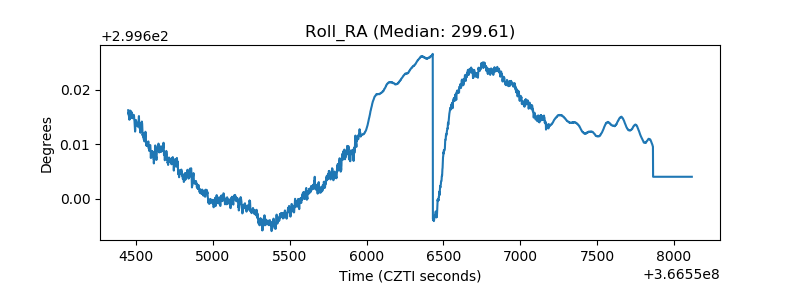 |
| Veto Counter | 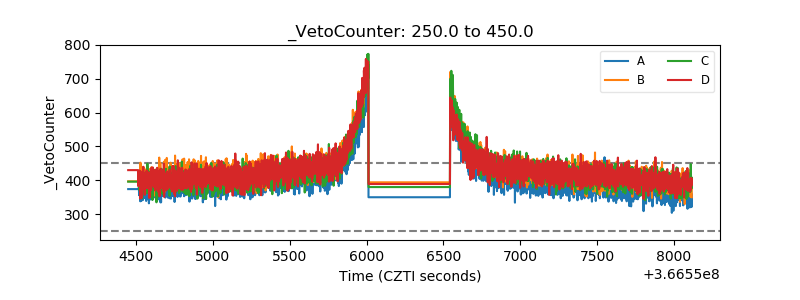 |