| Param | Original file | Final file |
|---|---|---|
| Filename | modeM0/AS1A10_109T01_9000004638_31959cztM0_level2.evt | modeM0/AS1A10_109T01_9000004638_31959cztM0_level2_quad_clean.evt |
| Size (bytes) | 76,728,960 | 15,986,880 |
| Size | 73.2 MB | 15.2 MB |
| Events in quadrant A | 362,160 | 112,688 |
| Events in quadrant B | 560,060 | 112,696 |
| Events in quadrant C | 775,582 | 98,831 |
| Events in quadrant D | 576,805 | 104,295 |
| Mode M0 | |||
|---|---|---|---|
| Quadrant | BADHDUFLAG | Total packets | Discarded packets |
| A | 0 | 1670 | 256 |
| B | 0 | 2375 | 332 |
| C | 0 | 3355 | 579 |
| D | 0 | 2499 | 328 |
| Mode SS | |||
|---|---|---|---|
| Quadrant | BADHDUFLAG | Total packets | Discarded packets |
| A | 0 | 16 | 2 |
| B | 0 | 15 | 1 |
| C | 0 | 15 | 1 |
| D | 0 | 15 | 1 |
| Quadrant | Total seconds | Saturated seconds | Saturation percentage |
|---|---|---|---|
| A | 681 | 0 | 0.000000% |
| B | 679 | 1 | 0.147275% |
| C | 669 | 134 | 20.029895% |
| D | 682 | 56 | 8.211144% |
Noise dominated data is calculated using 1-second bins in cleaned event files. If a bin has >2000 counts, and if more than 50% of those come from <1% of pixels, then it is considered to be noise-dominated and hence unusable.
| Quadrant | # 1 sec bins | Bins with >0 counts | Bins with >2000 counts | High rate bins dominated by noise | Noise dominated (total time) | Noise dominated (detector-on time) | Marked lightcurve |
|---|---|---|---|---|---|---|---|
| A | 774 | 694 | 0 | 0 | 0.00% | 0.00% | 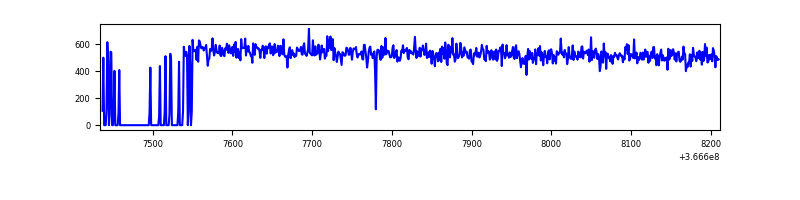 |
| B | 776 | 687 | 0 | 0 | 0.00% | 0.00% | 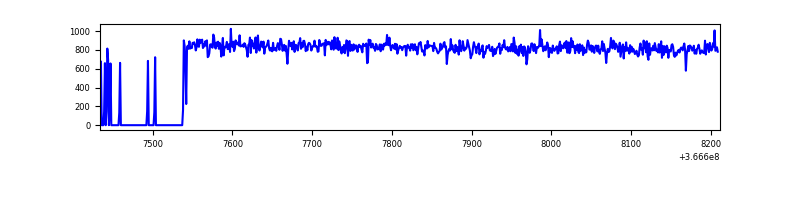 |
| C | 777 | 678 | 18 | 18 | 2.32% | 2.65% | 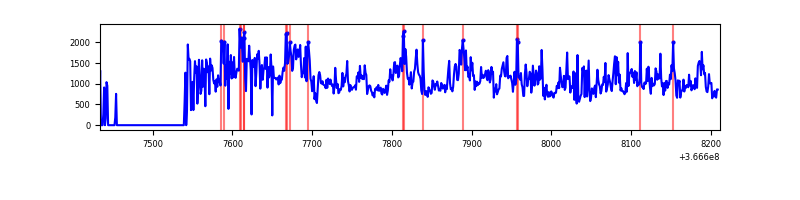 |
| D | 776 | 694 | 50 | 50 | 6.44% | 7.20% | 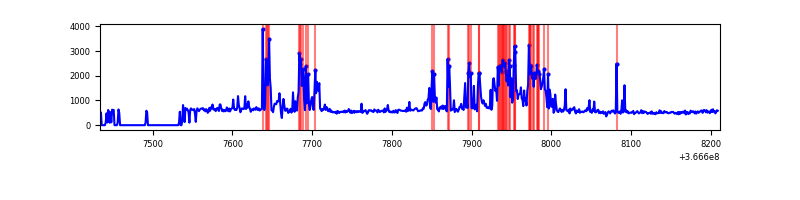 |
Top three noisy pixels from each quadrant. If the there are fewer than three noisy pixels in the level2.evt file, extra rows are filled as -1
| Pixel properties | Quadrant properties | ||||||
|---|---|---|---|---|---|---|---|
| Quadrant | DetID | PixID | Counts | Sigma | Mean | Median | Sigma |
| A | 13 | 254 | 1127 | 49.55 | 93 | 92 | 20.9 |
| A | 3 | 137 | 766 | 32.27 | 93 | 92 | 20.9 |
| A | 0 | 226 | 759 | 31.93 | 93 | 92 | 20.9 |
| B | 6 | 159 | 203305 | 10666.22 | 90 | 88 | 19.1 |
| B | 12 | 111 | 1964 | 98.47 | 90 | 88 | 19.1 |
| B | 11 | 111 | 1797 | 89.7 | 90 | 88 | 19.1 |
| C | 3 | 233 | 252199 | 11635.34 | 85 | 85 | 21.7 |
| C | 0 | 10 | 145923 | 6730.59 | 85 | 85 | 21.7 |
| C | 14 | 238 | 25569 | 1176.12 | 85 | 85 | 21.7 |
| D | 12 | 218 | 169369 | 7342.43 | 91 | 88 | 23.1 |
| D | 8 | 195 | 29226 | 1263.84 | 91 | 88 | 23.1 |
| D | 2 | 250 | 19947 | 861.37 | 91 | 88 | 23.1 |
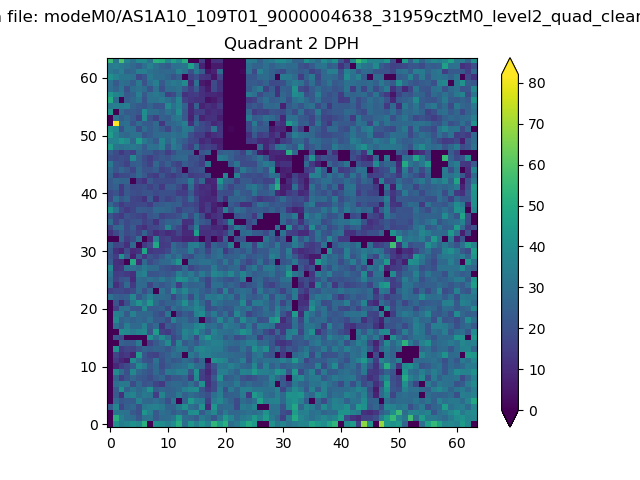
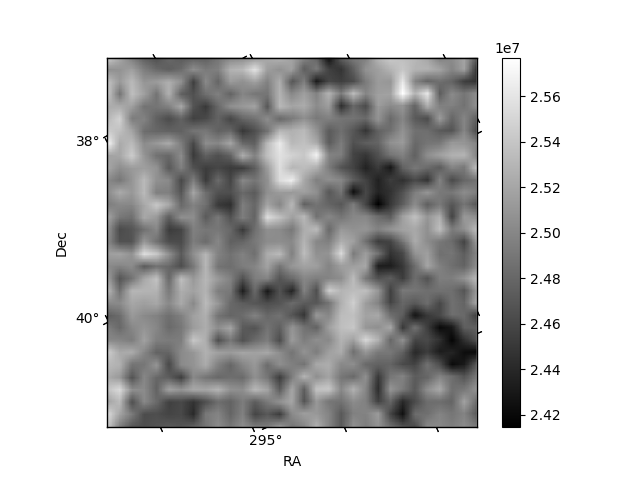
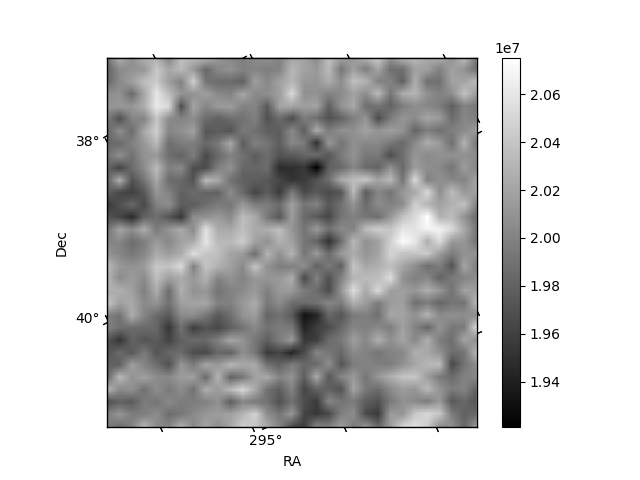
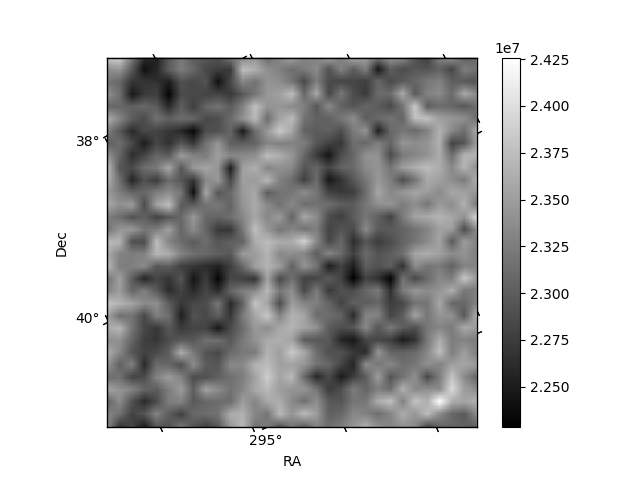
Histogram calculated using DETX and DETY for each event in the final _common_clean file
| Quadrant A | 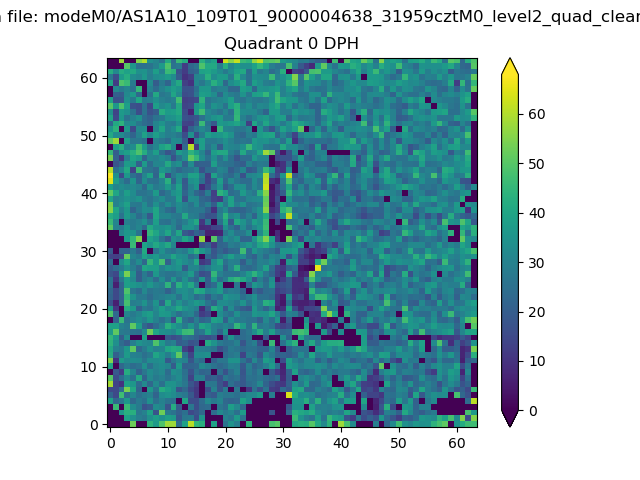 |
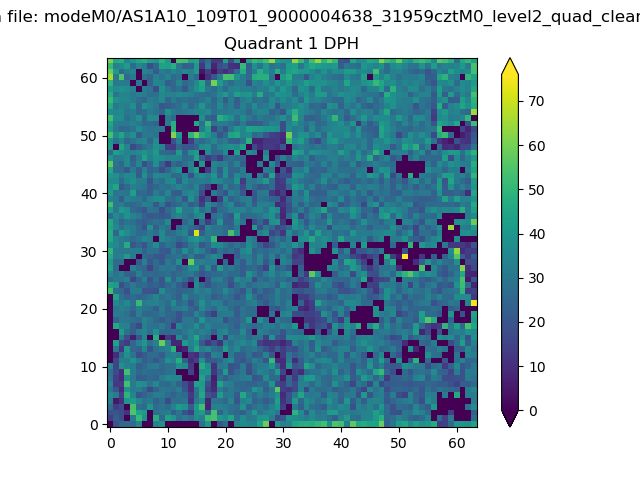 |
Quadrant B |
|---|---|---|---|
| Quadrant D | 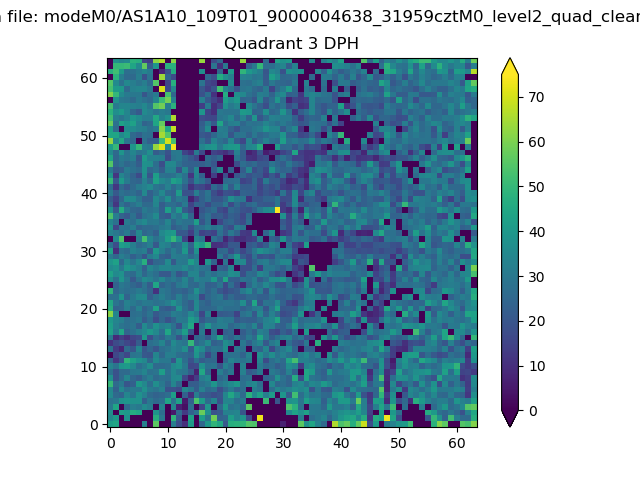 |
 |
Quadrant C |
| Plot type | Count rate plots | Images |
|---|---|---|
| Comparison with Poisson distribution Blue bars denote a histogram of data divided into 1 sec bins. Red curve is a Poisson curve with rate = median count rate of data. |
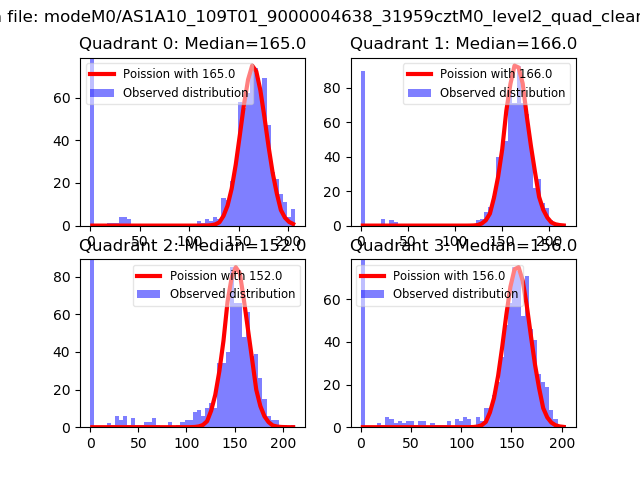 |
 |
| Quadrant-wise count rates Data is divided into 100 sec bins |
 |
|
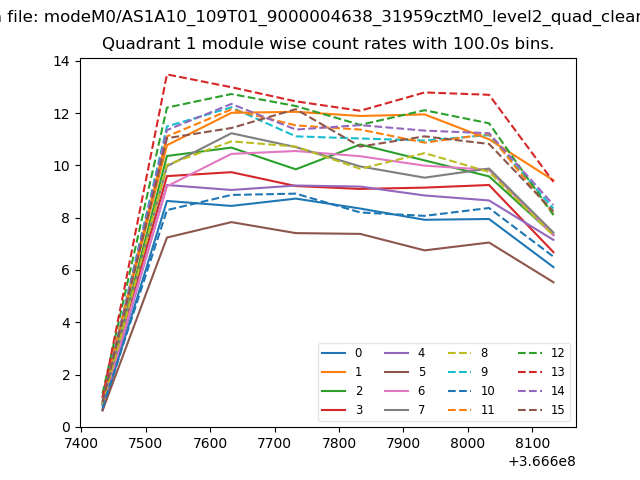
| Module-wise count rates for Quadrant A Data is divided into 100 sec bins |
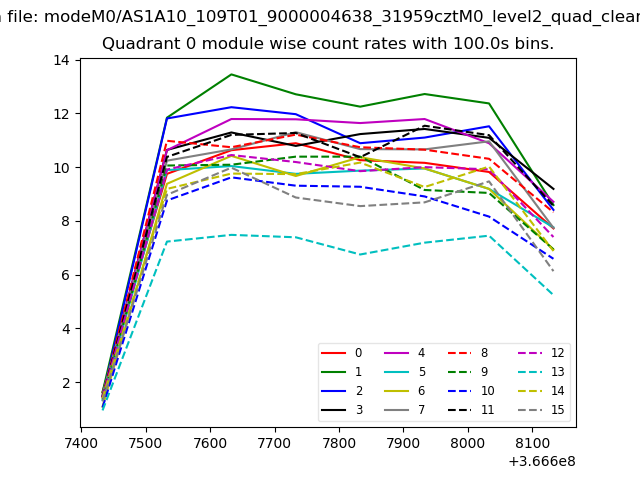 |
 |
| Module-wise count rates for Quadrant B Data is divided into 100 sec bins |
 |
 |
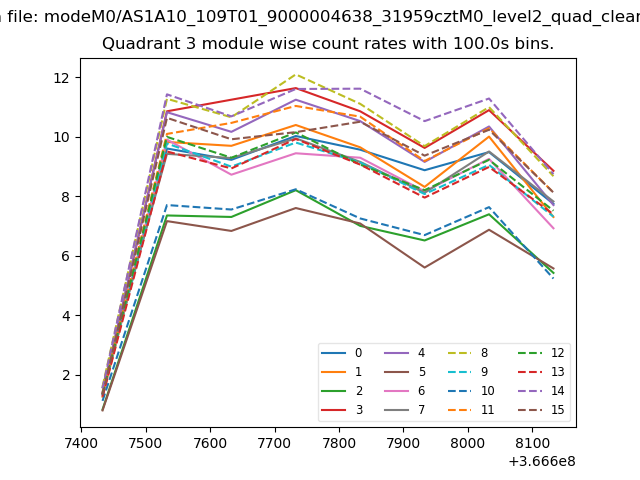
| Module-wise count rates for Quadrant C Data is divided into 100 sec bins |
 |
 |
| Module-wise count rates for Quadrant D Data is divided into 100 sec bins |
 |
 |
| Parameter | Plot |
|---|---|
| CZT HV Monitor | 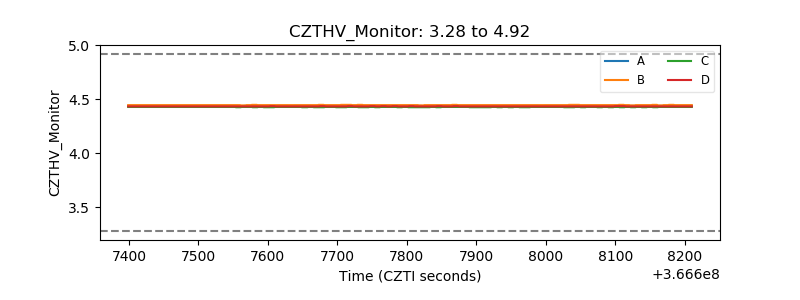 |
| D_VDD | 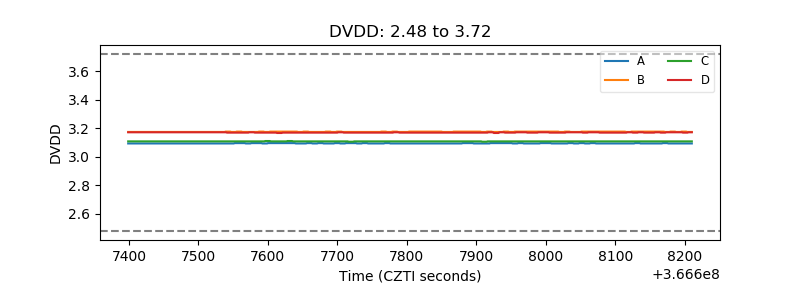 |
| Temperature 1 | 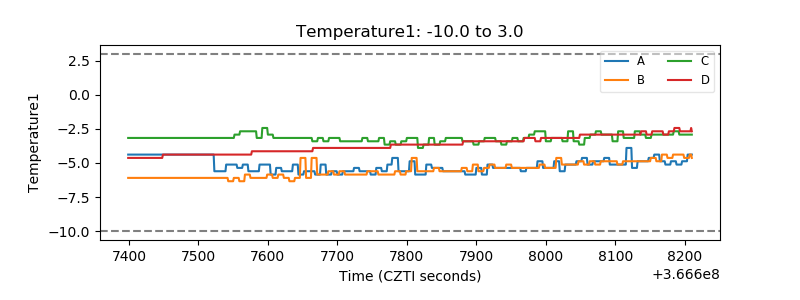 |
| Veto HV Monitor | 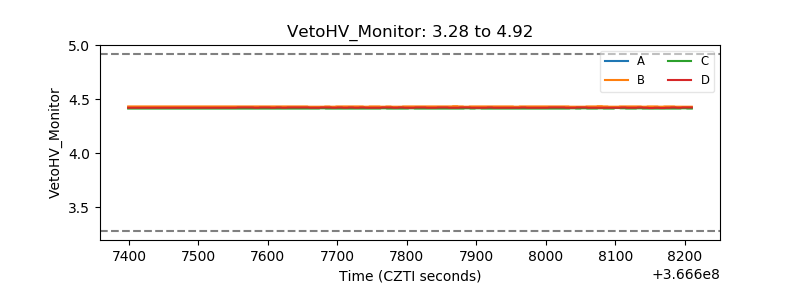 |
| Veto LLD | 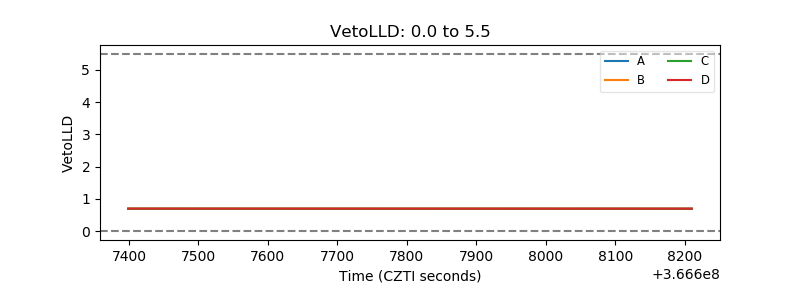 |
| Alpha Counter | 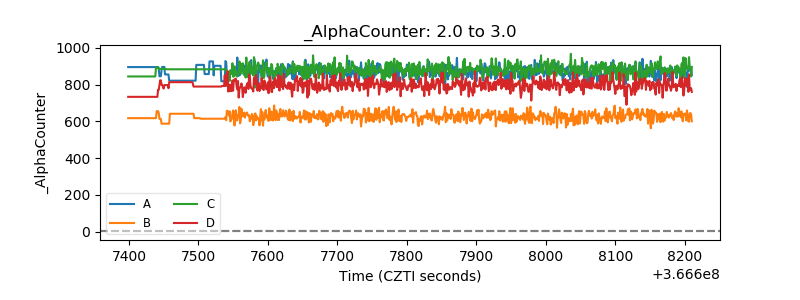 |
| _CPM_Rate | 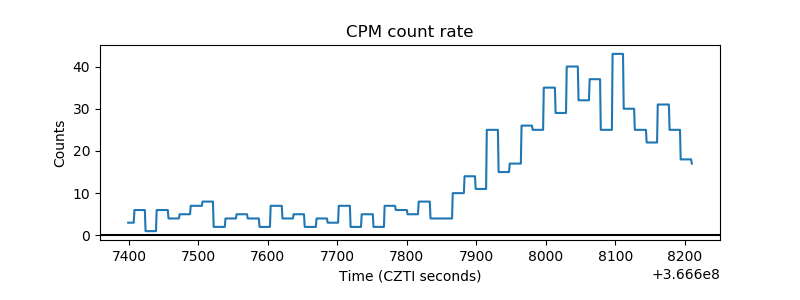 |
| CZT Counter | 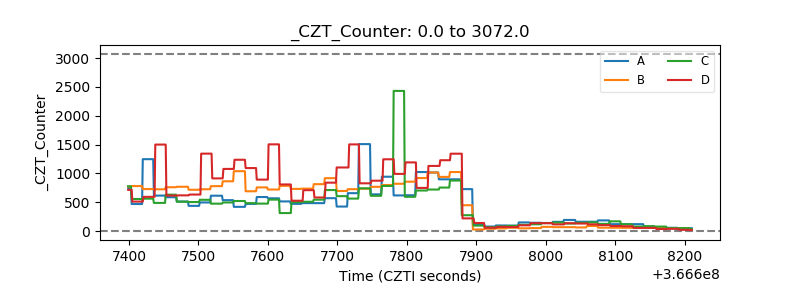 |
| +2.5 Volts monitor |  |
| +5 Volts monitor |  |
| _ROLL_ROT | 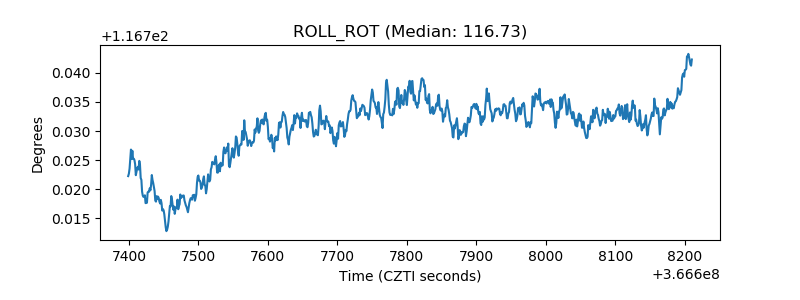 |
| _Roll_DEC | 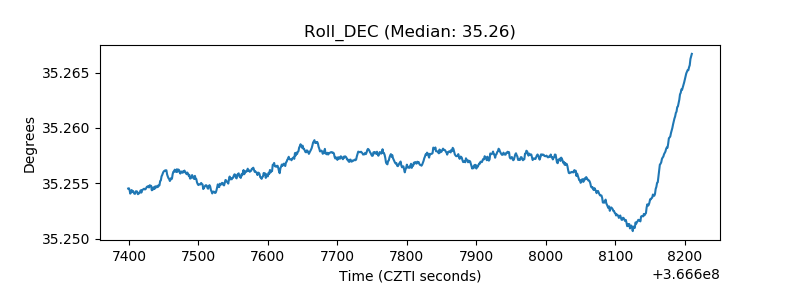 |
| _Roll_RA | 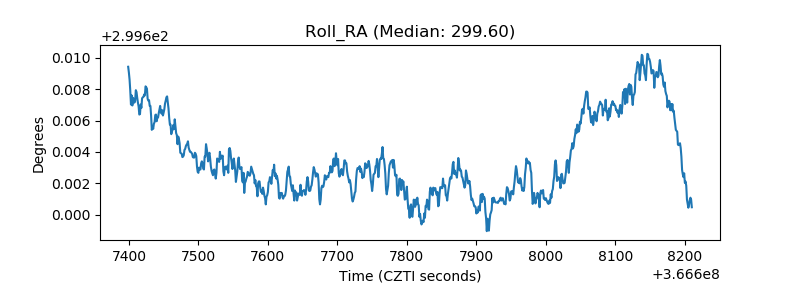 |
| Veto Counter |  |