| Param | Original file | Final file |
|---|---|---|
| Filename | modeM0/AS1T04_036T01_9000004640cztM0_level2.fits | modeM0/AS1T04_036T01_9000004640cztM0_level2_quad_clean.evt |
| Size (bytes) | 107,821,440 | 53,360,640 |
| Size | 102.8 MB | 50.9 MB |
| Events in quadrant A | 681,516 | 241,220 |
| Events in quadrant B | 633,588 | 232,861 |
| Events in quadrant C | 654,998 | 225,668 |
| Events in quadrant D | 565,624 | 185,835 |
| Mode M9 | |||
|---|---|---|---|
| Quadrant | BADHDUFLAG | Total packets | Discarded packets |
| A | 0 | 16 | 0 |
| B | 0 | 16 | 0 |
| C | 0 | 16 | 0 |
| D | 0 | 16 | 0 |
| Mode M0 | |||
|---|---|---|---|
| Quadrant | BADHDUFLAG | Total packets | Discarded packets |
| A | 0 | 24508 | 0 |
| B | 0 | 32679 | 0 |
| C | 0 | 25946 | 0 |
| D | 0 | 33773 | 0 |
| Mode SS | |||
|---|---|---|---|
| Quadrant | BADHDUFLAG | Total packets | Discarded packets |
| A | 0 | 214 | 0 |
| B | 0 | 216 | 0 |
| C | 0 | 218 | 0 |
| D | 0 | 214 | 0 |
| Quadrant | Total seconds | Saturated seconds | Saturation percentage |
|---|---|---|---|
| A | 10544 | 362 | 3.433232% |
| B | 10503 | 321 | 3.056270% |
| C | 10549 | 359 | 3.403166% |
| D | 10502 | 1058 | 10.074272% |
Noise dominated data is calculated using 1-second bins in cleaned event files. If a bin has >2000 counts, and if more than 50% of those come from <1% of pixels, then it is considered to be noise-dominated and hence unusable.
| Quadrant | # 1 sec bins | Bins with >0 counts | Bins with >2000 counts | High rate bins dominated by noise | Noise dominated (total time) | Noise dominated (detector-on time) | Marked lightcurve |
|---|---|---|---|---|---|---|---|
| A | 9758 | 9017 | 0 | 0 | 0.00% | 0.00% | 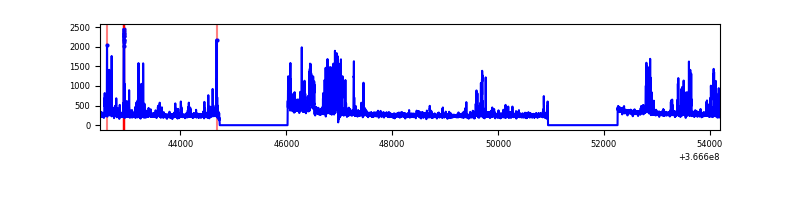 |
| B | 9758 | 9000 | 0 | 0 | 0.00% | 0.00% | 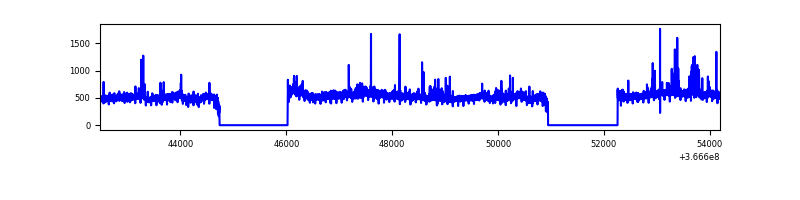 |
| C | 9758 | 9034 | 0 | 0 | 0.00% | 0.00% | 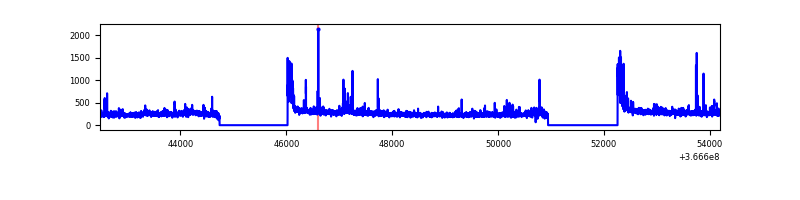 |
| D | 9758 | 8991 | 0 | 0 | 0.00% | 0.00% | 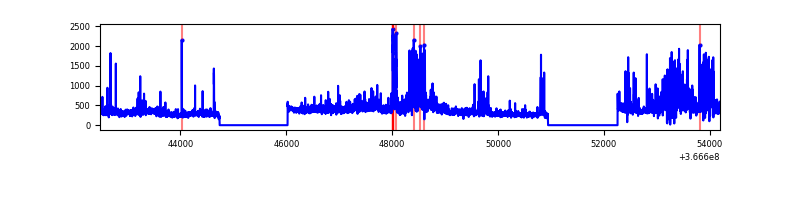 |
Top three noisy pixels from each quadrant. If the there are fewer than three noisy pixels in the level2.evt file, extra rows are filled as -1
| Pixel properties | Quadrant properties | ||||||
|---|---|---|---|---|---|---|---|
| Quadrant | DetID | PixID | Counts | Sigma | Mean | Median | Sigma |
| A | 9 | 19 | 539 | 8.29 | 177 | 167 | 44.8 |
| A | 0 | 29 | 539 | 8.29 | 177 | 167 | 44.8 |
| A | 7 | 110 | 502 | 7.47 | 177 | 167 | 44.8 |
| B | 2 | 9 | 493 | 9.29 | 168 | 161 | 35.7 |
| B | 2 | 8 | 442 | 7.86 | 168 | 161 | 35.7 |
| B | 3 | 80 | 440 | 7.81 | 168 | 161 | 35.7 |
| C | 3 | 202 | 506 | 7.46 | 173 | 163 | 46.0 |
| C | 3 | 203 | 483 | 6.96 | 173 | 163 | 46.0 |
| C | 12 | 241 | 455 | 6.35 | 173 | 163 | 46.0 |
| D | 4 | 246 | 467 | 7.2 | 161 | 146 | 44.6 |
| D | 6 | 62 | 394 | 5.56 | 161 | 146 | 44.6 |
| D | 3 | 14 | 394 | 5.56 | 161 | 146 | 44.6 |
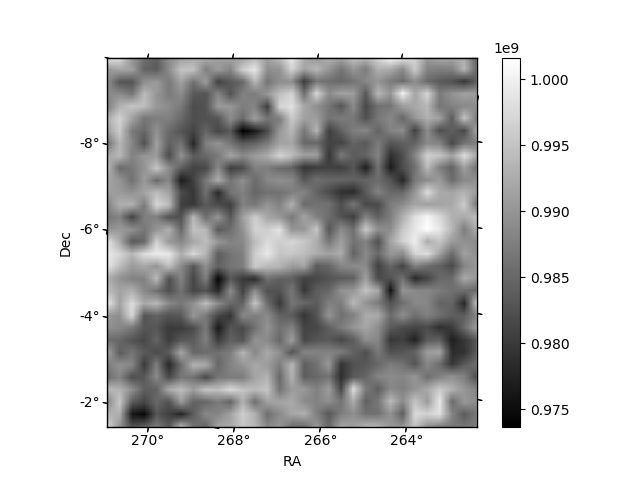
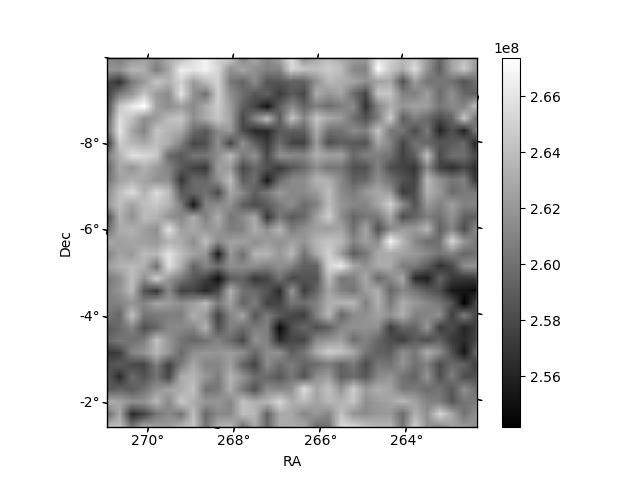
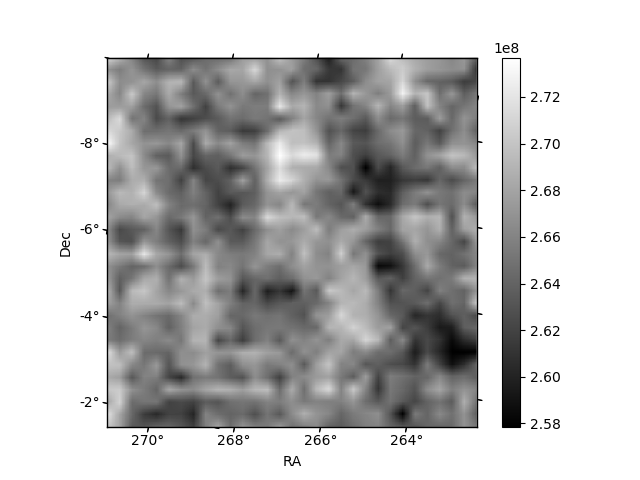
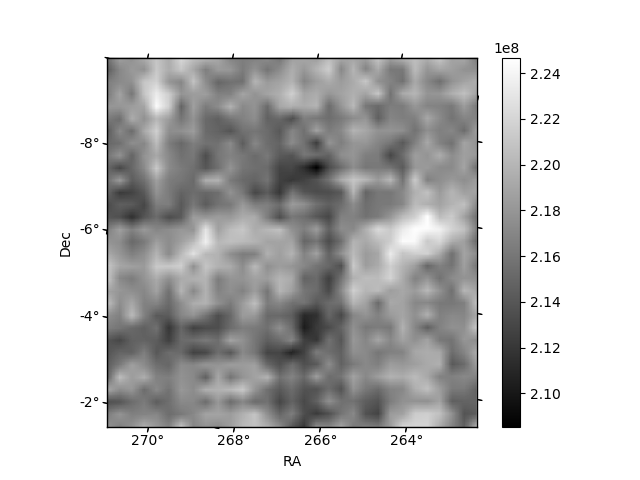
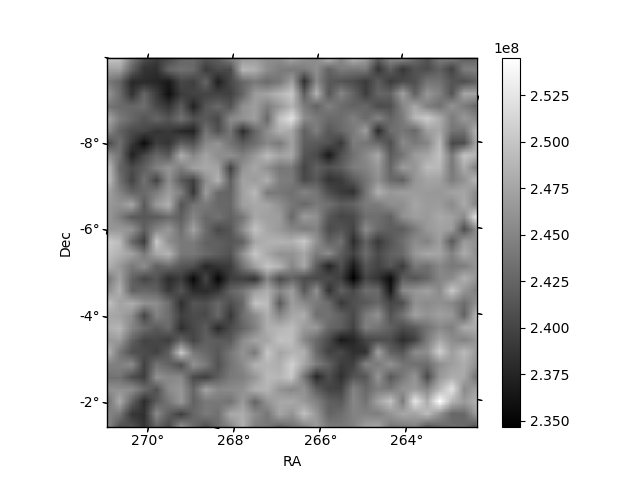
Histogram calculated using DETX and DETY for each event in the final _common_clean file
| Quadrant A | 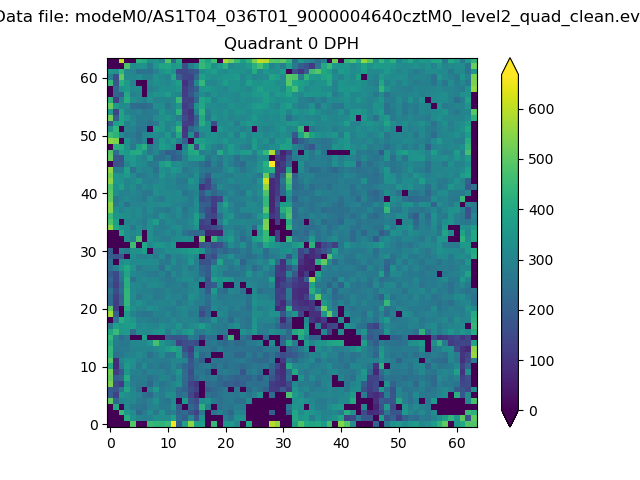 |
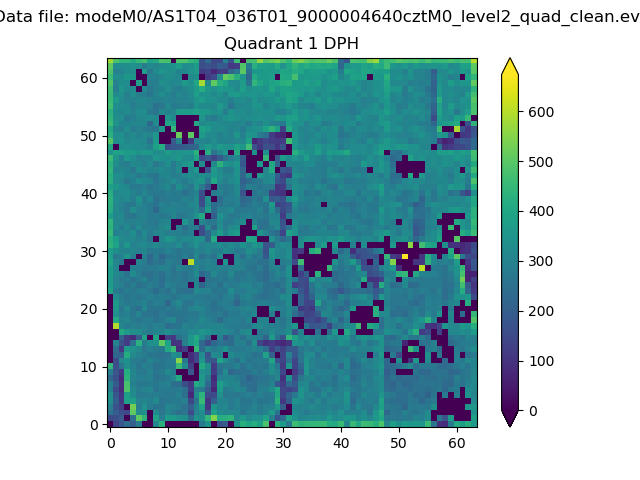 |
Quadrant B |
|---|---|---|---|
| Quadrant D |  |
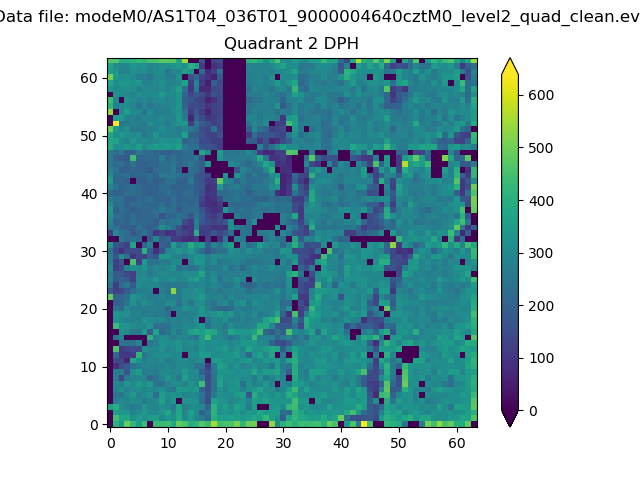 |
Quadrant C |
| Plot type | Count rate plots | Images |
|---|---|---|
| Comparison with Poisson distribution Blue bars denote a histogram of data divided into 1 sec bins. Red curve is a Poisson curve with rate = median count rate of data. |
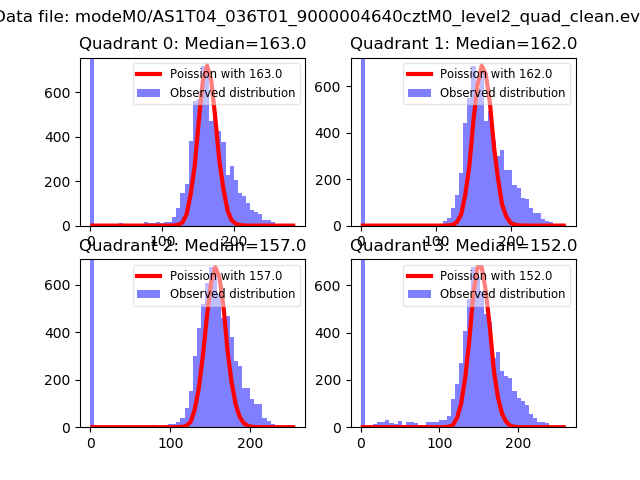 |
 |
| Quadrant-wise count rates Data is divided into 100 sec bins |
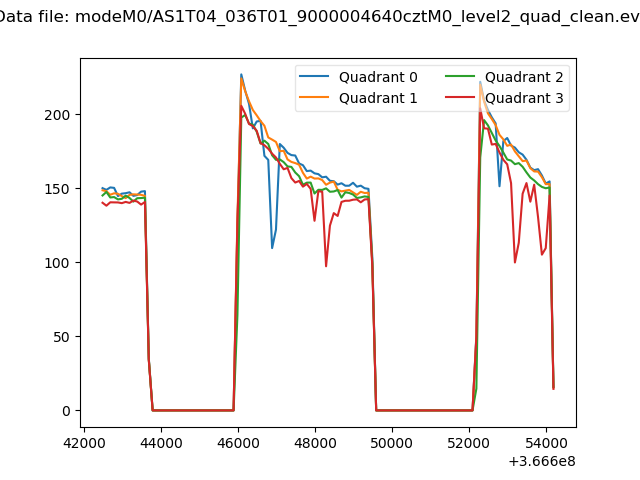 |
|
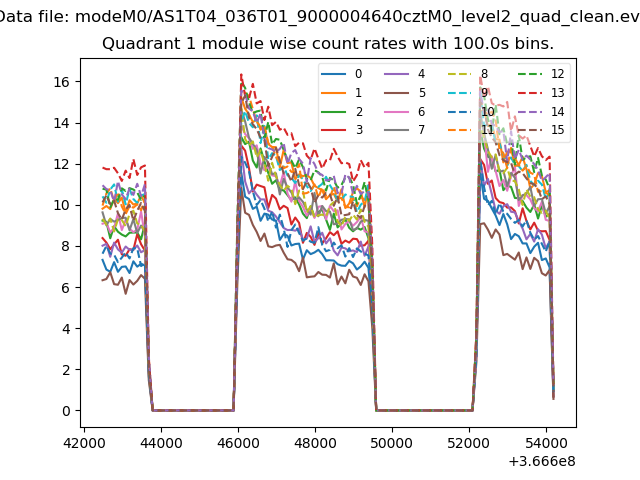
| Module-wise count rates for Quadrant A Data is divided into 100 sec bins |
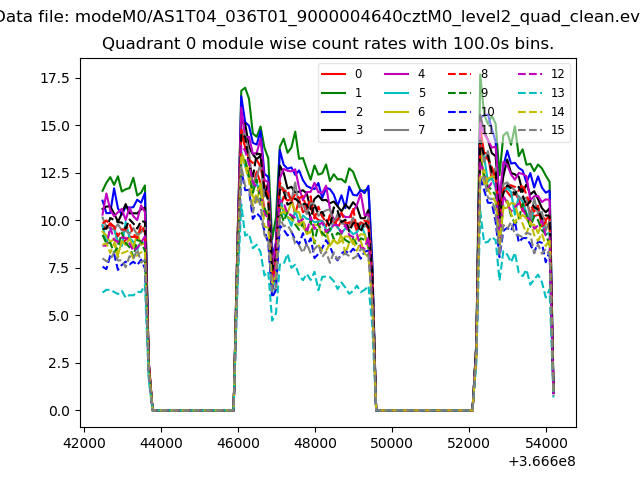 |
 |
| Module-wise count rates for Quadrant B Data is divided into 100 sec bins |
 |
 |
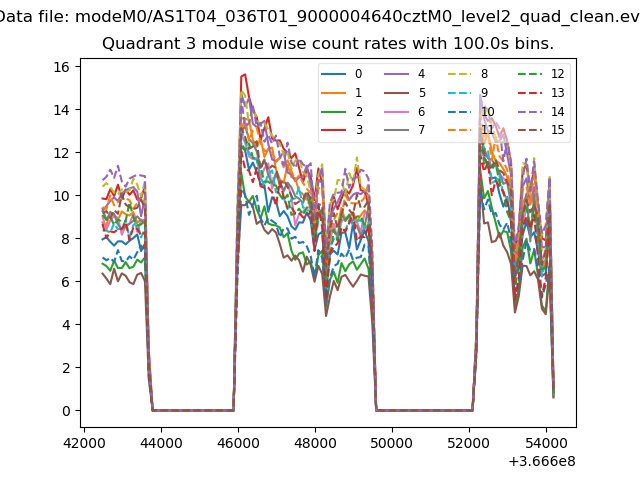
| Module-wise count rates for Quadrant C Data is divided into 100 sec bins |
 |
 |
| Module-wise count rates for Quadrant D Data is divided into 100 sec bins |
 |
 |
| Parameter | Plot |
|---|---|
| CZT HV Monitor | 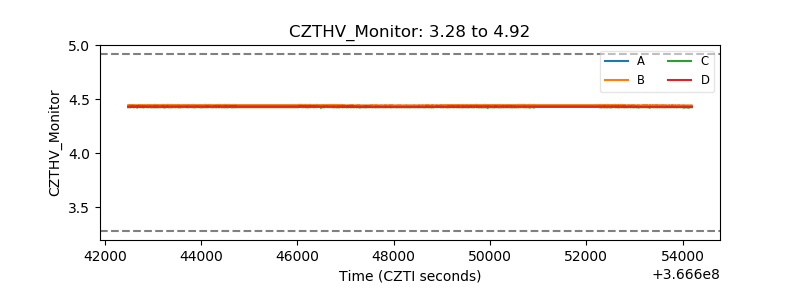 |
| D_VDD | 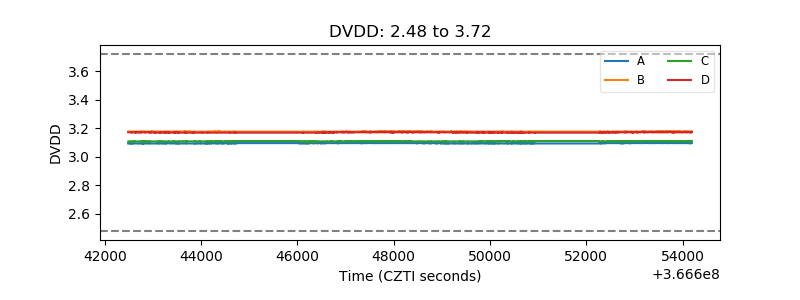 |
| Temperature 1 | 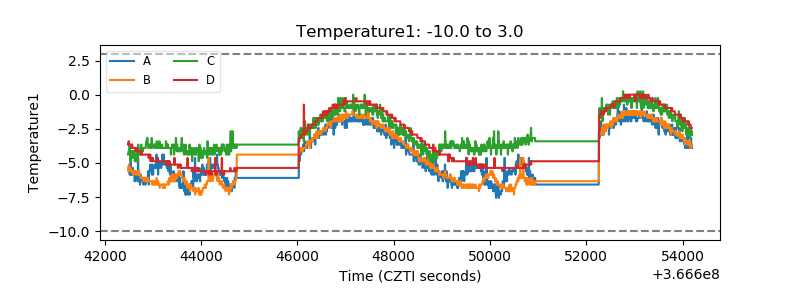 |
| Veto HV Monitor |  |
| Veto LLD | 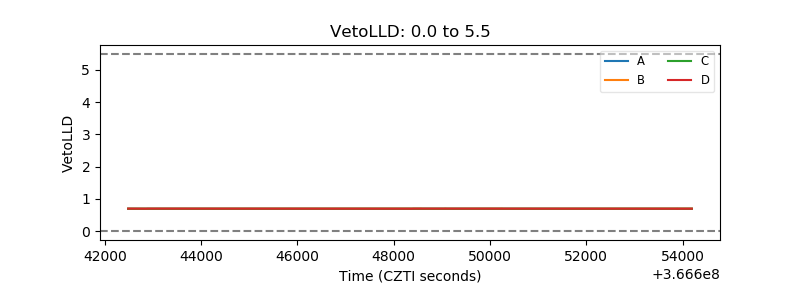 |
| Alpha Counter | 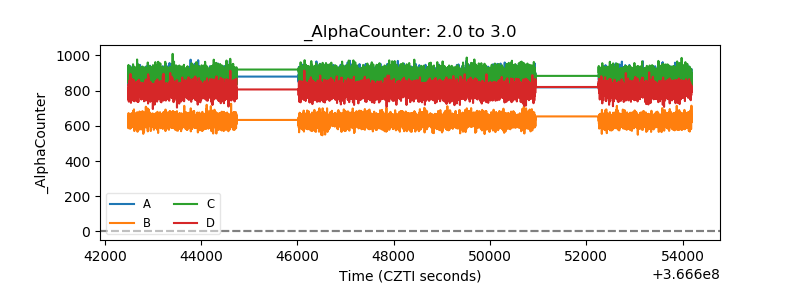 |
| _CPM_Rate | 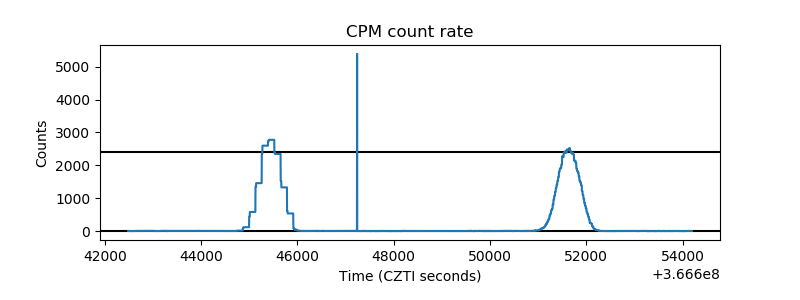 |
| CZT Counter | 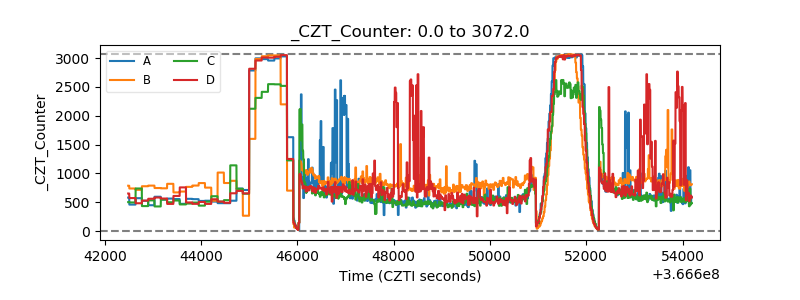 |
| +2.5 Volts monitor | 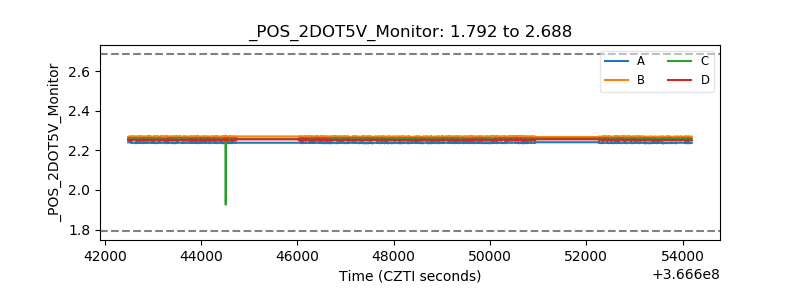 |
| +5 Volts monitor | 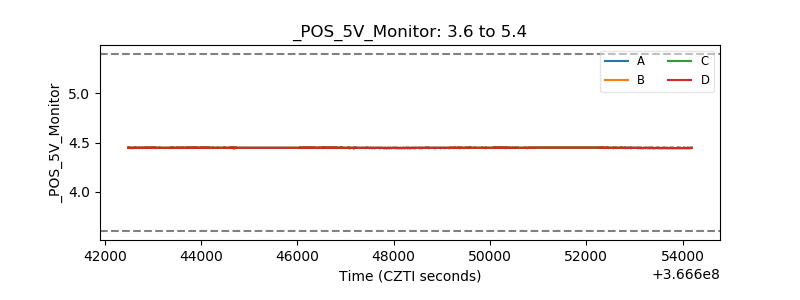 |
| _ROLL_ROT | 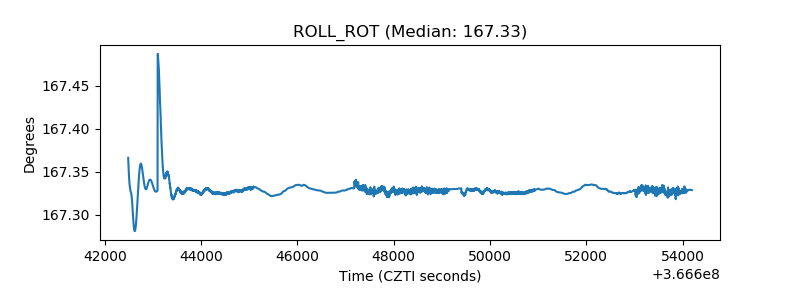 |
| _Roll_DEC | 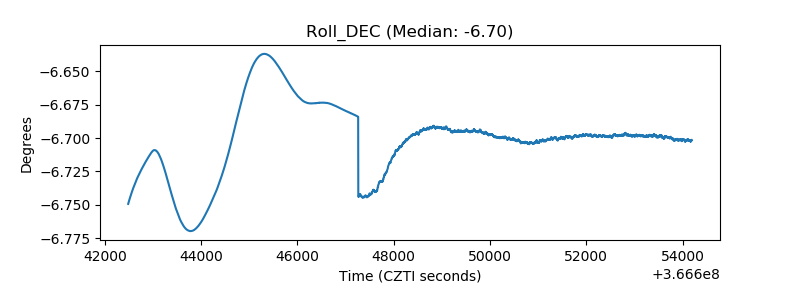 |
| _Roll_RA | 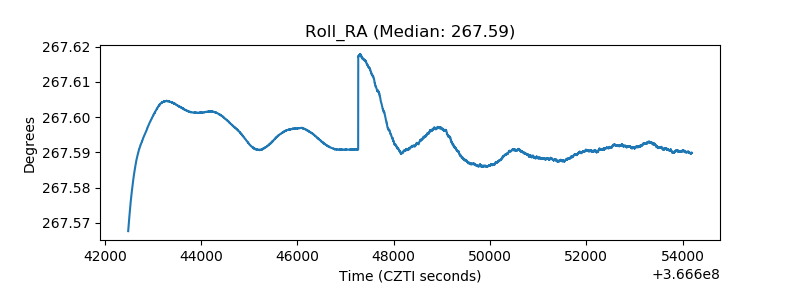 |
| Veto Counter | 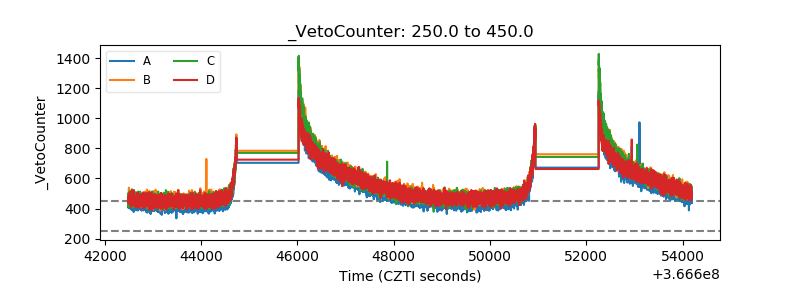 |