| Param | Original file | Final file |
|---|---|---|
| Filename | modeM0/AS1T04_036T01_9000004640_31786cztM0_level2.evt | modeM0/AS1T04_036T01_9000004640_31786cztM0_level2_quad_clean.evt |
| Size (bytes) | 367,620,480 | 70,920,000 |
| Size | 350.6 MB | 67.6 MB |
| Events in quadrant A | 2,813,377 | 469,138 |
| Events in quadrant B | 3,226,555 | 484,948 |
| Events in quadrant C | 2,363,011 | 459,703 |
| Events in quadrant D | 2,467,934 | 461,055 |
| Mode M9 | |||
|---|---|---|---|
| Quadrant | BADHDUFLAG | Total packets | Discarded packets |
| A | 0 | 13 | 0 |
| B | 0 | 13 | 0 |
| C | 0 | 13 | 0 |
| D | 0 | 13 | 0 |
| Mode M0 | |||
|---|---|---|---|
| Quadrant | BADHDUFLAG | Total packets | Discarded packets |
| A | 0 | 10810 | 1 |
| B | 0 | 12085 | 1 |
| C | 0 | 9583 | 1 |
| D | 0 | 9972 | 1 |
| Mode SS | |||
|---|---|---|---|
| Quadrant | BADHDUFLAG | Total packets | Discarded packets |
| A | 0 | 78 | 0 |
| B | 0 | 78 | 0 |
| C | 0 | 78 | 0 |
| D | 0 | 78 | 0 |
| Quadrant | Total seconds | Saturated seconds | Saturation percentage |
|---|---|---|---|
| A | 3867 | 322 | 8.326868% |
| B | 3866 | 131 | 3.388515% |
| C | 3866 | 174 | 4.500776% |
| D | 3866 | 70 | 1.810657% |
Noise dominated data is calculated using 1-second bins in cleaned event files. If a bin has >2000 counts, and if more than 50% of those come from <1% of pixels, then it is considered to be noise-dominated and hence unusable.
| Quadrant | # 1 sec bins | Bins with >0 counts | Bins with >2000 counts | High rate bins dominated by noise | Noise dominated (total time) | Noise dominated (detector-on time) | Marked lightcurve |
|---|---|---|---|---|---|---|---|
| A | 5152 | 3868 | 119 | 119 | 2.31% | 3.08% | 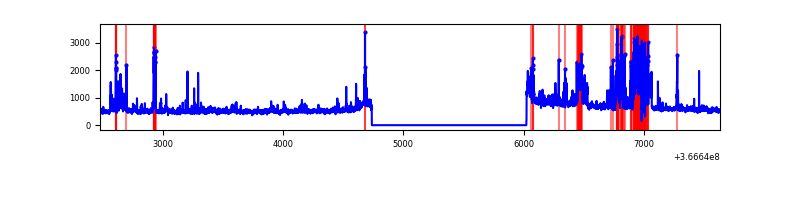 |
| B | 5151 | 3867 | 2 | 2 | 0.04% | 0.05% | 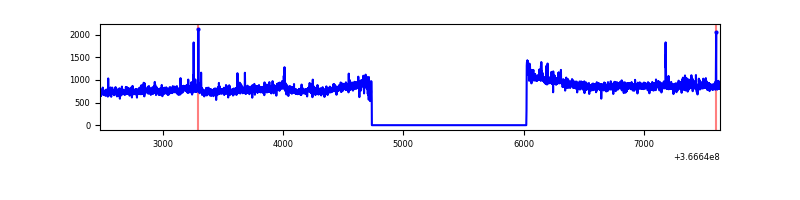 |
| C | 5151 | 3867 | 25 | 25 | 0.49% | 0.65% | 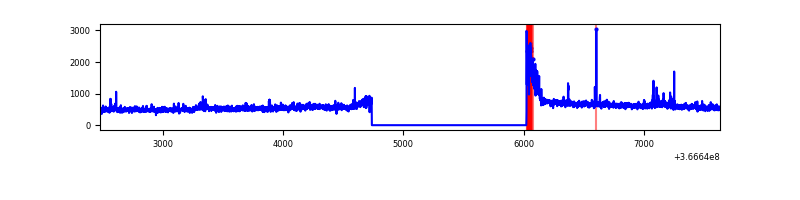 |
| D | 5151 | 3867 | 8 | 8 | 0.16% | 0.21% | 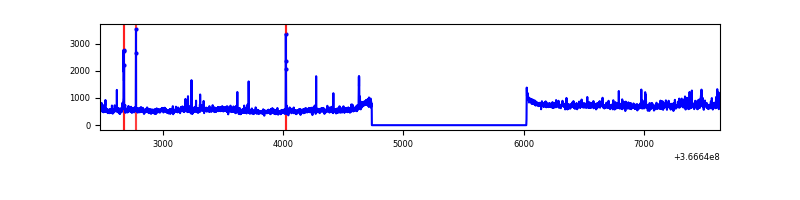 |
Top three noisy pixels from each quadrant. If the there are fewer than three noisy pixels in the level2.evt file, extra rows are filled as -1
| Pixel properties | Quadrant properties | ||||||
|---|---|---|---|---|---|---|---|
| Quadrant | DetID | PixID | Counts | Sigma | Mean | Median | Sigma |
| A | 0 | 13 | 711189 | 6572.28 | 543 | 534 | 108.1 |
| A | 13 | 254 | 7811 | 67.3 | 543 | 534 | 108.1 |
| A | 3 | 137 | 4996 | 41.27 | 543 | 534 | 108.1 |
| B | 6 | 159 | 1022529 | 9927.65 | 543 | 531 | 102.9 |
| B | 0 | 190 | 15211 | 142.6 | 543 | 531 | 102.9 |
| B | 0 | 229 | 13941 | 130.26 | 543 | 531 | 102.9 |
| C | 0 | 10 | 155439 | 1268.38 | 523 | 527 | 122.1 |
| C | 14 | 238 | 88874 | 723.36 | 523 | 527 | 122.1 |
| C | 10 | 22 | 35164 | 283.6 | 523 | 527 | 122.1 |
| D | 8 | 195 | 299362 | 2325.29 | 540 | 527 | 128.5 |
| D | 2 | 250 | 62831 | 484.8 | 540 | 527 | 128.5 |
| D | 7 | 223 | 33845 | 259.25 | 540 | 527 | 128.5 |
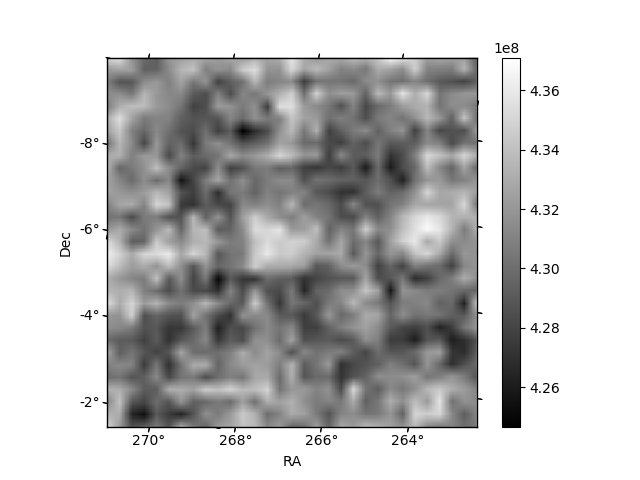
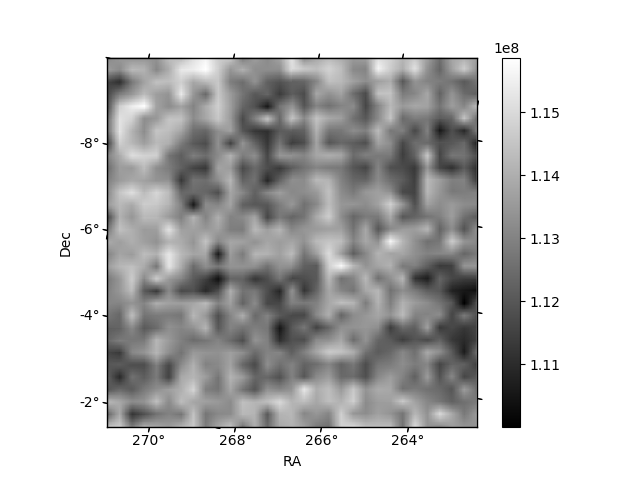
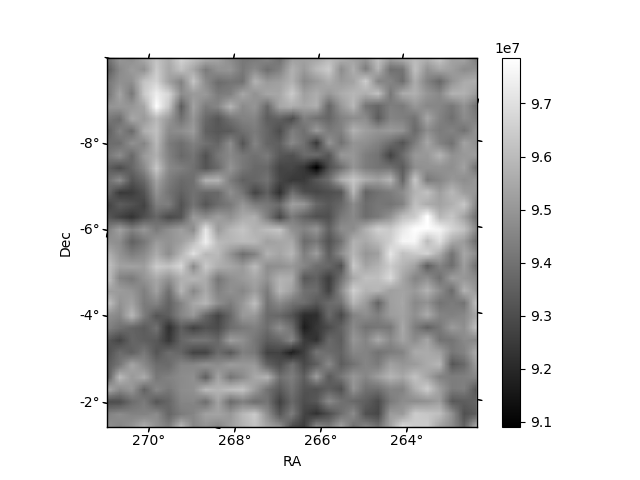
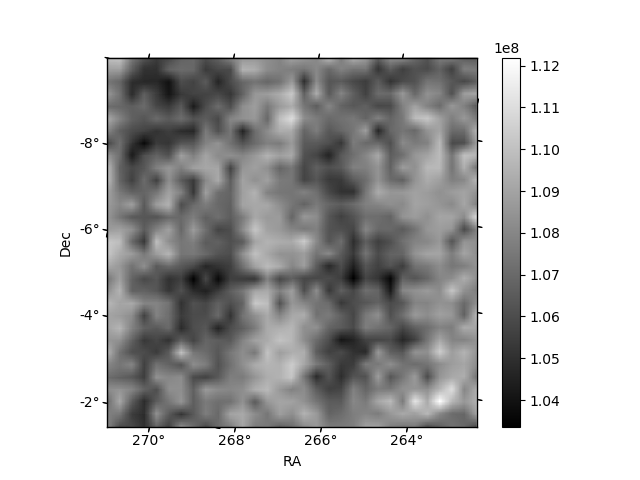
Histogram calculated using DETX and DETY for each event in the final _common_clean file
| Quadrant A | 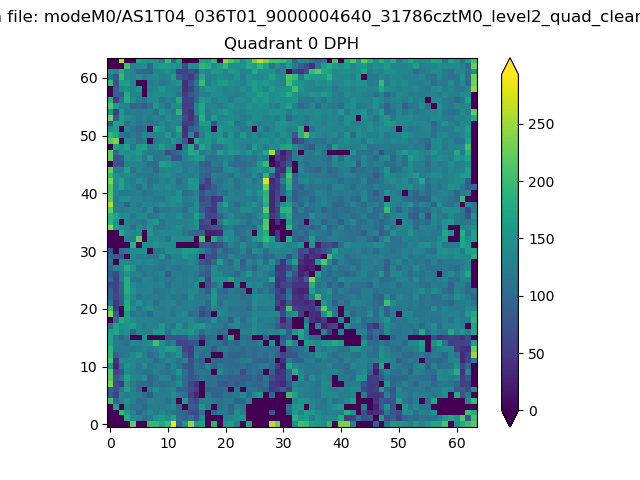 |
 |
Quadrant B |
|---|---|---|---|
| Quadrant D | 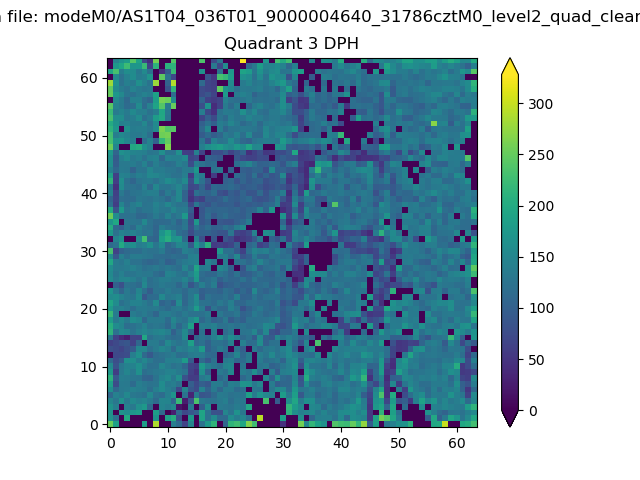 |
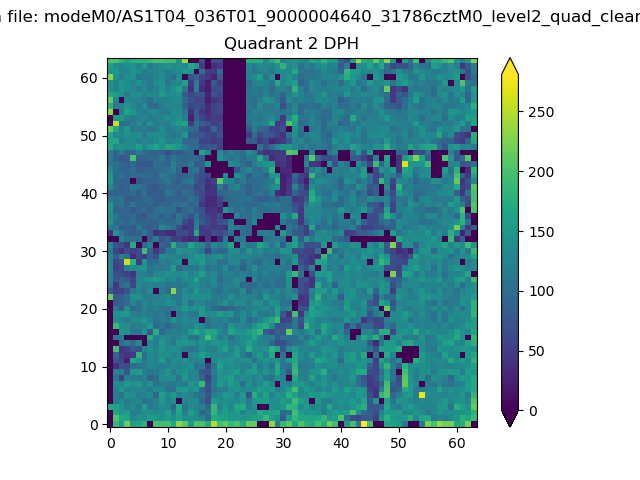 |
Quadrant C |
| Plot type | Count rate plots | Images |
|---|---|---|
| Comparison with Poisson distribution Blue bars denote a histogram of data divided into 1 sec bins. Red curve is a Poisson curve with rate = median count rate of data. |
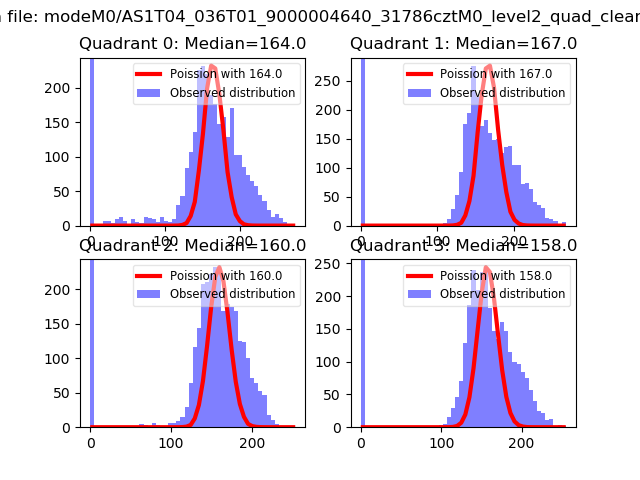 |
 |
| Quadrant-wise count rates Data is divided into 100 sec bins |
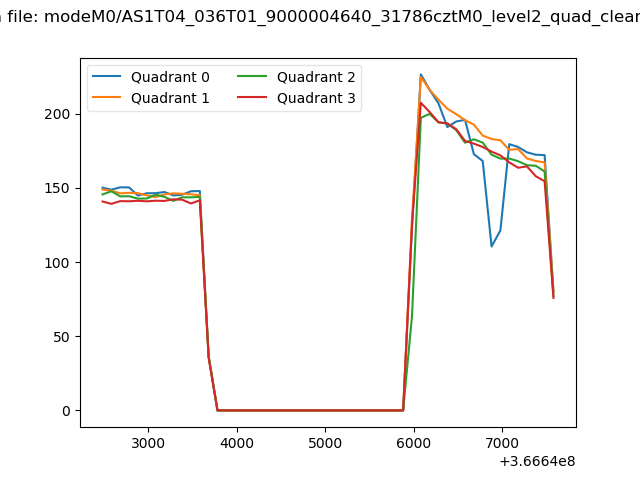 |
|
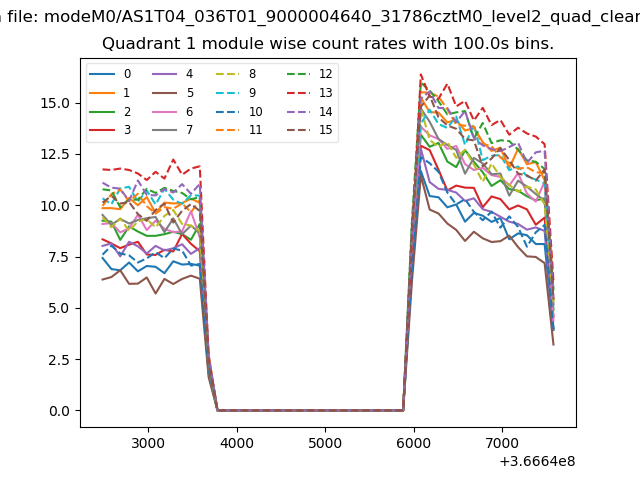
| Module-wise count rates for Quadrant A Data is divided into 100 sec bins |
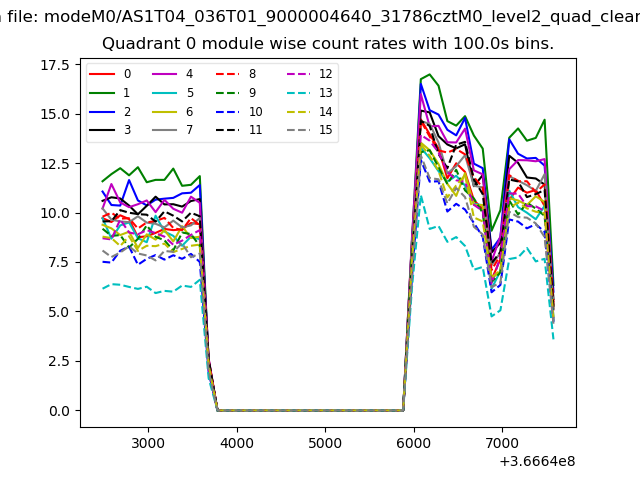 |
 |
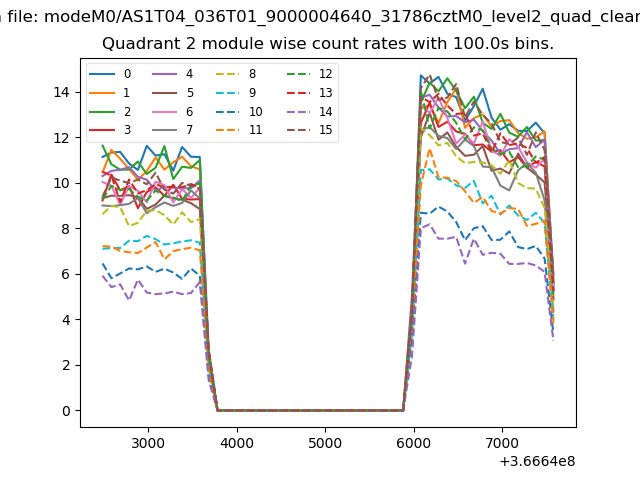
| Module-wise count rates for Quadrant B Data is divided into 100 sec bins |
 |
 |
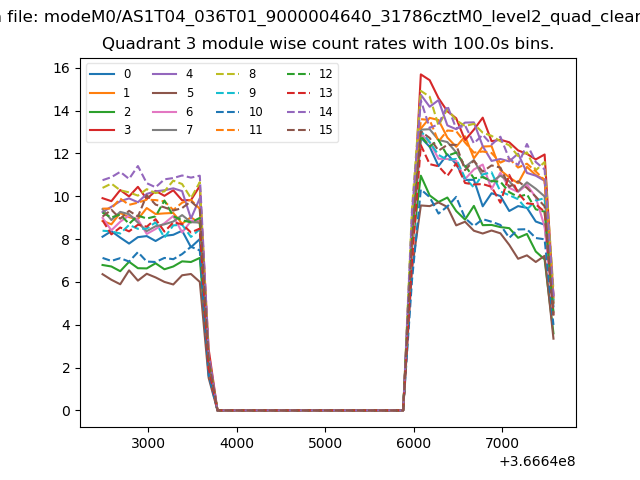
| Module-wise count rates for Quadrant C Data is divided into 100 sec bins |
 |
 |
| Module-wise count rates for Quadrant D Data is divided into 100 sec bins |
 |
 |
| Parameter | Plot |
|---|---|
| CZT HV Monitor | 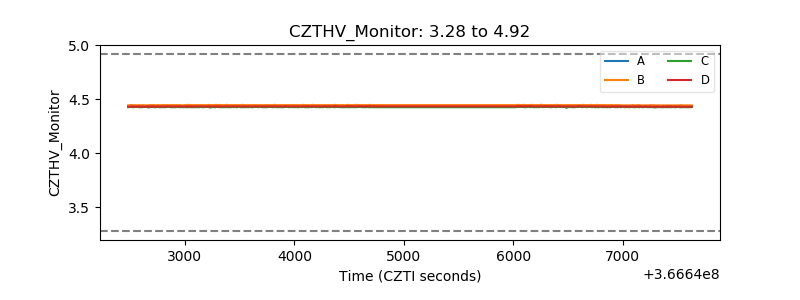 |
| D_VDD | 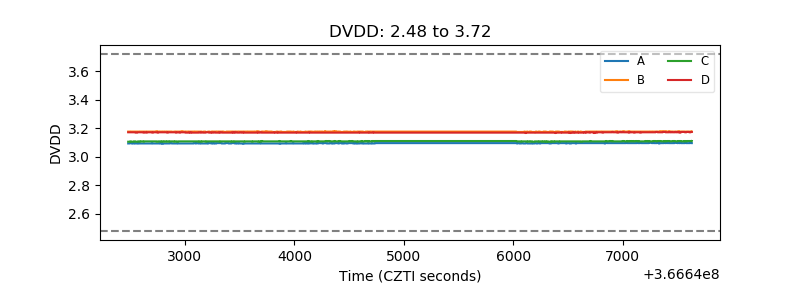 |
| Temperature 1 | 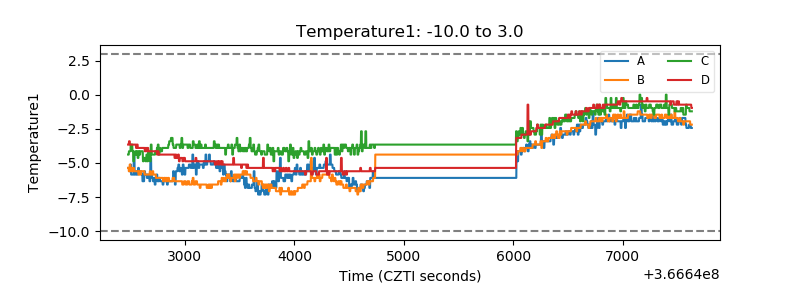 |
| Veto HV Monitor | 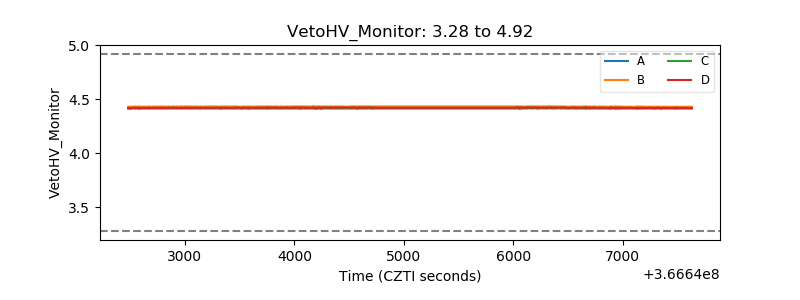 |
| Veto LLD | 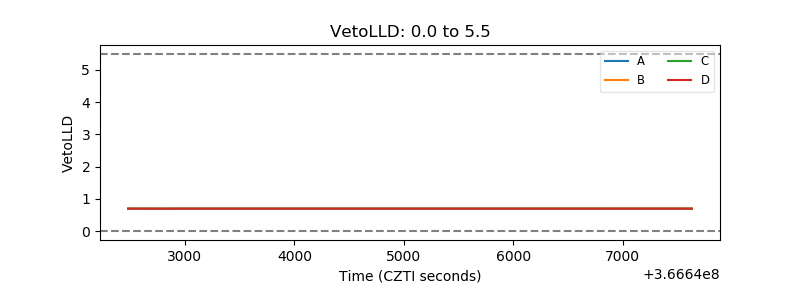 |
| Alpha Counter | 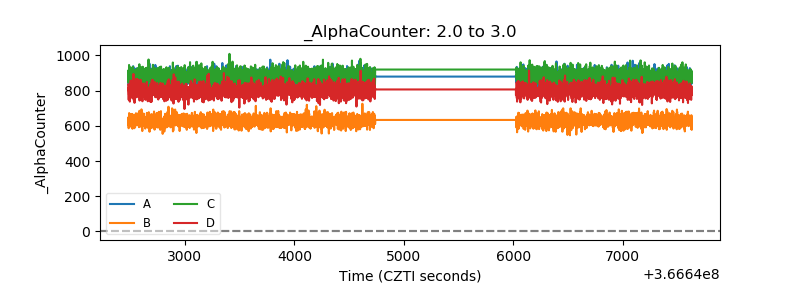 |
| _CPM_Rate | 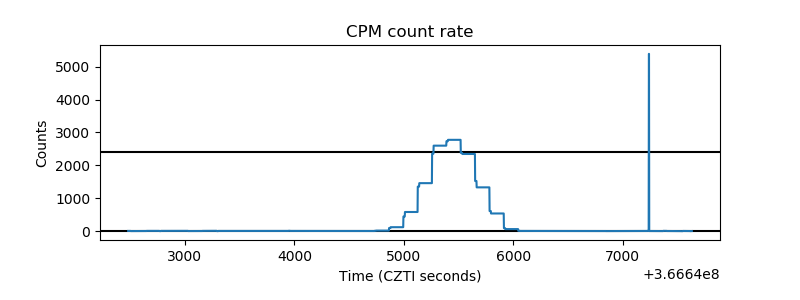 |
| CZT Counter | 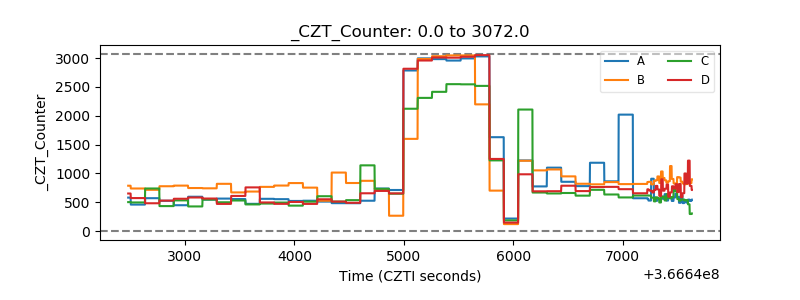 |
| +2.5 Volts monitor |  |
| +5 Volts monitor | 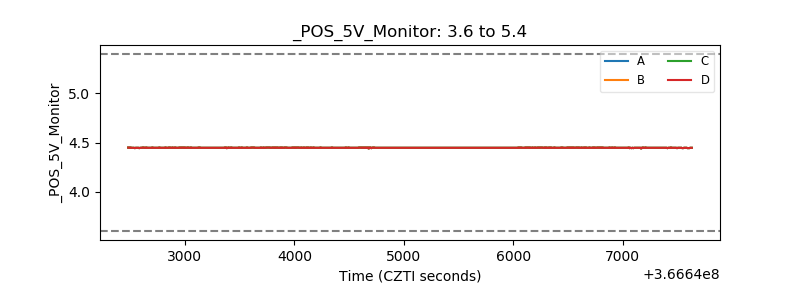 |
| _ROLL_ROT | 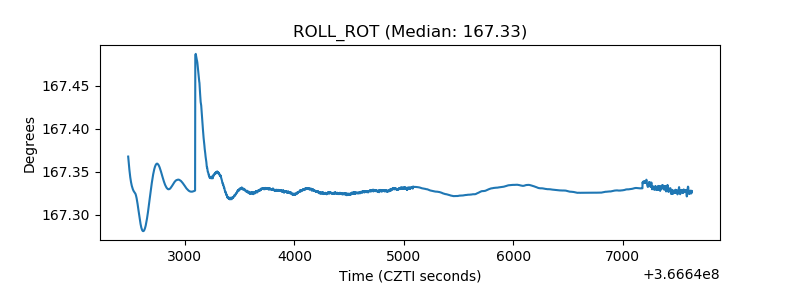 |
| _Roll_DEC | 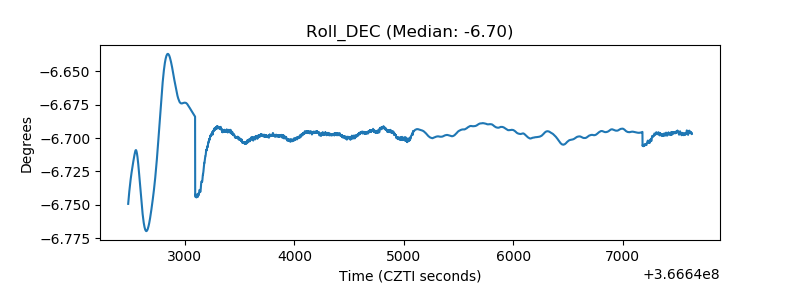 |
| _Roll_RA | 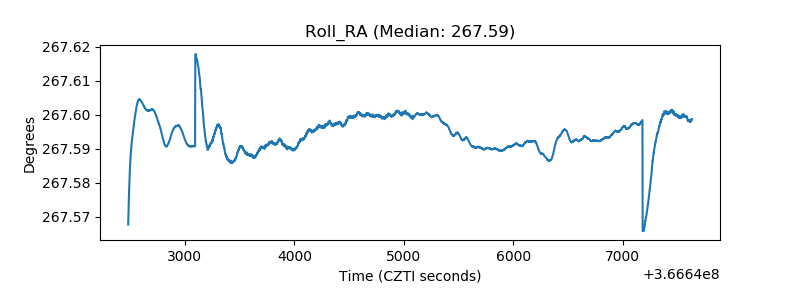 |
| Veto Counter | 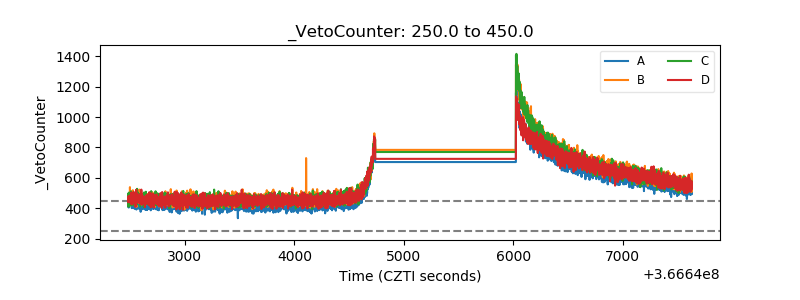 |