| Param | Original file | Final file |
|---|---|---|
| Filename | modeM0/AS1T04_036T01_9000004640_31787cztM0_level2.evt | modeM0/AS1T04_036T01_9000004640_31787cztM0_level2_quad_clean.evt |
| Size (bytes) | 589,852,800 | 113,572,800 |
| Size | 562.5 MB | 108.3 MB |
| Events in quadrant A | 3,930,348 | 775,159 |
| Events in quadrant B | 5,078,351 | 784,455 |
| Events in quadrant C | 3,540,201 | 746,984 |
| Events in quadrant D | 4,907,765 | 712,464 |
| Mode M9 | |||
|---|---|---|---|
| Quadrant | BADHDUFLAG | Total packets | Discarded packets |
| A | 0 | 14 | 0 |
| B | 0 | 14 | 0 |
| C | 0 | 14 | 0 |
| D | 0 | 14 | 0 |
| Mode M0 | |||
|---|---|---|---|
| Quadrant | BADHDUFLAG | Total packets | Discarded packets |
| A | 0 | 15581 | 1 |
| B | 0 | 18849 | 1 |
| C | 0 | 14418 | 1 |
| D | 0 | 18925 | 1 |
| Mode SS | |||
|---|---|---|---|
| Quadrant | BADHDUFLAG | Total packets | Discarded packets |
| A | 0 | 122 | 0 |
| B | 0 | 122 | 0 |
| C | 0 | 122 | 0 |
| D | 0 | 122 | 0 |
| Quadrant | Total seconds | Saturated seconds | Saturation percentage |
|---|---|---|---|
| A | 6022 | 339 | 5.629359% |
| B | 6023 | 171 | 2.839117% |
| C | 6023 | 215 | 3.569650% |
| D | 6022 | 438 | 7.273331% |
Noise dominated data is calculated using 1-second bins in cleaned event files. If a bin has >2000 counts, and if more than 50% of those come from <1% of pixels, then it is considered to be noise-dominated and hence unusable.
| Quadrant | # 1 sec bins | Bins with >0 counts | Bins with >2000 counts | High rate bins dominated by noise | Noise dominated (total time) | Noise dominated (detector-on time) | Marked lightcurve |
|---|---|---|---|---|---|---|---|
| A | 7337 | 6023 | 107 | 107 | 1.46% | 1.78% | 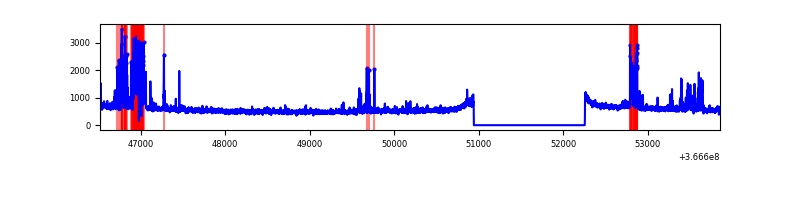 |
| B | 7338 | 6024 | 5 | 5 | 0.07% | 0.08% | 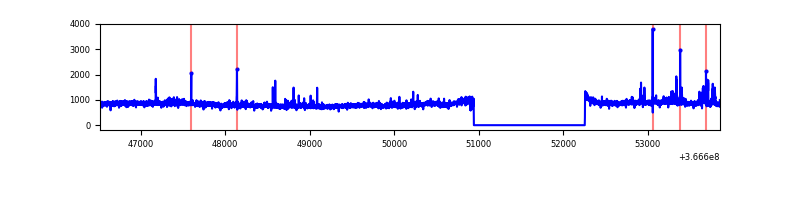 |
| C | 7338 | 6024 | 29 | 29 | 0.40% | 0.48% | 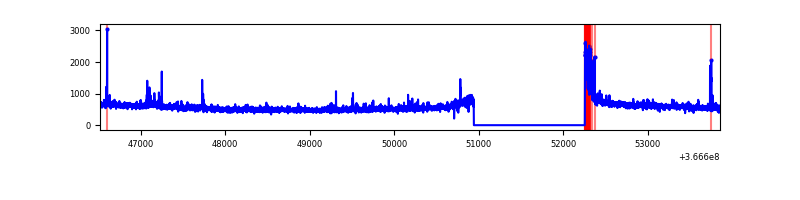 |
| D | 7337 | 6023 | 266 | 266 | 3.63% | 4.42% | 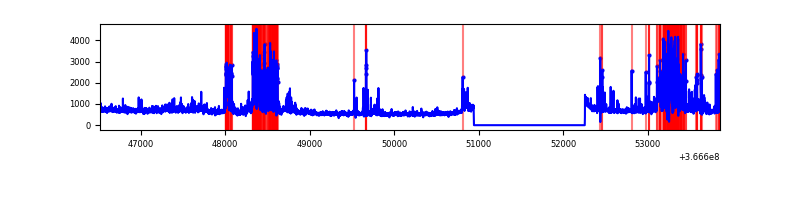 |
Top three noisy pixels from each quadrant. If the there are fewer than three noisy pixels in the level2.evt file, extra rows are filled as -1
| Pixel properties | Quadrant properties | ||||||
|---|---|---|---|---|---|---|---|
| Quadrant | DetID | PixID | Counts | Sigma | Mean | Median | Sigma |
| A | 0 | 13 | 629671 | 3722.65 | 850 | 835 | 168.9 |
| A | 13 | 6 | 12836 | 71.04 | 850 | 835 | 168.9 |
| A | 13 | 254 | 11792 | 64.86 | 850 | 835 | 168.9 |
| B | 6 | 159 | 1624432 | 10415.82 | 835 | 820 | 155.9 |
| B | 5 | 172 | 63354 | 401.17 | 835 | 820 | 155.9 |
| B | 0 | 229 | 28344 | 176.57 | 835 | 820 | 155.9 |
| C | 0 | 10 | 174540 | 940.05 | 804 | 813 | 184.8 |
| C | 14 | 238 | 135111 | 726.7 | 804 | 813 | 184.8 |
| C | 4 | 175 | 26267 | 137.73 | 804 | 813 | 184.8 |
| D | 8 | 195 | 640162 | 3307.4 | 812 | 794 | 193.3 |
| D | 12 | 218 | 551847 | 2850.55 | 812 | 794 | 193.3 |
| D | 13 | 249 | 407929 | 2106.07 | 812 | 794 | 193.3 |
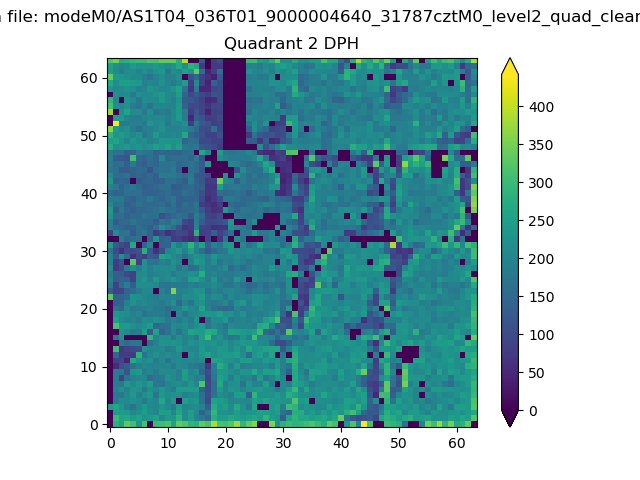
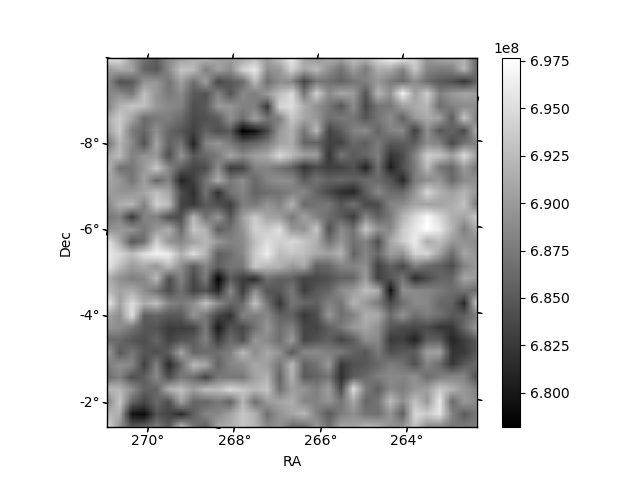
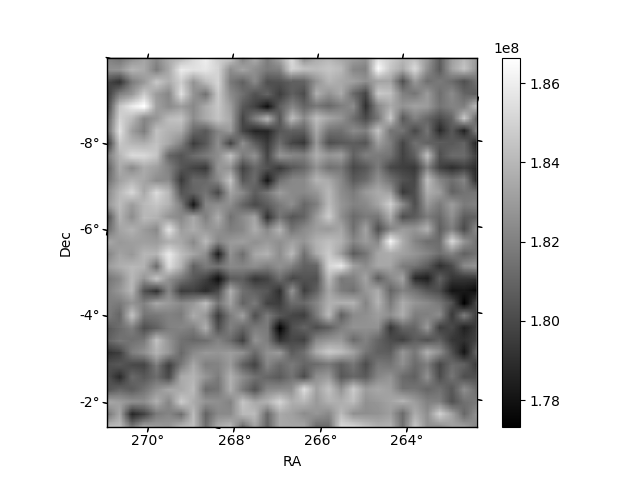
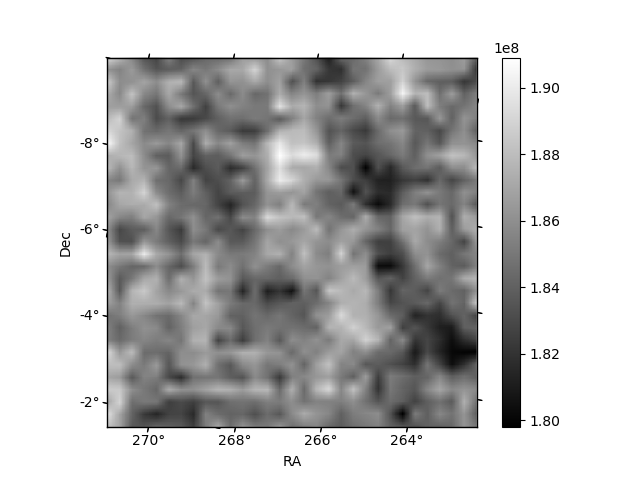
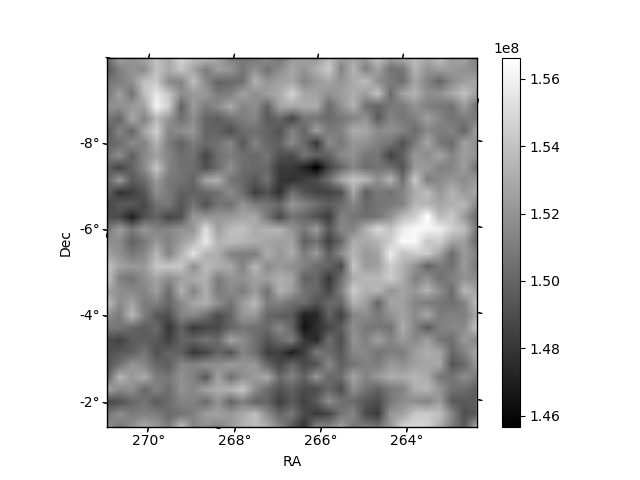
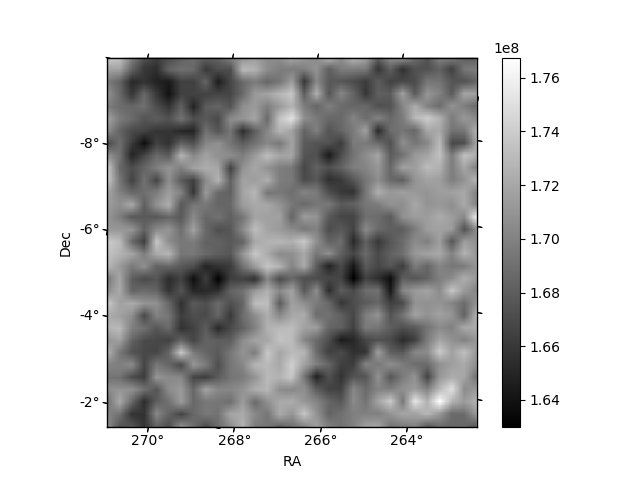
Histogram calculated using DETX and DETY for each event in the final _common_clean file
| Quadrant A | 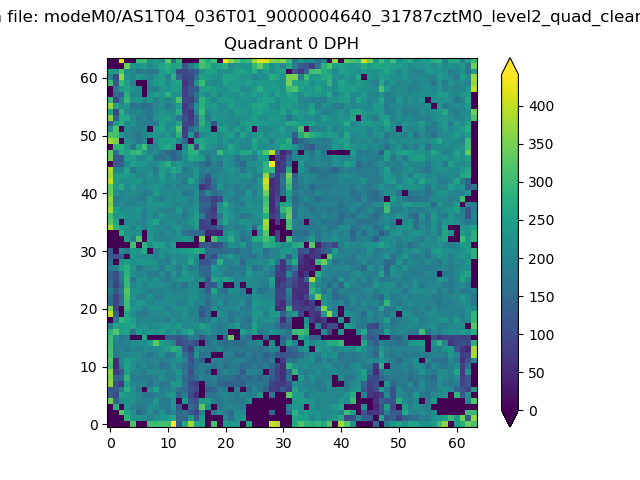 |
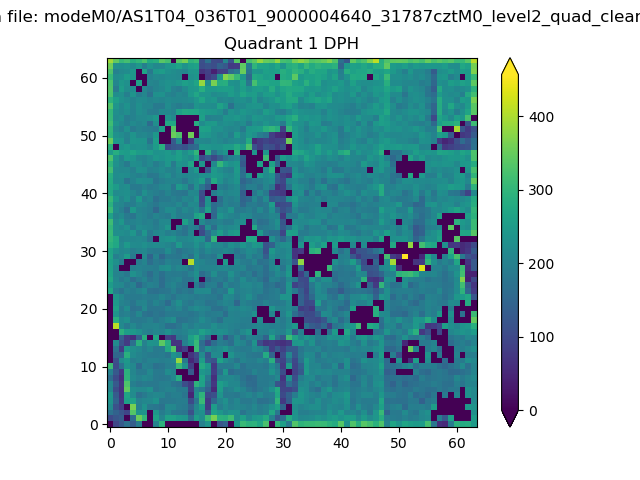 |
Quadrant B |
|---|---|---|---|
| Quadrant D | 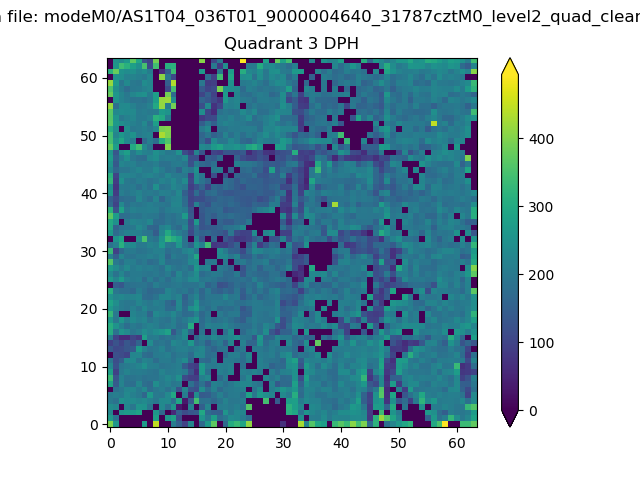 |
 |
Quadrant C |
| Plot type | Count rate plots | Images |
|---|---|---|
| Comparison with Poisson distribution Blue bars denote a histogram of data divided into 1 sec bins. Red curve is a Poisson curve with rate = median count rate of data. |
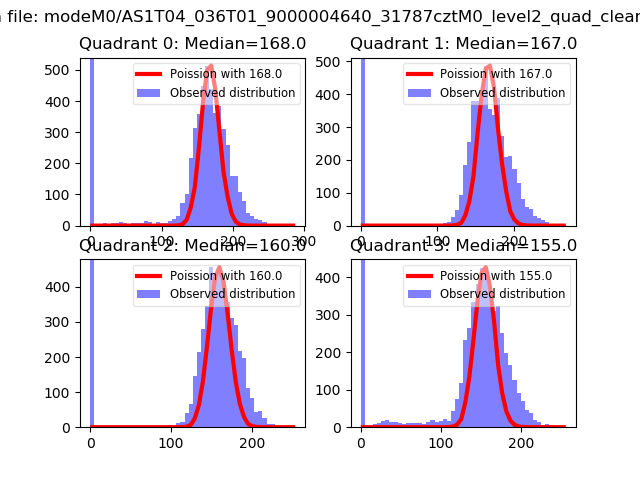 |
 |
| Quadrant-wise count rates Data is divided into 100 sec bins |
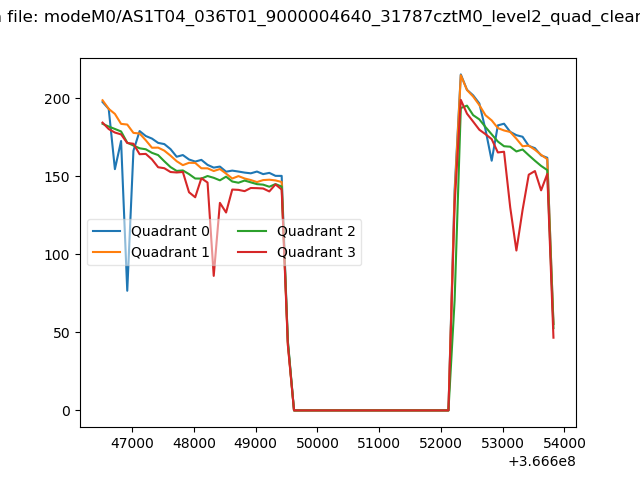 |
|
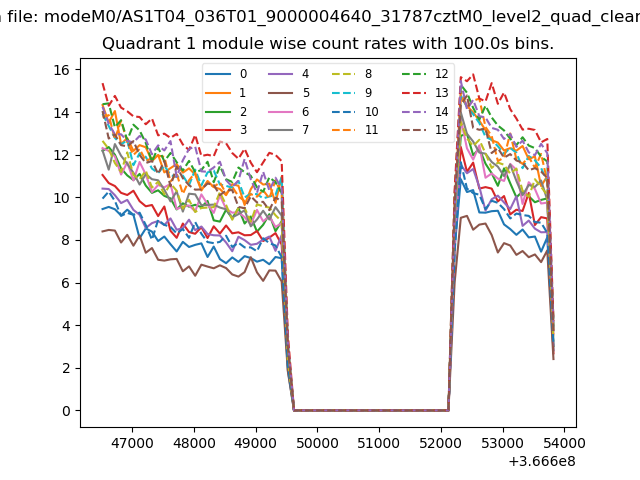
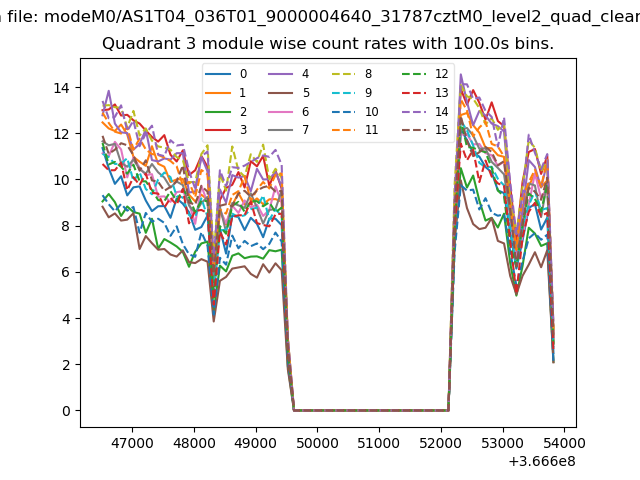
| Module-wise count rates for Quadrant A Data is divided into 100 sec bins |
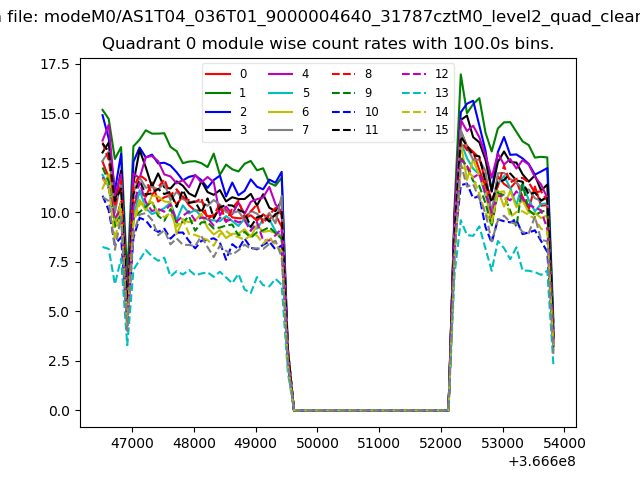 |
 |
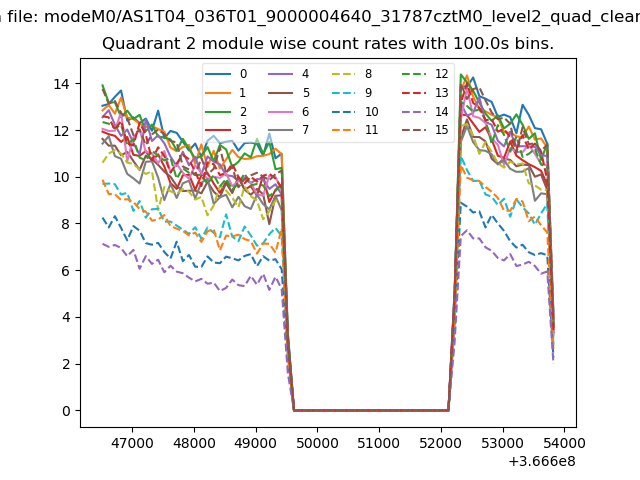
| Module-wise count rates for Quadrant B Data is divided into 100 sec bins |
 |
 |
| Module-wise count rates for Quadrant C Data is divided into 100 sec bins |
 |
 |
| Module-wise count rates for Quadrant D Data is divided into 100 sec bins |
 |
 |
| Parameter | Plot |
|---|---|
| CZT HV Monitor | 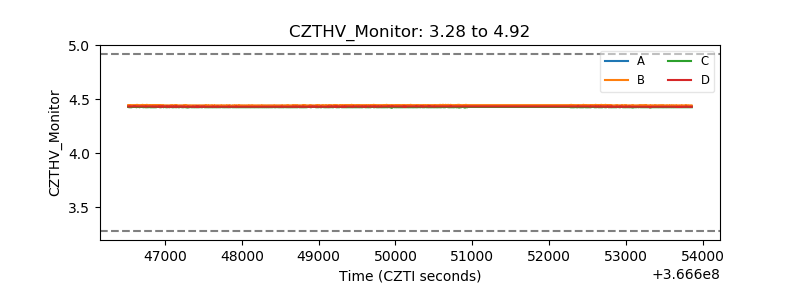 |
| D_VDD | 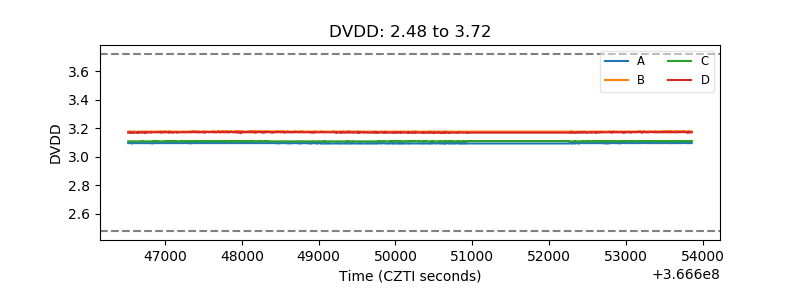 |
| Temperature 1 | 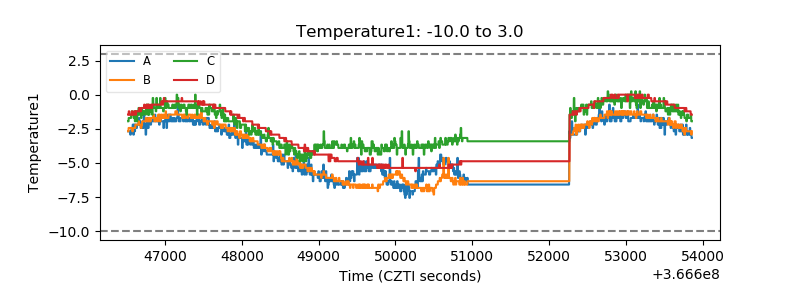 |
| Veto HV Monitor | 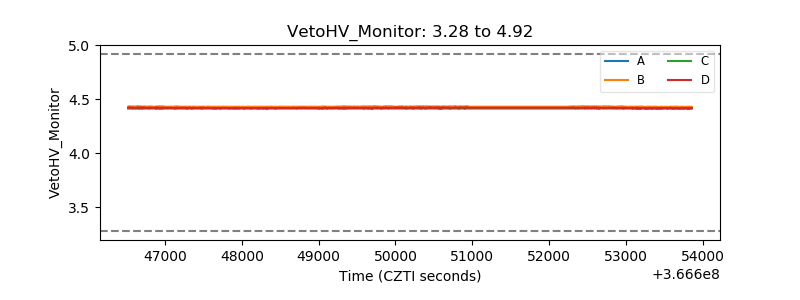 |
| Veto LLD | 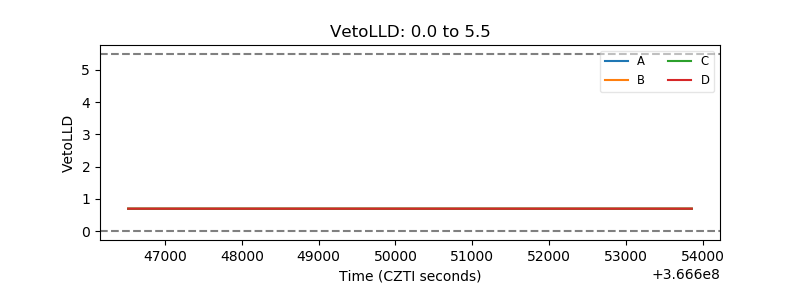 |
| Alpha Counter | 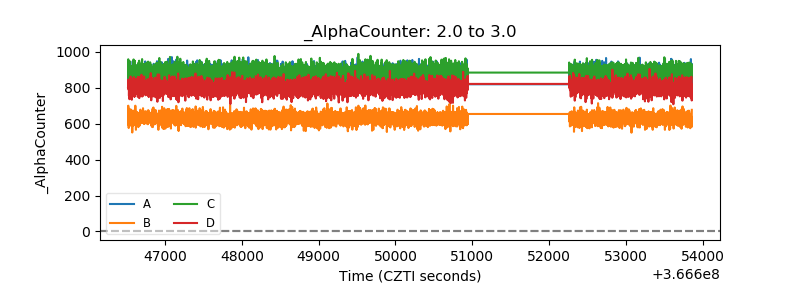 |
| _CPM_Rate | 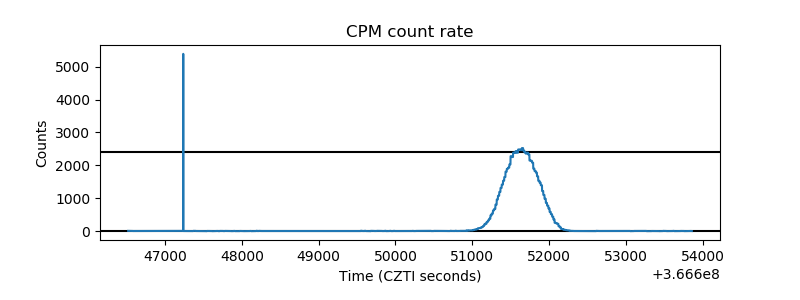 |
| CZT Counter | 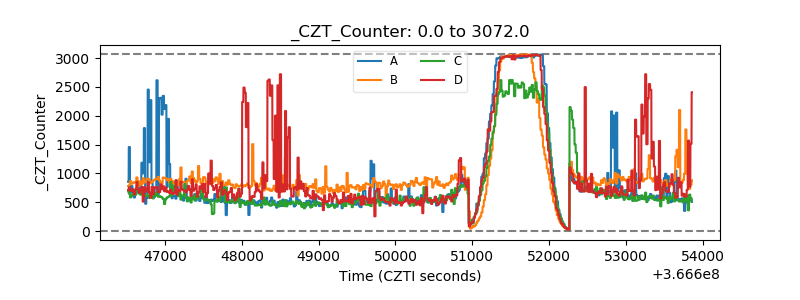 |
| +2.5 Volts monitor |  |
| +5 Volts monitor |  |
| _ROLL_ROT | 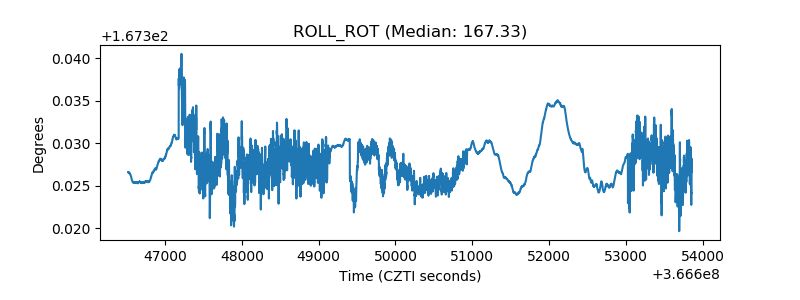 |
| _Roll_DEC | 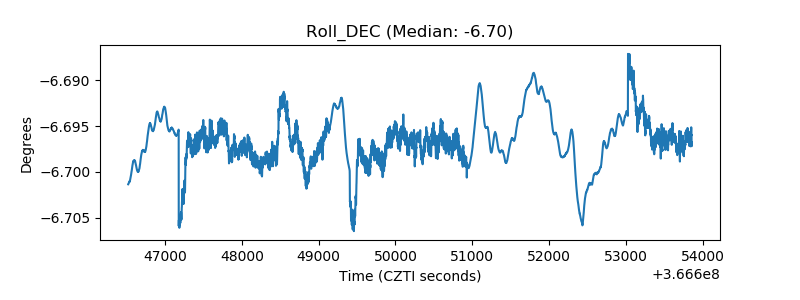 |
| _Roll_RA | 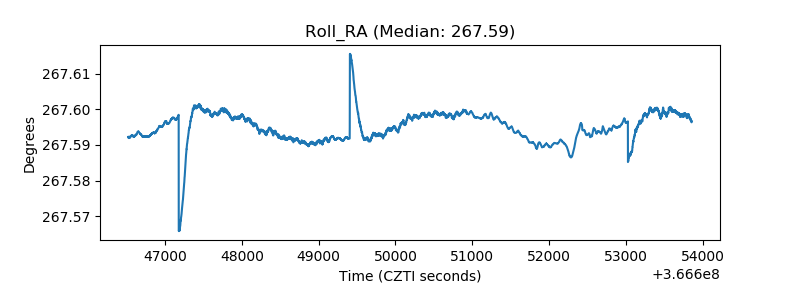 |
| Veto Counter | 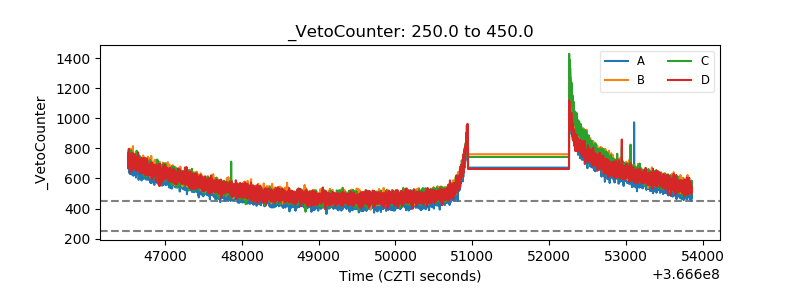 |