| Param | Original file | Final file |
|---|---|---|
| Filename | modeM0/AS1T04_036T01_9000004640_31788cztM0_level2.evt | modeM0/AS1T04_036T01_9000004640_31788cztM0_level2_quad_clean.evt |
| Size (bytes) | 178,280,640 | 38,180,160 |
| Size | 170.0 MB | 36.4 MB |
| Events in quadrant A | 1,132,604 | 271,650 |
| Events in quadrant B | 1,430,996 | 273,629 |
| Events in quadrant C | 938,162 | 262,170 |
| Events in quadrant D | 1,787,285 | 230,833 |
| Mode M0 | |||
|---|---|---|---|
| Quadrant | BADHDUFLAG | Total packets | Discarded packets |
| A | 0 | 4504 | 0 |
| B | 0 | 5178 | 0 |
| C | 0 | 3856 | 0 |
| D | 0 | 6557 | 0 |
| Mode SS | |||
|---|---|---|---|
| Quadrant | BADHDUFLAG | Total packets | Discarded packets |
| A | 0 | 32 | 0 |
| B | 0 | 32 | 0 |
| C | 0 | 32 | 0 |
| D | 0 | 32 | 0 |
| Quadrant | Total seconds | Saturated seconds | Saturation percentage |
|---|---|---|---|
| A | 1593 | 63 | 3.954802% |
| B | 1594 | 12 | 0.752823% |
| C | 1594 | 9 | 0.564617% |
| D | 1594 | 292 | 18.318695% |
Noise dominated data is calculated using 1-second bins in cleaned event files. If a bin has >2000 counts, and if more than 50% of those come from <1% of pixels, then it is considered to be noise-dominated and hence unusable.
| Quadrant | # 1 sec bins | Bins with >0 counts | Bins with >2000 counts | High rate bins dominated by noise | Noise dominated (total time) | Noise dominated (detector-on time) | Marked lightcurve |
|---|---|---|---|---|---|---|---|
| A | 1593 | 1593 | 29 | 29 | 1.82% | 1.82% | 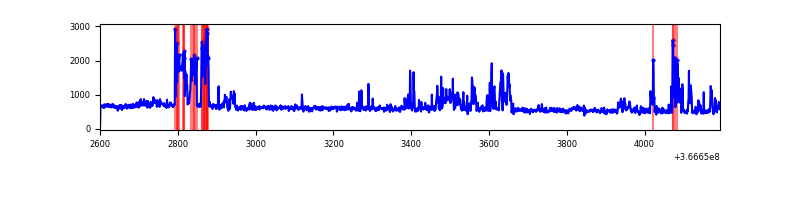 |
| B | 1594 | 1594 | 3 | 3 | 0.19% | 0.19% | 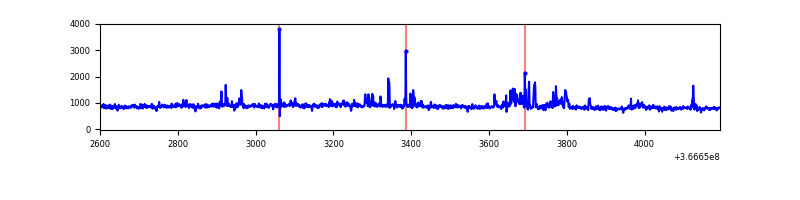 |
| C | 1594 | 1594 | 1 | 1 | 0.06% | 0.06% |  |
| D | 1594 | 1594 | 207 | 207 | 12.99% | 12.99% | 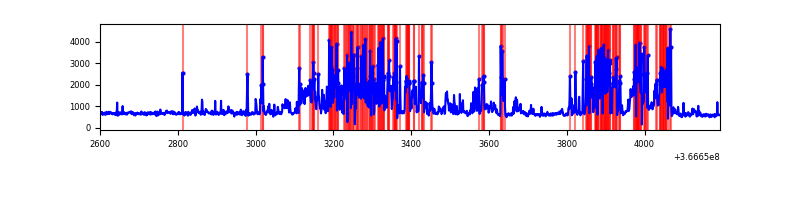 |
Top three noisy pixels from each quadrant. If the there are fewer than three noisy pixels in the level2.evt file, extra rows are filled as -1
| Pixel properties | Quadrant properties | ||||||
|---|---|---|---|---|---|---|---|
| Quadrant | DetID | PixID | Counts | Sigma | Mean | Median | Sigma |
| A | 0 | 13 | 241052 | 5020.6 | 230 | 226 | 48.0 |
| A | 13 | 6 | 5135 | 102.34 | 230 | 226 | 48.0 |
| A | 13 | 254 | 2885 | 55.43 | 230 | 226 | 48.0 |
| B | 6 | 159 | 454988 | 10567.31 | 224 | 219 | 43.0 |
| B | 5 | 172 | 60542 | 1401.7 | 224 | 219 | 43.0 |
| B | 10 | 245 | 12226 | 279.0 | 224 | 219 | 43.0 |
| C | 14 | 238 | 35165 | 679.67 | 216 | 219 | 51.4 |
| C | 0 | 10 | 25910 | 499.67 | 216 | 219 | 51.4 |
| C | 3 | 233 | 17545 | 336.98 | 216 | 219 | 51.4 |
| D | 13 | 249 | 696646 | 14074.61 | 204 | 200 | 49.5 |
| D | 8 | 195 | 183524 | 3704.83 | 204 | 200 | 49.5 |
| D | 12 | 218 | 84510 | 1703.84 | 204 | 200 | 49.5 |
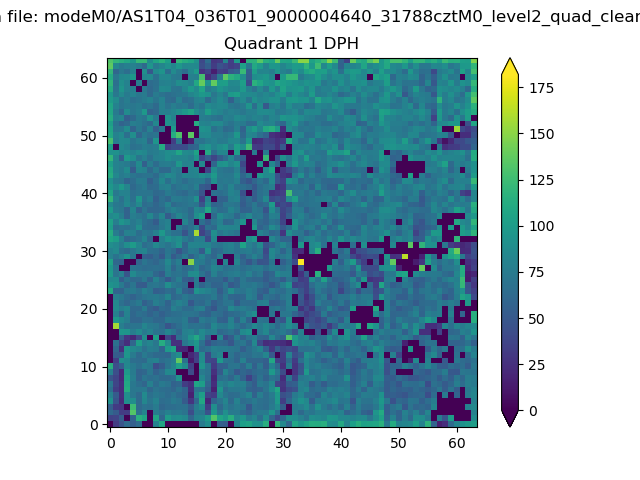
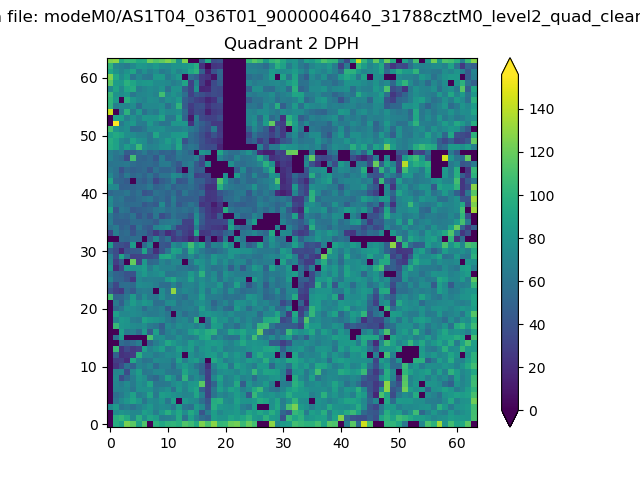
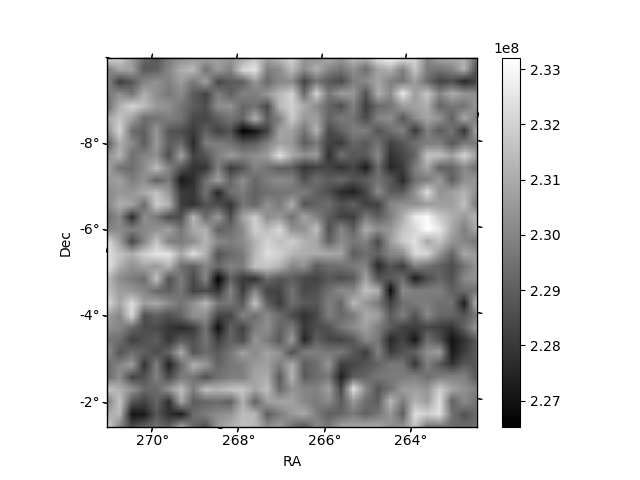
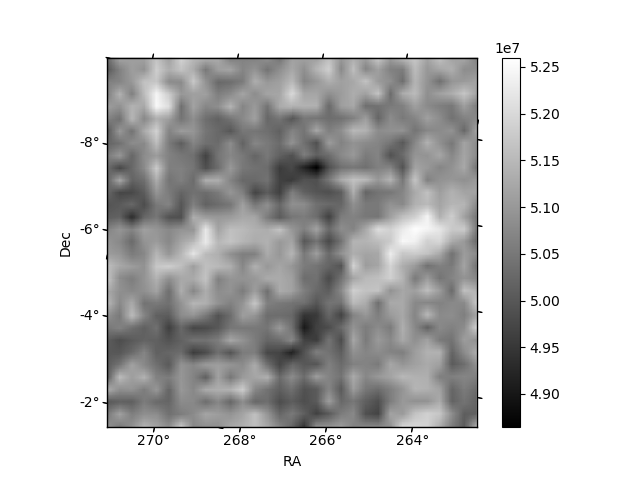
Histogram calculated using DETX and DETY for each event in the final _common_clean file
| Quadrant A | 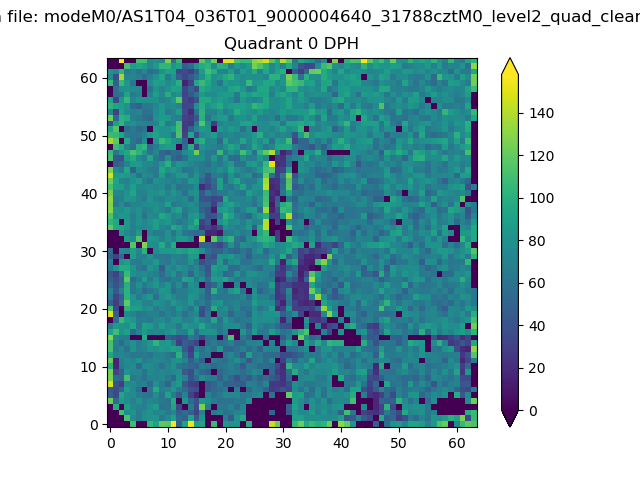 |
 |
Quadrant B |
|---|---|---|---|
| Quadrant D | 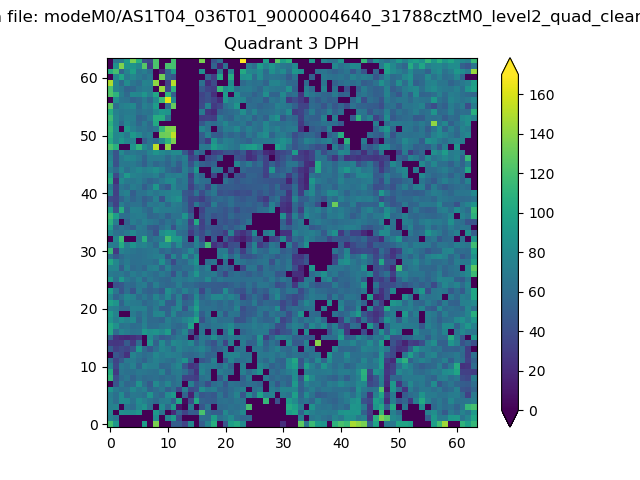 |
 |
Quadrant C |
| Plot type | Count rate plots | Images |
|---|---|---|
| Comparison with Poisson distribution Blue bars denote a histogram of data divided into 1 sec bins. Red curve is a Poisson curve with rate = median count rate of data. |
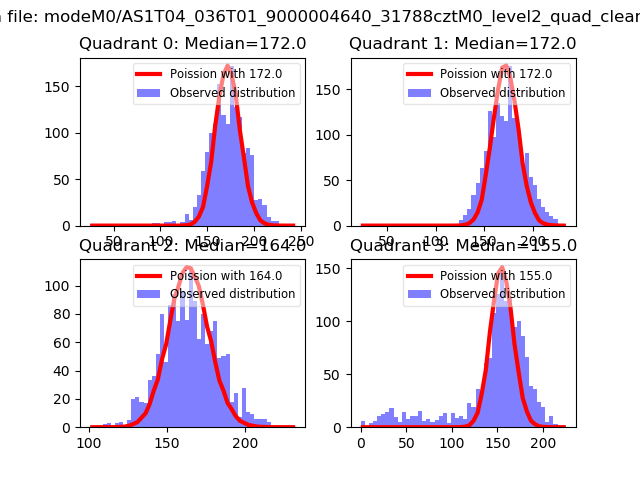 |
 |
| Quadrant-wise count rates Data is divided into 100 sec bins |
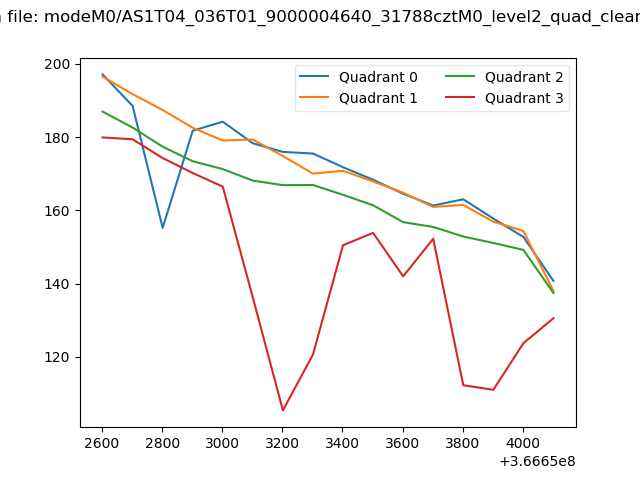 |
|
| Module-wise count rates for Quadrant A Data is divided into 100 sec bins |
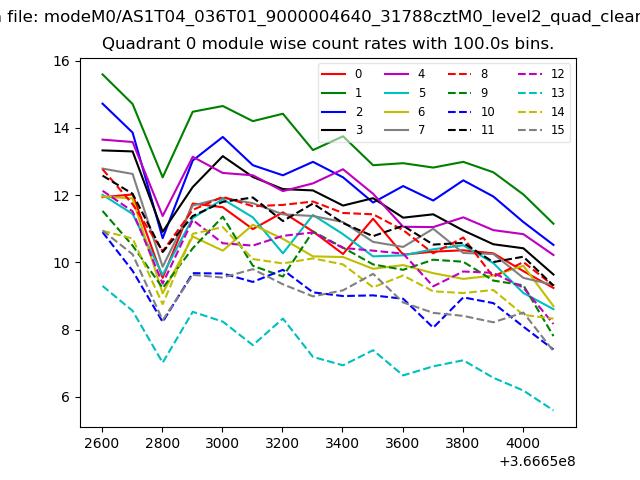 |
 |
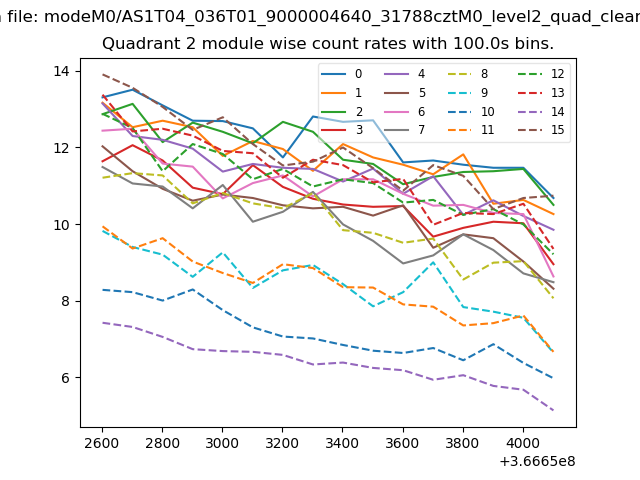
| Module-wise count rates for Quadrant B Data is divided into 100 sec bins |
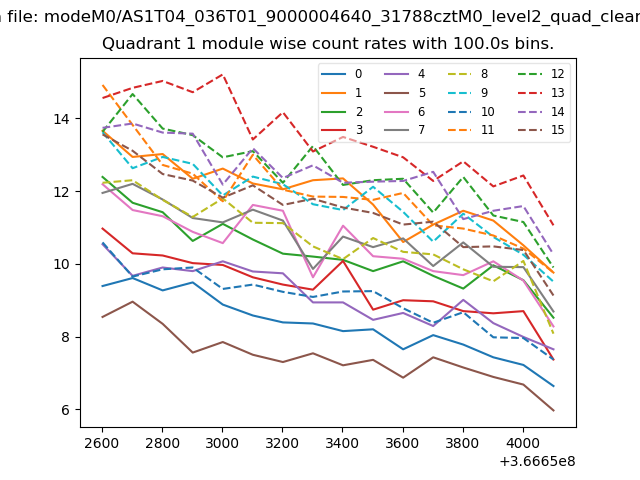 |
 |
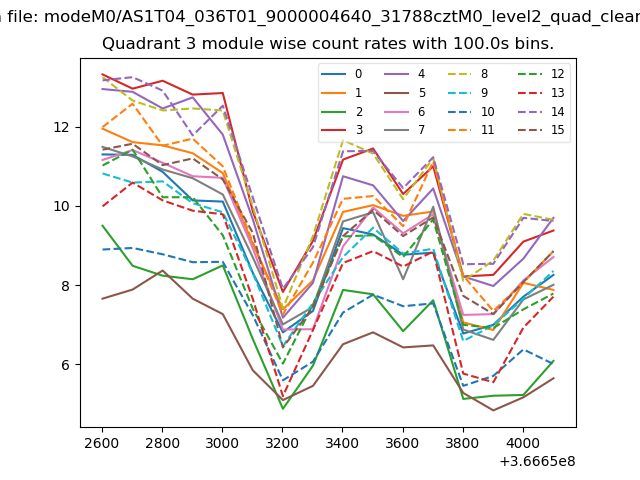
| Module-wise count rates for Quadrant C Data is divided into 100 sec bins |
 |
 |
| Module-wise count rates for Quadrant D Data is divided into 100 sec bins |
 |
 |
| Parameter | Plot |
|---|---|
| CZT HV Monitor |  |
| D_VDD | 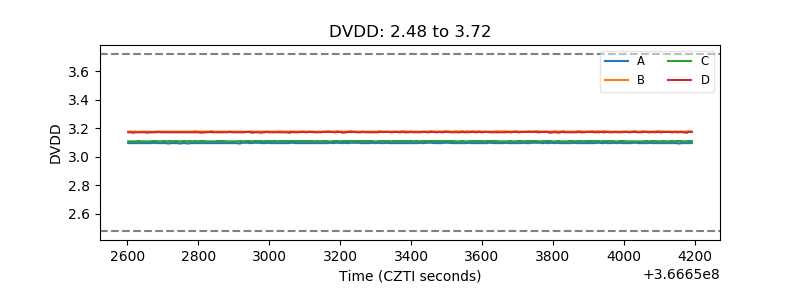 |
| Temperature 1 | 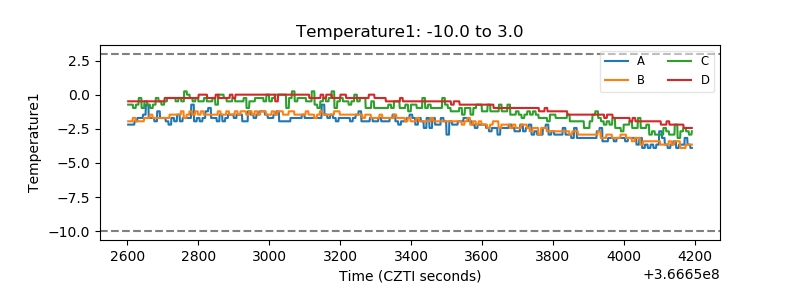 |
| Veto HV Monitor | 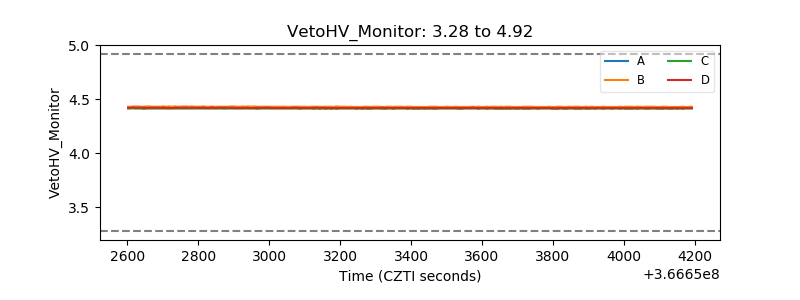 |
| Veto LLD | 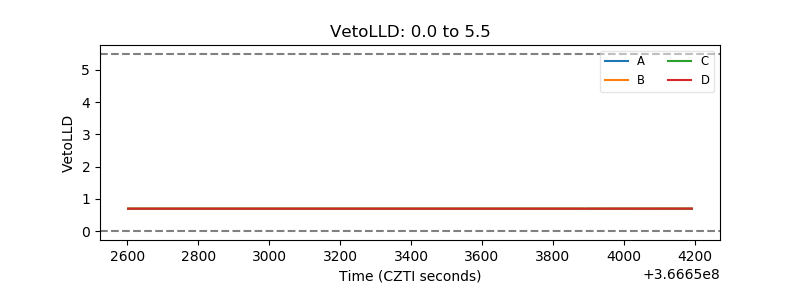 |
| Alpha Counter | 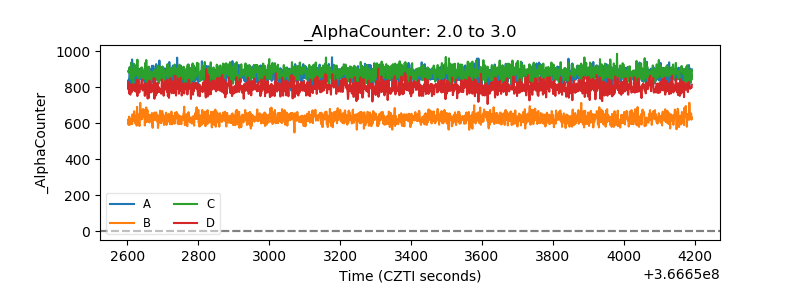 |
| _CPM_Rate | 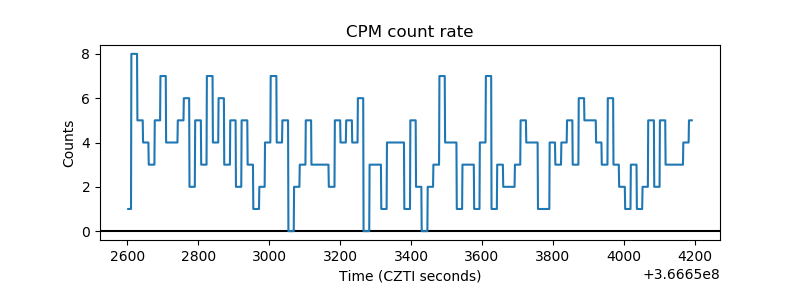 |
| CZT Counter | 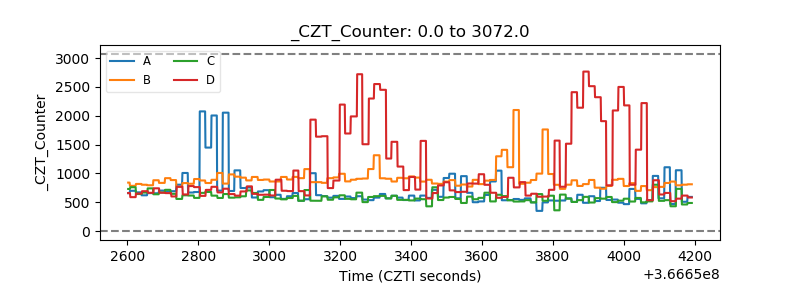 |
| +2.5 Volts monitor | 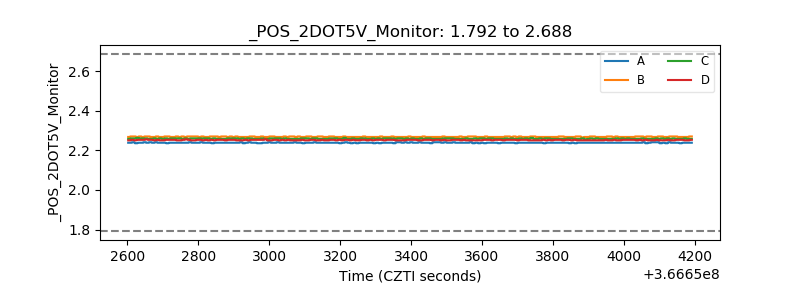 |
| +5 Volts monitor |  |
| _ROLL_ROT | 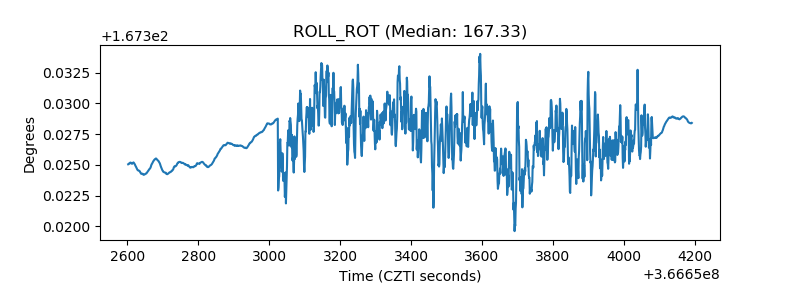 |
| _Roll_DEC | 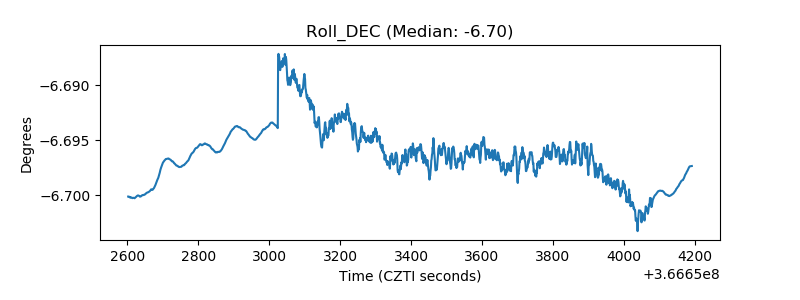 |
| _Roll_RA |  |
| Veto Counter | 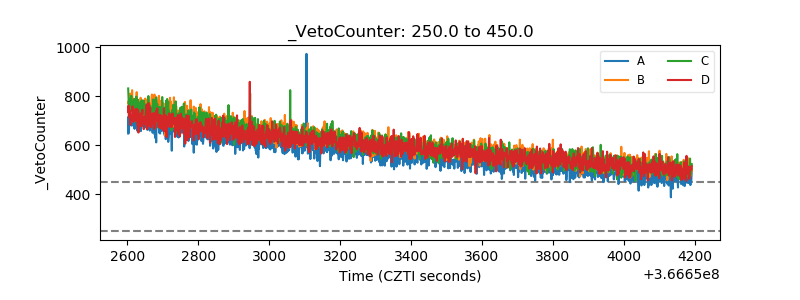 |