| Param | Original file | Final file |
|---|---|---|
| Filename | modeM0/AS1T04_041T01_9000004642_31788cztM0_level2.evt | modeM0/AS1T04_041T01_9000004642_31788cztM0_level2_quad_clean.evt |
| Size (bytes) | 317,525,760 | 58,910,400 |
| Size | 302.8 MB | 56.2 MB |
| Events in quadrant A | 2,169,794 | 395,155 |
| Events in quadrant B | 2,851,597 | 396,998 |
| Events in quadrant C | 2,164,930 | 371,176 |
| Events in quadrant D | 2,190,834 | 372,060 |
| Mode M9 | |||
|---|---|---|---|
| Quadrant | BADHDUFLAG | Total packets | Discarded packets |
| A | 0 | 13 | 0 |
| B | 0 | 13 | 0 |
| C | 0 | 13 | 0 |
| D | 0 | 13 | 0 |
| Mode M0 | |||
|---|---|---|---|
| Quadrant | BADHDUFLAG | Total packets | Discarded packets |
| A | 0 | 8721 | 1 |
| B | 0 | 10799 | 1 |
| C | 0 | 8678 | 1 |
| D | 0 | 8907 | 1 |
| Mode SS | |||
|---|---|---|---|
| Quadrant | BADHDUFLAG | Total packets | Discarded packets |
| A | 0 | 74 | 0 |
| B | 0 | 74 | 0 |
| C | 0 | 74 | 0 |
| D | 0 | 74 | 0 |
| Quadrant | Total seconds | Saturated seconds | Saturation percentage |
|---|---|---|---|
| A | 3499 | 176 | 5.030009% |
| B | 3499 | 183 | 5.230066% |
| C | 3499 | 234 | 6.687625% |
| D | 3499 | 108 | 3.086596% |
Noise dominated data is calculated using 1-second bins in cleaned event files. If a bin has >2000 counts, and if more than 50% of those come from <1% of pixels, then it is considered to be noise-dominated and hence unusable.
| Quadrant | # 1 sec bins | Bins with >0 counts | Bins with >2000 counts | High rate bins dominated by noise | Noise dominated (total time) | Noise dominated (detector-on time) | Marked lightcurve |
|---|---|---|---|---|---|---|---|
| A | 4819 | 3500 | 21 | 21 | 0.44% | 0.60% | 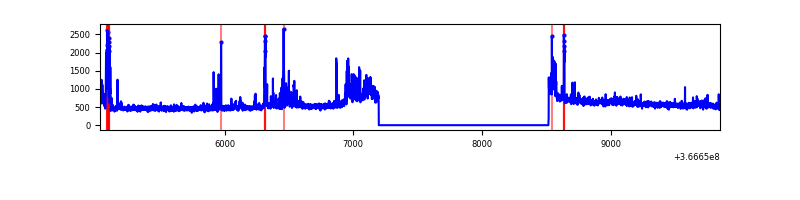 |
| B | 4819 | 3500 | 0 | 0 | 0.00% | 0.00% | 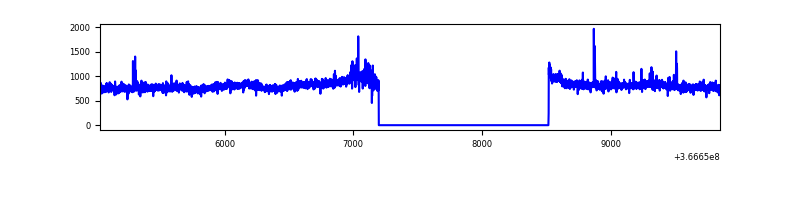 |
| C | 4819 | 3500 | 56 | 56 | 1.16% | 1.60% | 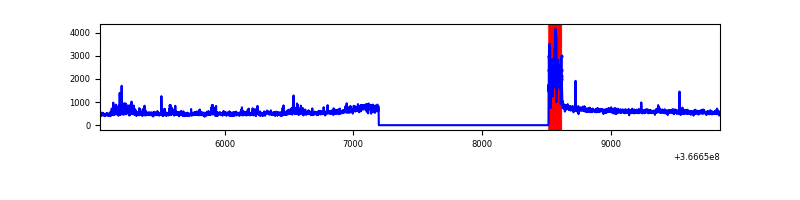 |
| D | 4819 | 3500 | 17 | 17 | 0.35% | 0.49% | 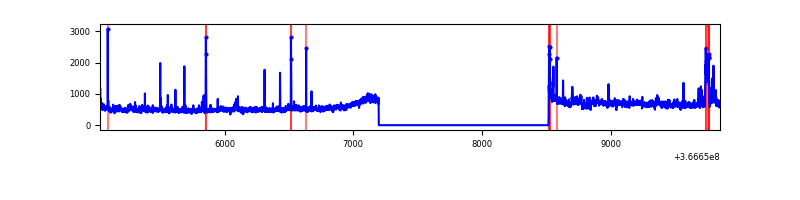 |
Top three noisy pixels from each quadrant. If the there are fewer than three noisy pixels in the level2.evt file, extra rows are filled as -1
| Pixel properties | Quadrant properties | ||||||
|---|---|---|---|---|---|---|---|
| Quadrant | DetID | PixID | Counts | Sigma | Mean | Median | Sigma |
| A | 0 | 13 | 277431 | 2877.37 | 486 | 477 | 96.3 |
| A | 8 | 255 | 9333 | 92.01 | 486 | 477 | 96.3 |
| A | 13 | 6 | 8887 | 87.37 | 486 | 477 | 96.3 |
| B | 6 | 159 | 931713 | 10294.47 | 477 | 467 | 90.5 |
| B | 10 | 245 | 30878 | 336.18 | 477 | 467 | 90.5 |
| B | 12 | 111 | 10824 | 114.49 | 477 | 467 | 90.5 |
| C | 0 | 10 | 276629 | 2574.35 | 457 | 462 | 107.3 |
| C | 14 | 238 | 74331 | 688.58 | 457 | 462 | 107.3 |
| C | 4 | 175 | 12465 | 111.89 | 457 | 462 | 107.3 |
| D | 8 | 195 | 239562 | 2135.24 | 474 | 463 | 112.0 |
| D | 12 | 227 | 73906 | 655.87 | 474 | 463 | 112.0 |
| D | 2 | 250 | 40717 | 359.48 | 474 | 463 | 112.0 |
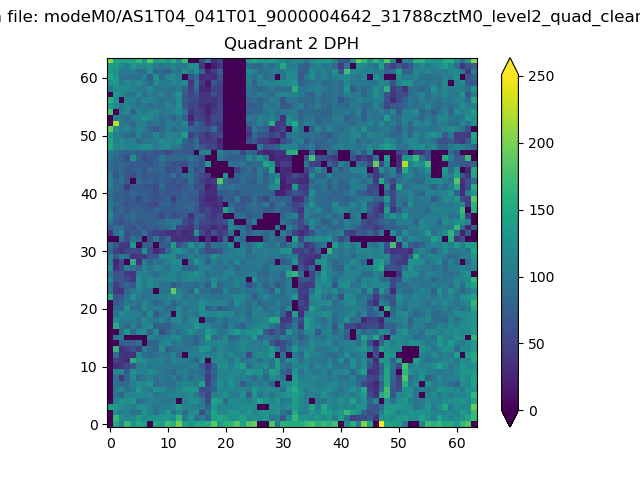
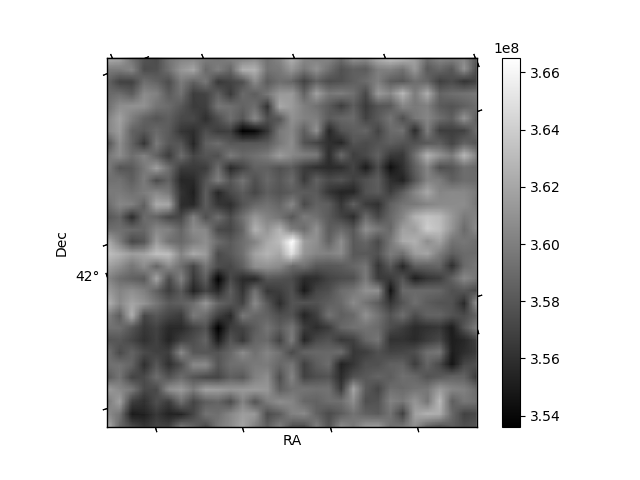
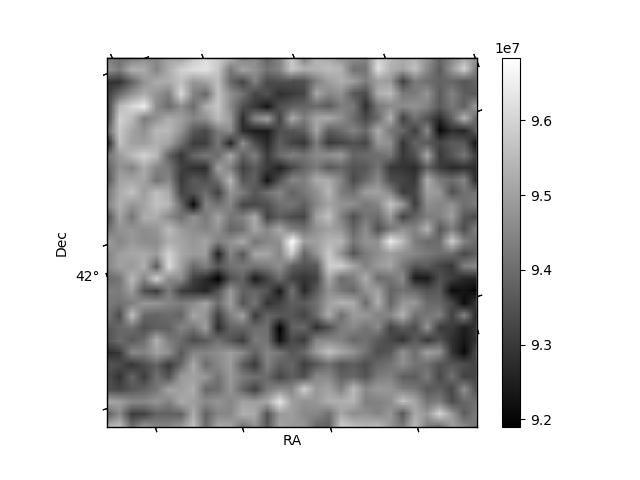
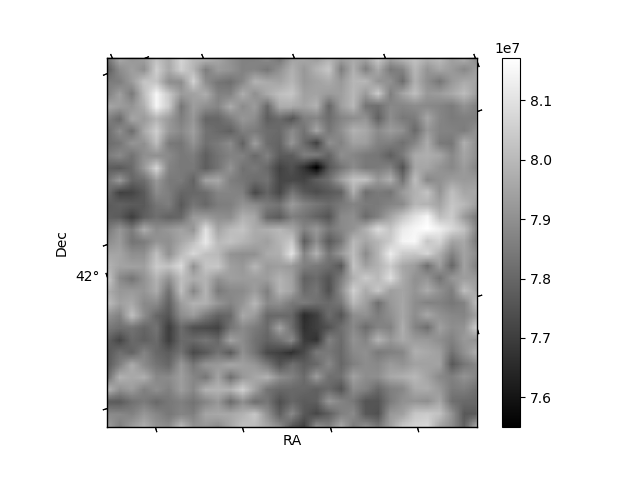
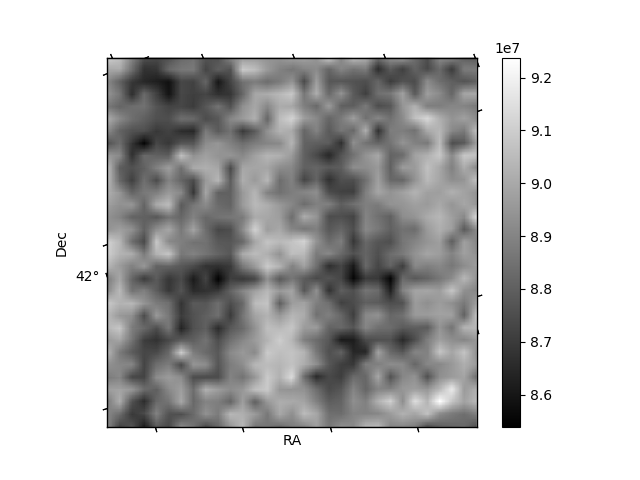
Histogram calculated using DETX and DETY for each event in the final _common_clean file
| Quadrant A | 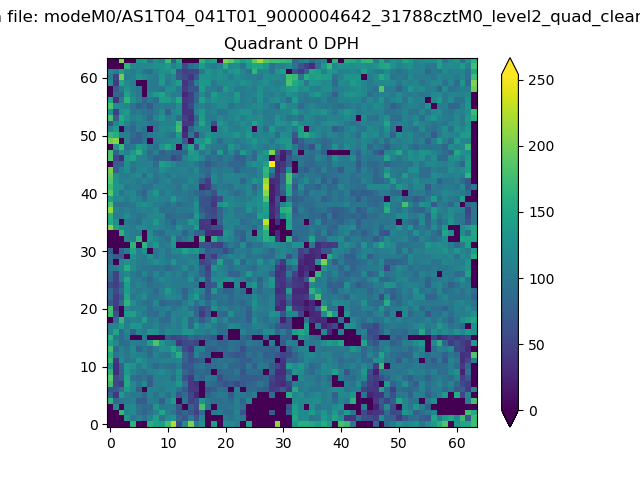 |
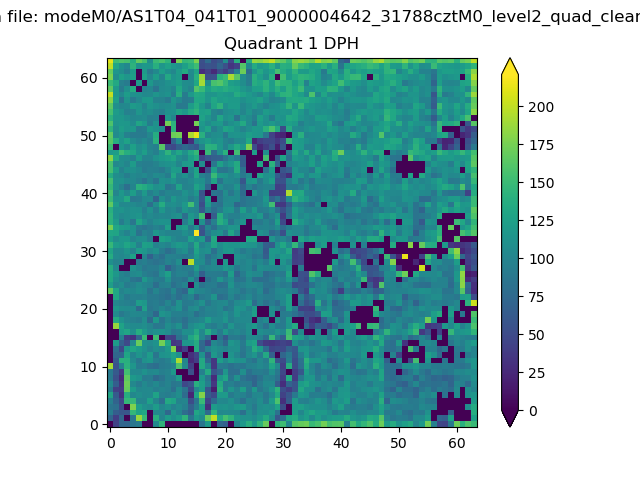 |
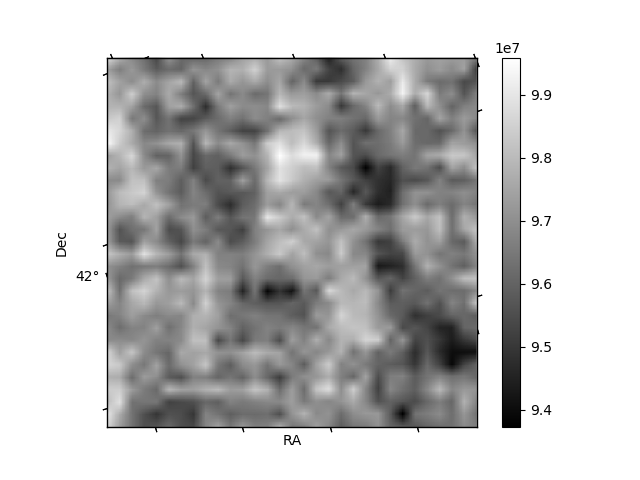
Quadrant B |
|---|---|---|---|
| Quadrant D | 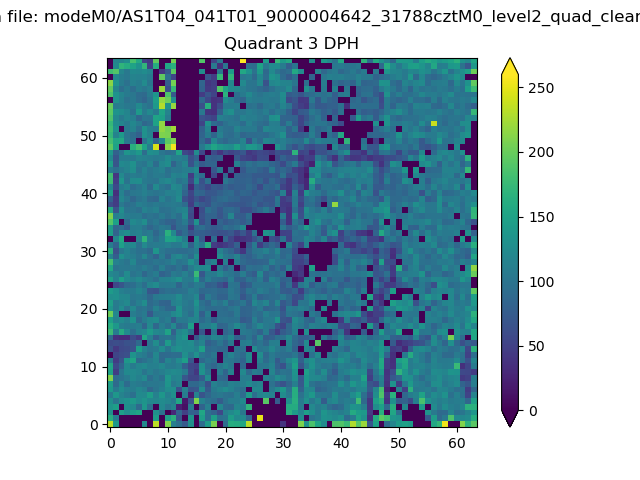 |
 |
Quadrant C |
| Plot type | Count rate plots | Images |
|---|---|---|
| Comparison with Poisson distribution Blue bars denote a histogram of data divided into 1 sec bins. Red curve is a Poisson curve with rate = median count rate of data. |
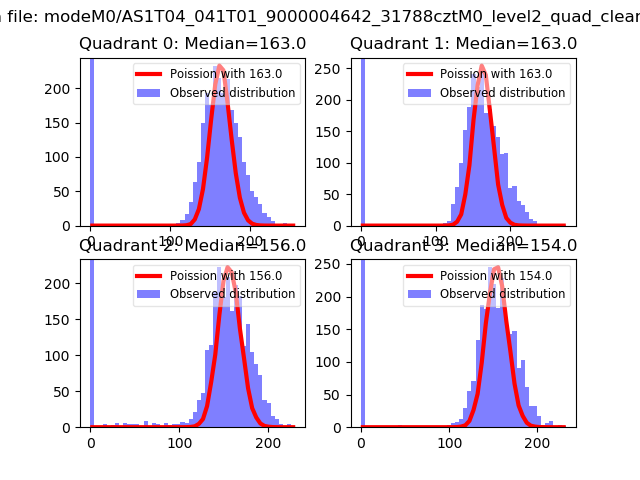 |
 |
| Quadrant-wise count rates Data is divided into 100 sec bins |
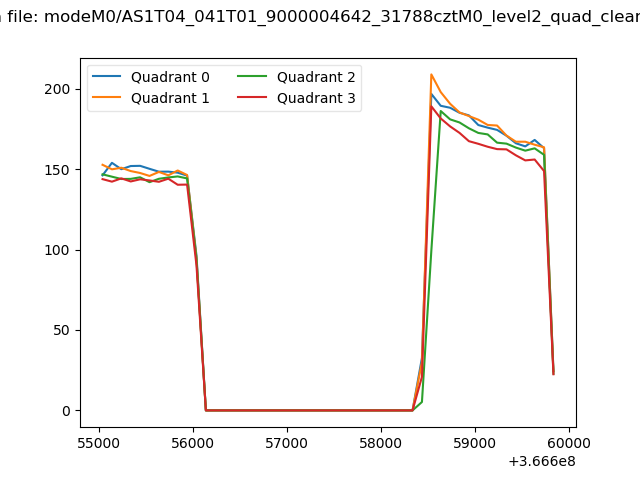 |
|
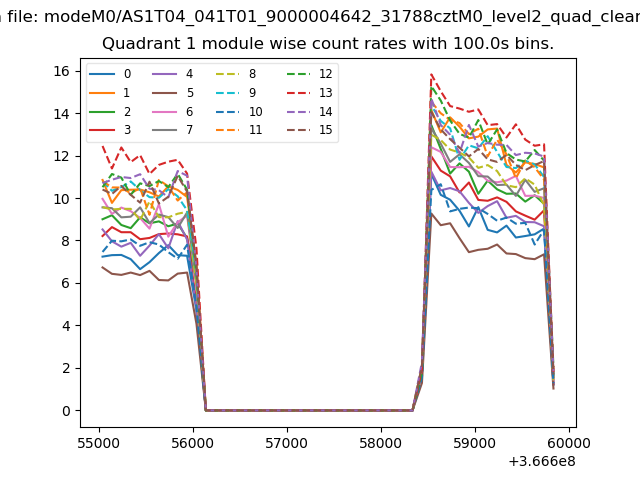
| Module-wise count rates for Quadrant A Data is divided into 100 sec bins |
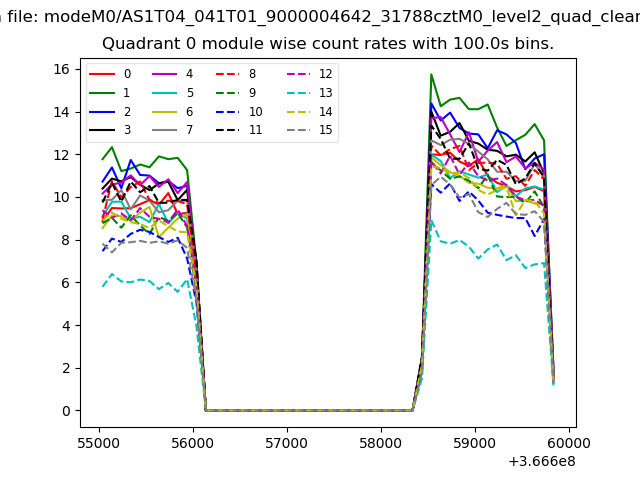 |
 |
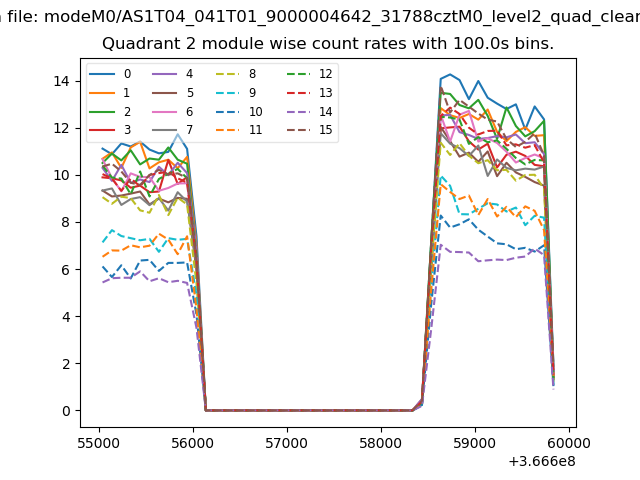
| Module-wise count rates for Quadrant B Data is divided into 100 sec bins |
 |
 |
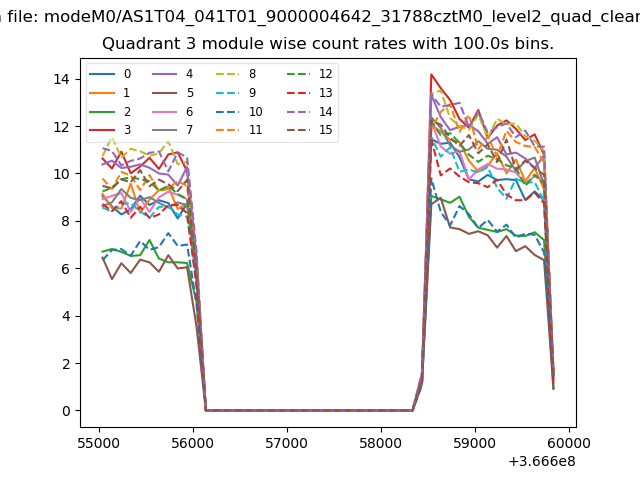
| Module-wise count rates for Quadrant C Data is divided into 100 sec bins |
 |
 |
| Module-wise count rates for Quadrant D Data is divided into 100 sec bins |
 |
 |
| Parameter | Plot |
|---|---|
| CZT HV Monitor | 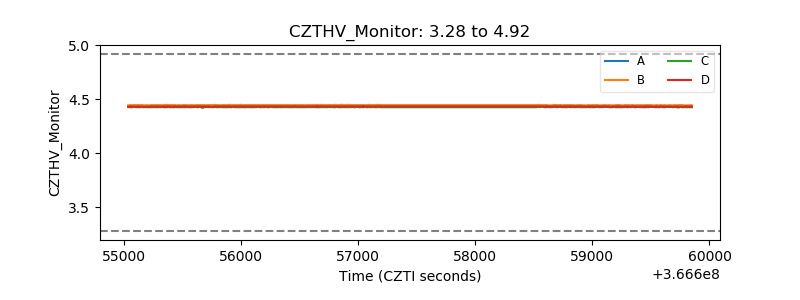 |
| D_VDD | 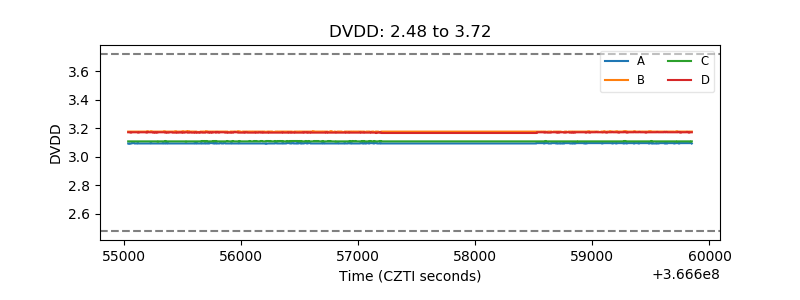 |
| Temperature 1 | 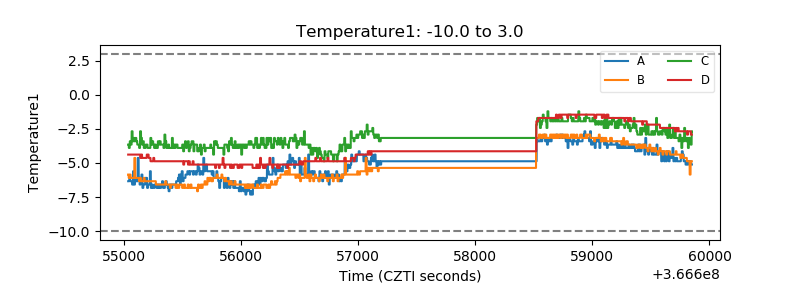 |
| Veto HV Monitor | 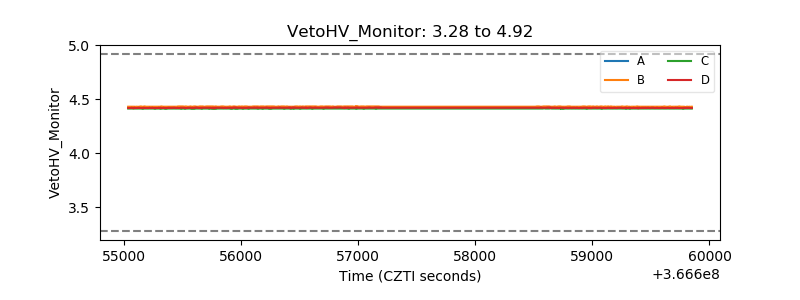 |
| Veto LLD | 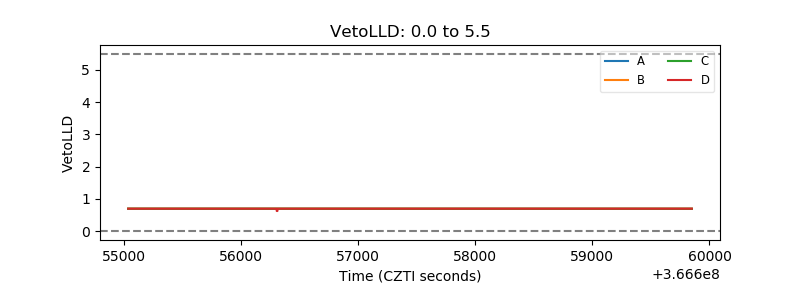 |
| Alpha Counter | 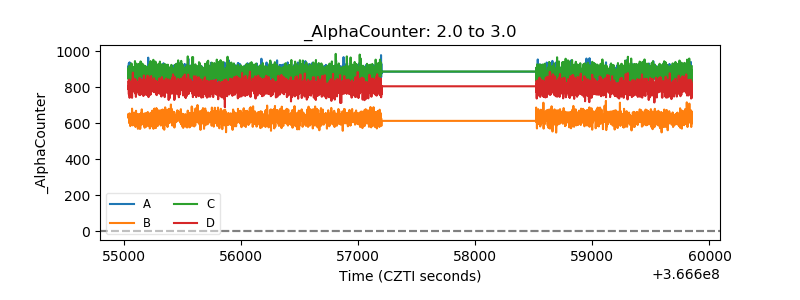 |
| _CPM_Rate | 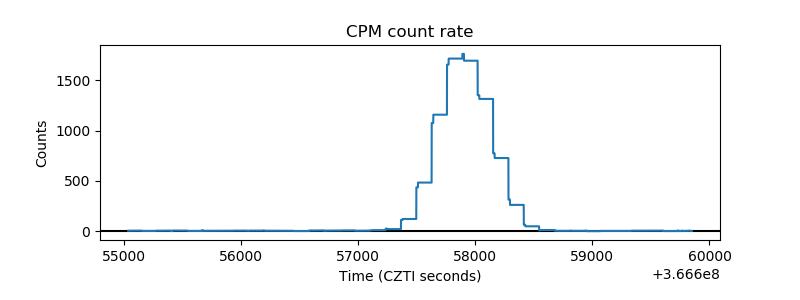 |
| CZT Counter | 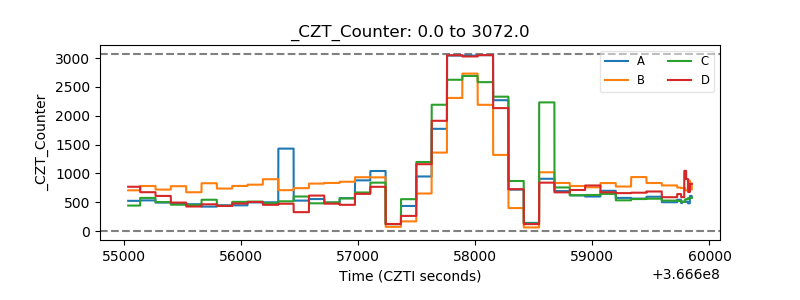 |
| +2.5 Volts monitor | 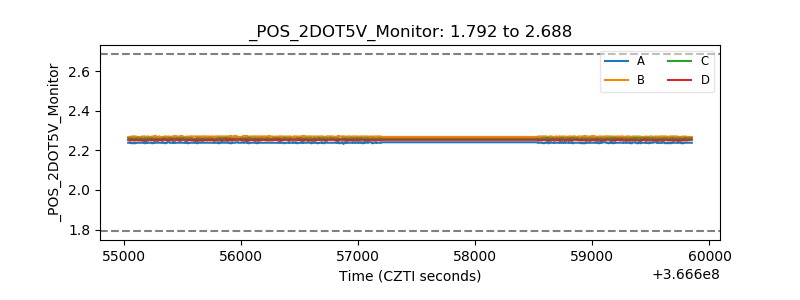 |
| +5 Volts monitor | 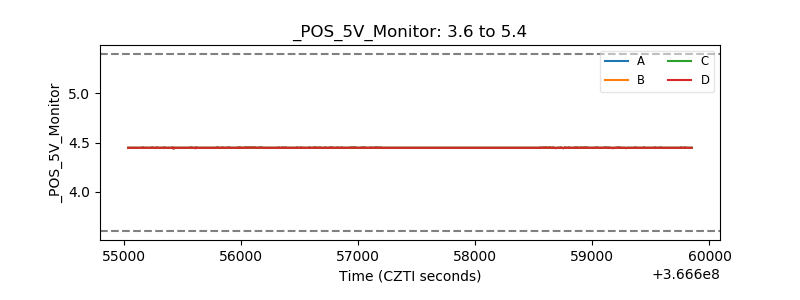 |
| _ROLL_ROT | 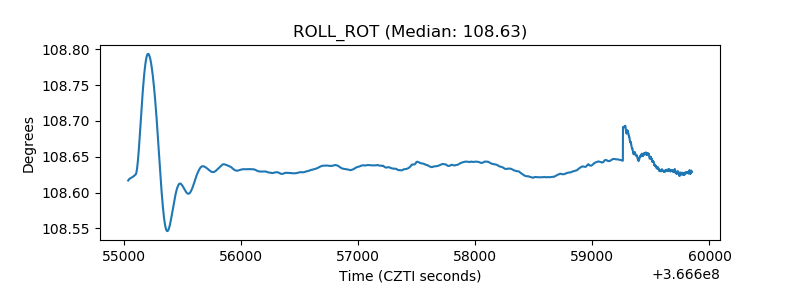 |
| _Roll_DEC | 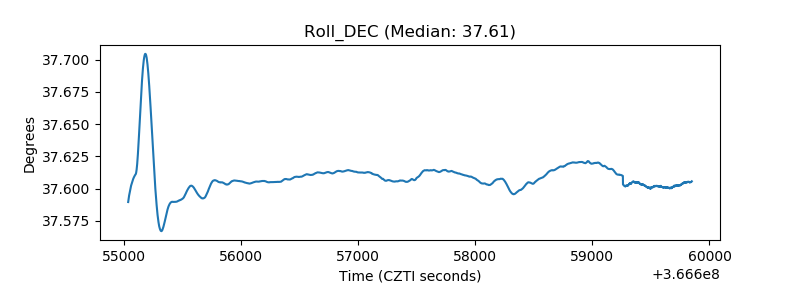 |
| _Roll_RA |  |
| Veto Counter | 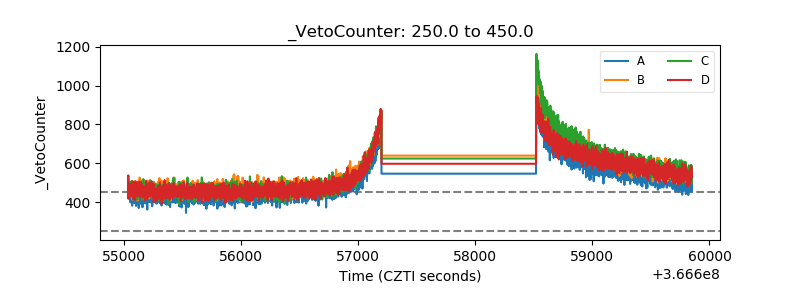 |