| Param | Original file | Final file |
|---|---|---|
| Filename | modeM0/AS1T04_041T01_9000004642_31790cztM0_level2.evt | modeM0/AS1T04_041T01_9000004642_31790cztM0_level2_quad_clean.evt |
| Size (bytes) | 578,266,560 | 99,244,800 |
| Size | 551.5 MB | 94.6 MB |
| Events in quadrant A | 4,236,783 | 640,242 |
| Events in quadrant B | 5,238,218 | 657,080 |
| Events in quadrant C | 3,865,490 | 622,956 |
| Events in quadrant D | 3,723,479 | 622,691 |
| Mode M9 | |||
|---|---|---|---|
| Quadrant | BADHDUFLAG | Total packets | Discarded packets |
| A | 0 | 15 | 0 |
| B | 0 | 16 | 0 |
| C | 0 | 16 | 0 |
| D | 0 | 16 | 0 |
| Mode M0 | |||
|---|---|---|---|
| Quadrant | BADHDUFLAG | Total packets | Discarded packets |
| A | 0 | 16759 | 2 |
| B | 0 | 20511 | 2 |
| C | 0 | 15711 | 2 |
| D | 0 | 15411 | 3 |
| Mode SS | |||
|---|---|---|---|
| Quadrant | BADHDUFLAG | Total packets | Discarded packets |
| A | 0 | 134 | 0 |
| B | 0 | 134 | 0 |
| C | 0 | 134 | 0 |
| D | 0 | 134 | 0 |
| Quadrant | Total seconds | Saturated seconds | Saturation percentage |
|---|---|---|---|
| A | 6634 | 252 | 3.798613% |
| B | 6634 | 116 | 1.748568% |
| C | 6634 | 248 | 3.738318% |
| D | 6633 | 59 | 0.889492% |
Noise dominated data is calculated using 1-second bins in cleaned event files. If a bin has >2000 counts, and if more than 50% of those come from <1% of pixels, then it is considered to be noise-dominated and hence unusable.
| Quadrant | # 1 sec bins | Bins with >0 counts | Bins with >2000 counts | High rate bins dominated by noise | Noise dominated (total time) | Noise dominated (detector-on time) | Marked lightcurve |
|---|---|---|---|---|---|---|---|
| A | 7519 | 6635 | 128 | 128 | 1.70% | 1.93% | 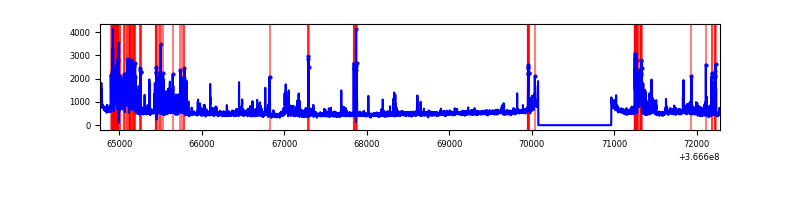 |
| B | 7519 | 6635 | 8 | 8 | 0.11% | 0.12% | 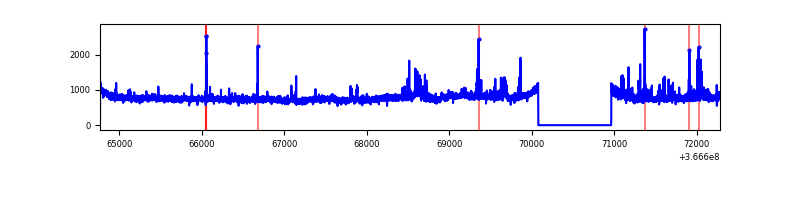 |
| C | 7519 | 6635 | 69 | 69 | 0.92% | 1.04% | 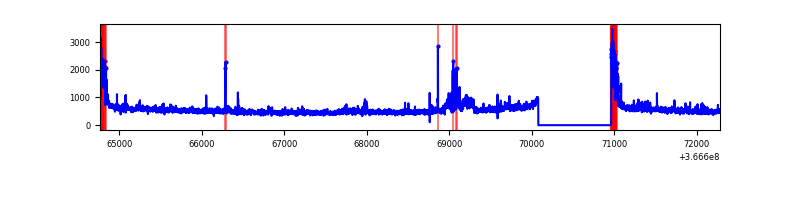 |
| D | 7518 | 6634 | 16 | 16 | 0.21% | 0.24% | 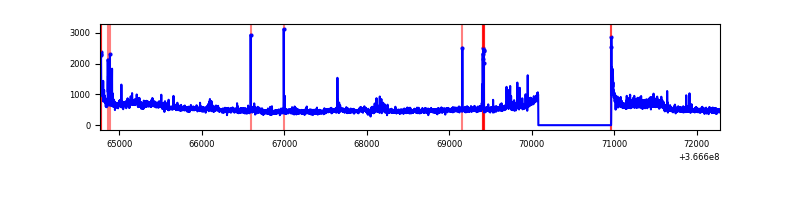 |
Top three noisy pixels from each quadrant. If the there are fewer than three noisy pixels in the level2.evt file, extra rows are filled as -1
| Pixel properties | Quadrant properties | ||||||
|---|---|---|---|---|---|---|---|
| Quadrant | DetID | PixID | Counts | Sigma | Mean | Median | Sigma |
| A | 0 | 13 | 994297 | 5992.81 | 837 | 821 | 165.8 |
| A | 13 | 254 | 12575 | 70.9 | 837 | 821 | 165.8 |
| A | 13 | 6 | 10223 | 56.71 | 837 | 821 | 165.8 |
| B | 6 | 159 | 1732889 | 10855.22 | 836 | 815 | 159.6 |
| B | 10 | 245 | 119312 | 742.64 | 836 | 815 | 159.6 |
| B | 5 | 255 | 45361 | 279.17 | 836 | 815 | 159.6 |
| C | 0 | 10 | 317441 | 1684.89 | 805 | 812 | 187.9 |
| C | 3 | 233 | 208434 | 1104.83 | 805 | 812 | 187.9 |
| C | 14 | 238 | 133354 | 705.3 | 805 | 812 | 187.9 |
| D | 8 | 195 | 417803 | 2109.87 | 824 | 804 | 197.6 |
| D | 12 | 218 | 73495 | 367.79 | 824 | 804 | 197.6 |
| D | 2 | 250 | 52790 | 263.03 | 824 | 804 | 197.6 |
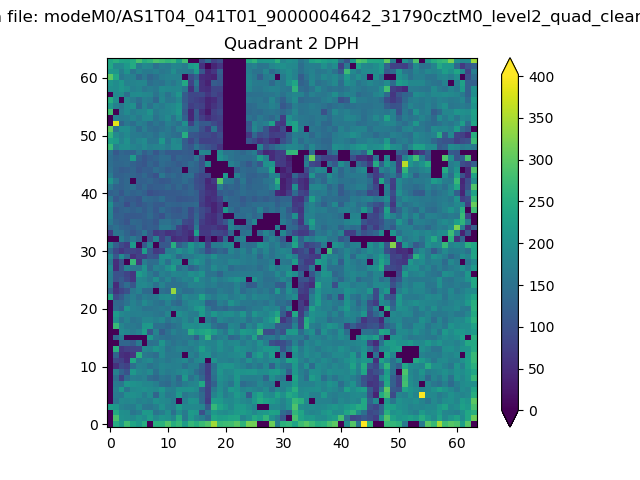
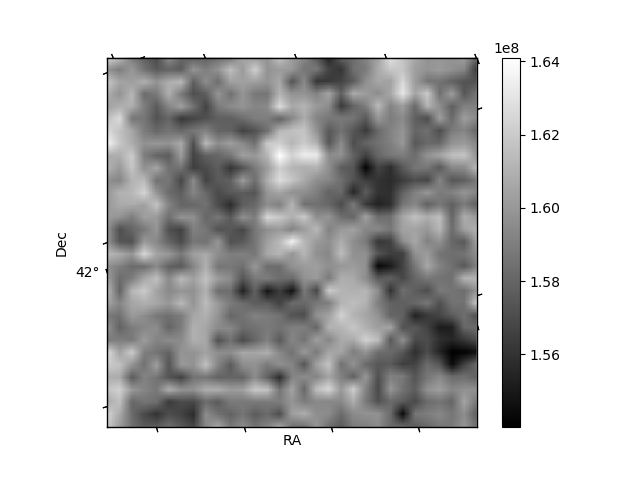
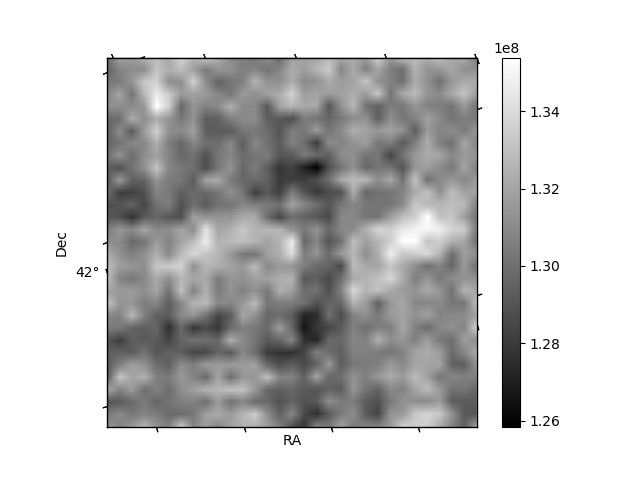
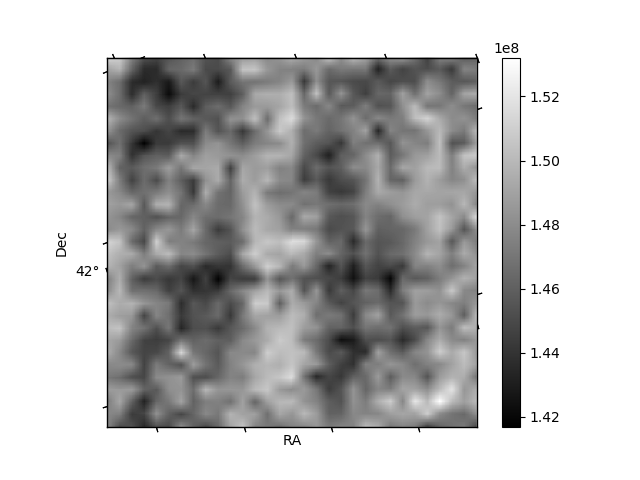
Histogram calculated using DETX and DETY for each event in the final _common_clean file
| Quadrant A | 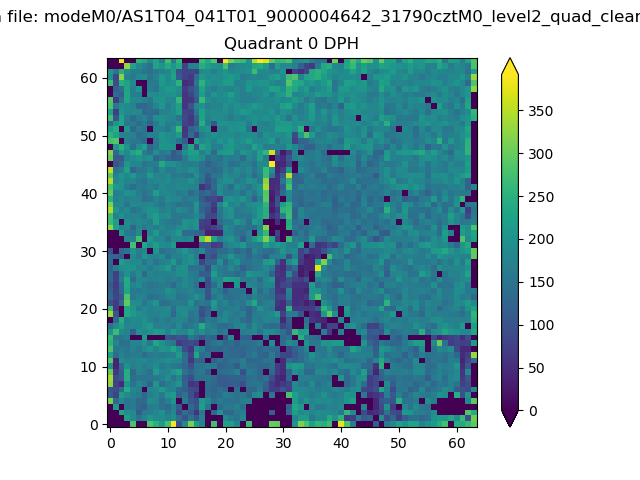 |
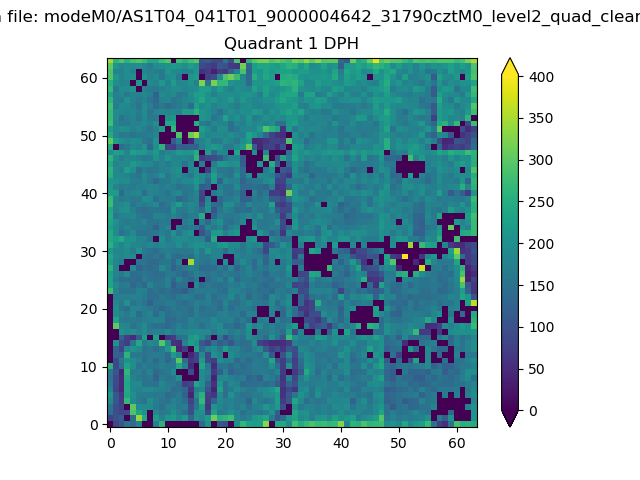 |
Quadrant B |
|---|---|---|---|
| Quadrant D | 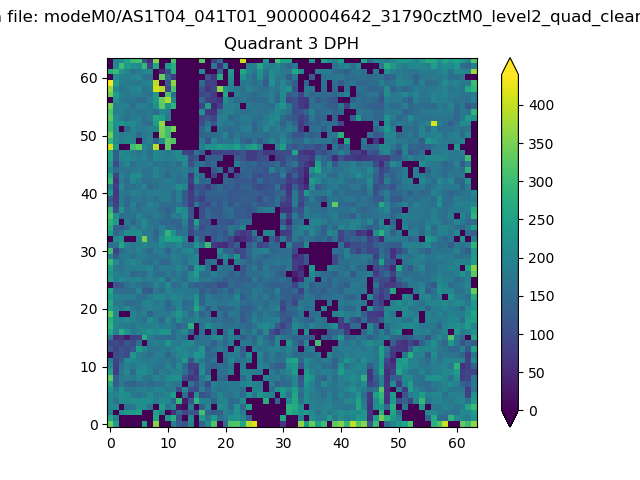 |
 |
Quadrant C |
| Plot type | Count rate plots | Images |
|---|---|---|
| Comparison with Poisson distribution Blue bars denote a histogram of data divided into 1 sec bins. Red curve is a Poisson curve with rate = median count rate of data. |
 |
 |
| Quadrant-wise count rates Data is divided into 100 sec bins |
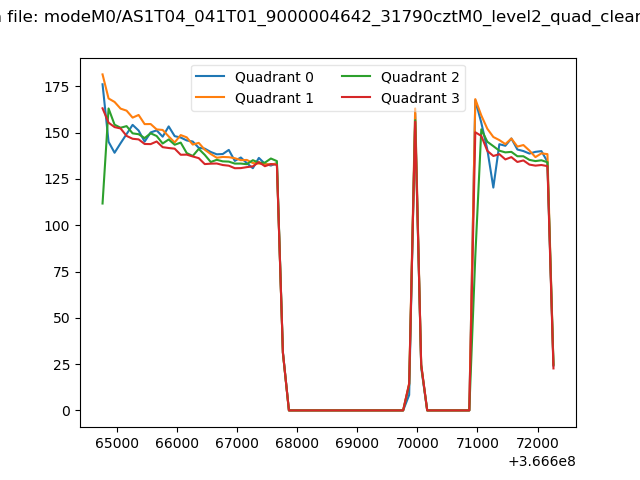 |
|
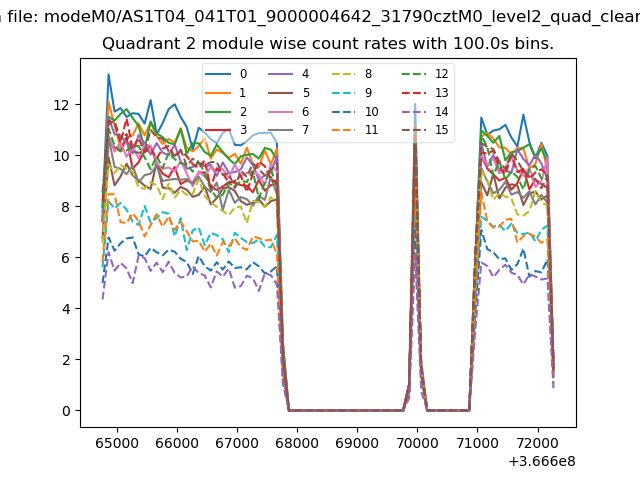
| Module-wise count rates for Quadrant A Data is divided into 100 sec bins |
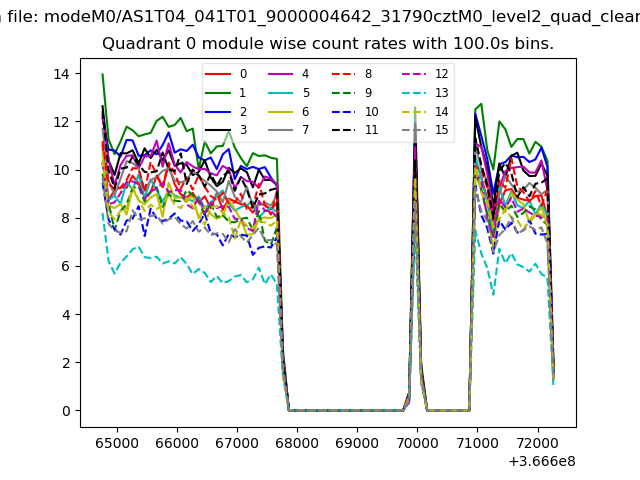 |
 |
| Module-wise count rates for Quadrant B Data is divided into 100 sec bins |
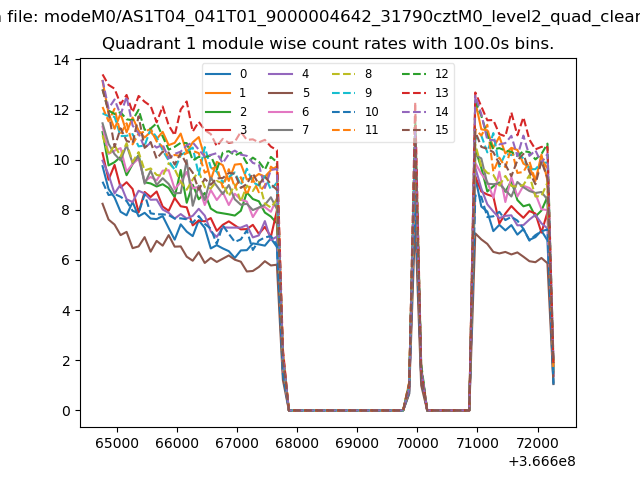 |
 |
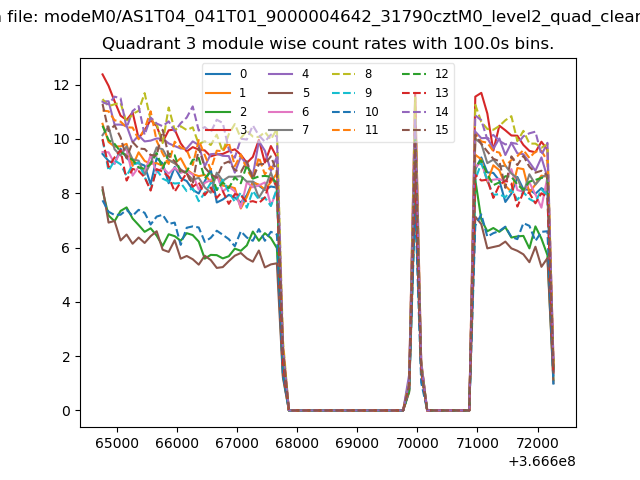
| Module-wise count rates for Quadrant C Data is divided into 100 sec bins |
 |
 |
| Module-wise count rates for Quadrant D Data is divided into 100 sec bins |
 |
 |
| Parameter | Plot |
|---|---|
| CZT HV Monitor | 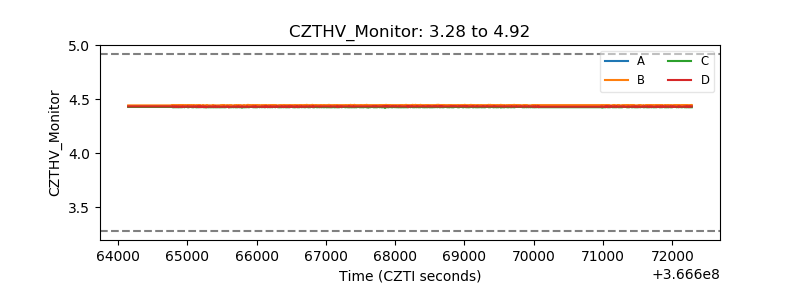 |
| D_VDD | 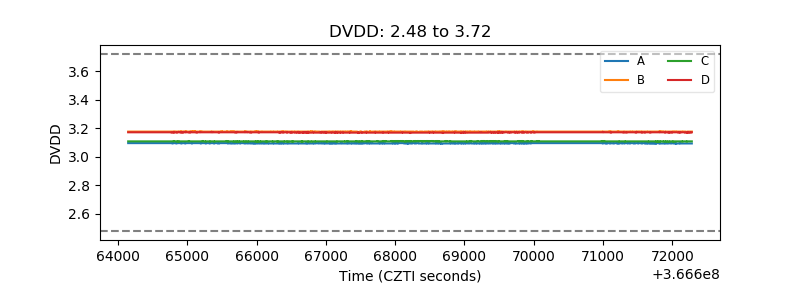 |
| Temperature 1 | 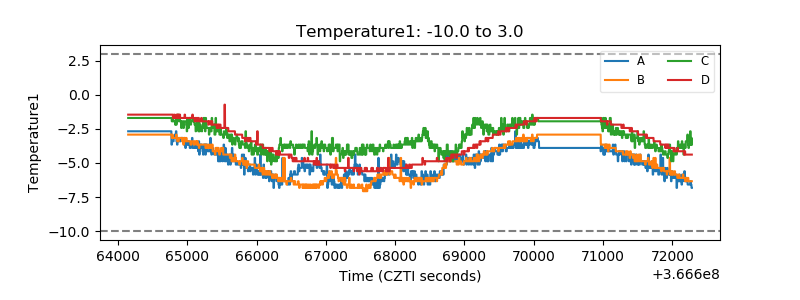 |
| Veto HV Monitor | 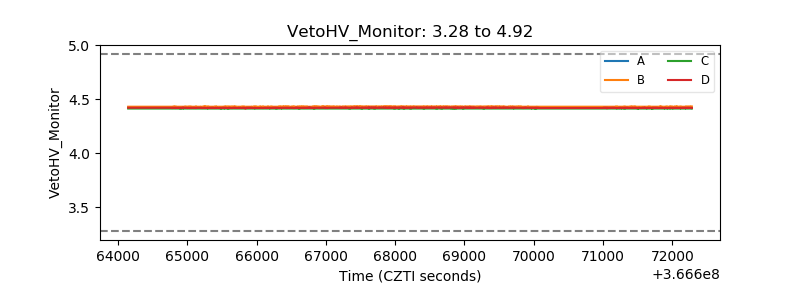 |
| Veto LLD | 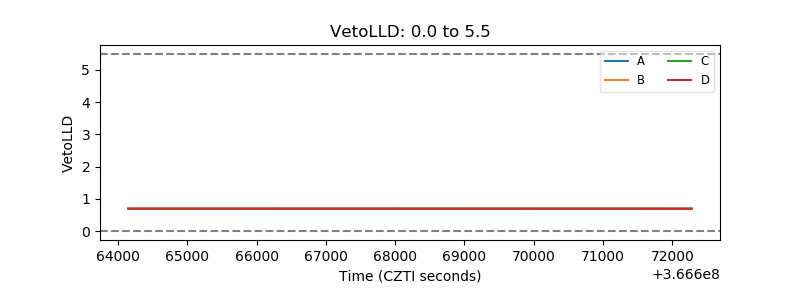 |
| Alpha Counter | 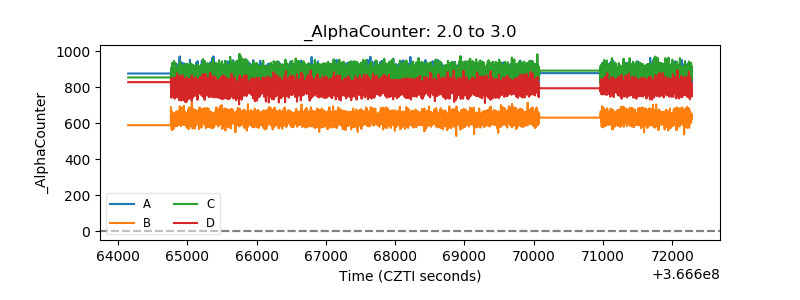 |
| _CPM_Rate | 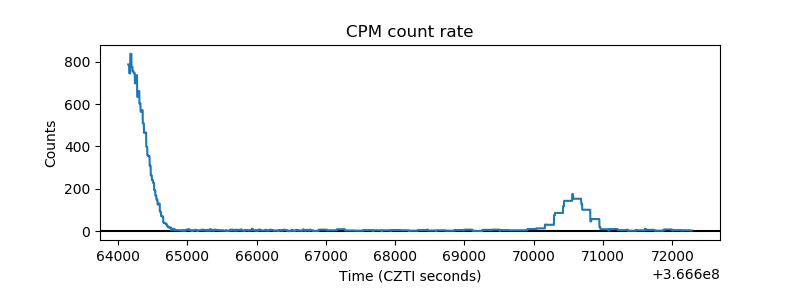 |
| CZT Counter | 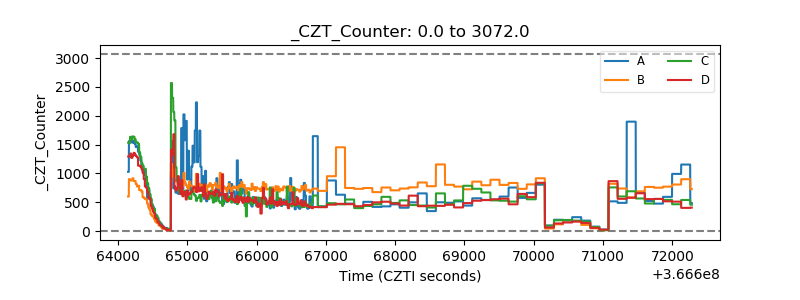 |
| +2.5 Volts monitor |  |
| +5 Volts monitor |  |
| _ROLL_ROT | 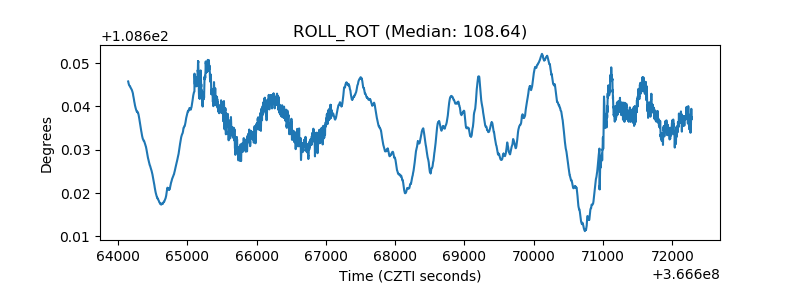 |
| _Roll_DEC | 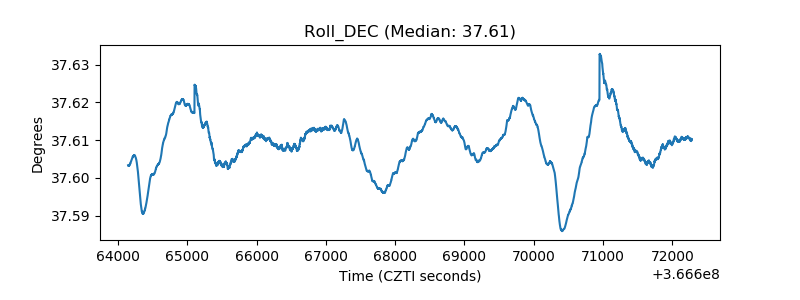 |
| _Roll_RA |  |
| Veto Counter | 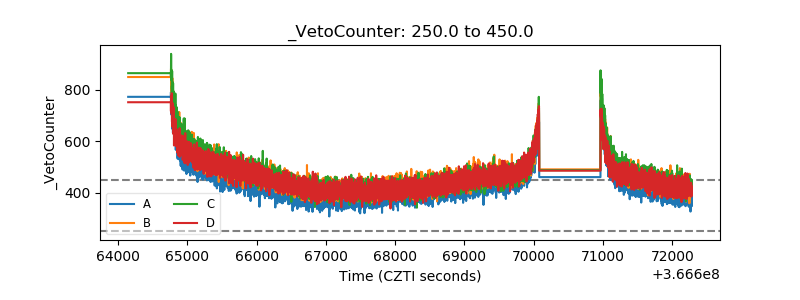 |