| Param | Original file | Final file |
|---|---|---|
| Filename | modeM0/AS1T04_041T01_9000004642_31792cztM0_level2.evt | modeM0/AS1T04_041T01_9000004642_31792cztM0_level2_quad_clean.evt |
| Size (bytes) | 737,611,200 | 103,953,600 |
| Size | 703.4 MB | 99.1 MB |
| Events in quadrant A | 8,113,934 | 612,689 |
| Events in quadrant B | 5,512,167 | 697,419 |
| Events in quadrant C | 3,988,247 | 671,786 |
| Events in quadrant D | 4,234,569 | 660,912 |
| Mode M9 | |||
|---|---|---|---|
| Quadrant | BADHDUFLAG | Total packets | Discarded packets |
| A | 0 | 2 | 0 |
| B | 0 | 2 | 0 |
| C | 0 | 2 | 0 |
| D | 0 | 2 | 0 |
| Mode M0 | |||
|---|---|---|---|
| Quadrant | BADHDUFLAG | Total packets | Discarded packets |
| A | 0 | 29136 | 1 |
| B | 0 | 22016 | 1 |
| C | 0 | 16506 | 1 |
| D | 0 | 17405 | 1 |
| Mode SS | |||
|---|---|---|---|
| Quadrant | BADHDUFLAG | Total packets | Discarded packets |
| A | 0 | 146 | 0 |
| B | 0 | 146 | 0 |
| C | 0 | 146 | 0 |
| D | 0 | 146 | 0 |
| Quadrant | Total seconds | Saturated seconds | Saturation percentage |
|---|---|---|---|
| A | 7252 | 1589 | 21.911197% |
| B | 7252 | 105 | 1.447876% |
| C | 7252 | 217 | 2.992278% |
| D | 7253 | 59 | 0.813457% |
Noise dominated data is calculated using 1-second bins in cleaned event files. If a bin has >2000 counts, and if more than 50% of those come from <1% of pixels, then it is considered to be noise-dominated and hence unusable.
| Quadrant | # 1 sec bins | Bins with >0 counts | Bins with >2000 counts | High rate bins dominated by noise | Noise dominated (total time) | Noise dominated (detector-on time) | Marked lightcurve |
|---|---|---|---|---|---|---|---|
| A | 7442 | 7253 | 1019 | 1019 | 13.69% | 14.05% |  |
| B | 7442 | 7253 | 8 | 8 | 0.11% | 0.11% | 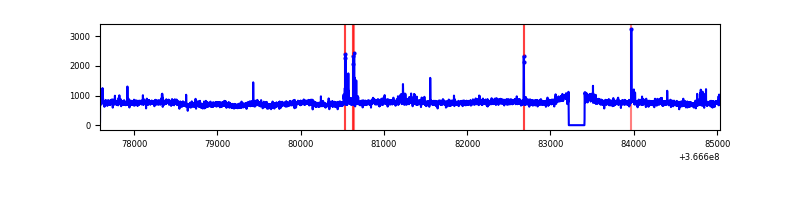 |
| C | 7442 | 7253 | 18 | 18 | 0.24% | 0.25% | 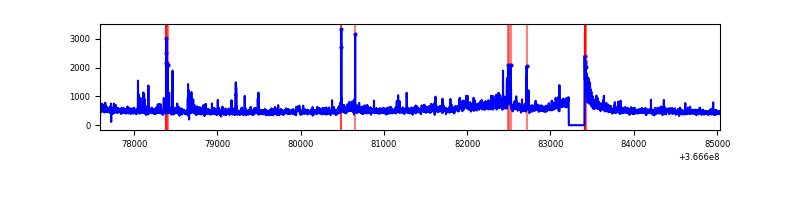 |
| D | 7443 | 7254 | 21 | 21 | 0.28% | 0.29% | 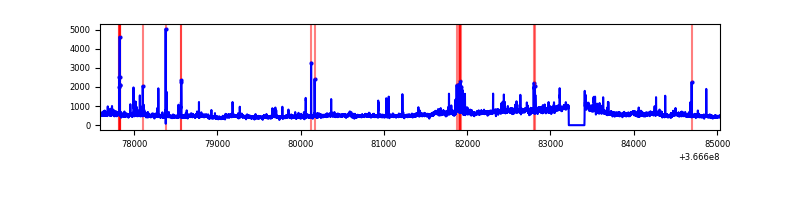 |
Top three noisy pixels from each quadrant. If the there are fewer than three noisy pixels in the level2.evt file, extra rows are filled as -1
| Pixel properties | Quadrant properties | ||||||
|---|---|---|---|---|---|---|---|
| Quadrant | DetID | PixID | Counts | Sigma | Mean | Median | Sigma |
| A | 0 | 13 | 4972989 | 30437.67 | 812 | 797 | 163.4 |
| A | 13 | 254 | 12604 | 72.28 | 812 | 797 | 163.4 |
| A | 3 | 137 | 8392 | 46.49 | 812 | 797 | 163.4 |
| B | 6 | 159 | 1954652 | 11645.26 | 871 | 849 | 167.8 |
| B | 10 | 245 | 57154 | 335.59 | 871 | 849 | 167.8 |
| B | 5 | 255 | 40865 | 238.51 | 871 | 849 | 167.8 |
| C | 0 | 10 | 306795 | 1513.33 | 850 | 857 | 202.2 |
| C | 3 | 233 | 155509 | 764.99 | 850 | 857 | 202.2 |
| C | 14 | 238 | 152507 | 750.14 | 850 | 857 | 202.2 |
| D | 8 | 195 | 746440 | 3642.1 | 855 | 834 | 204.7 |
| D | 2 | 250 | 119934 | 581.77 | 855 | 834 | 204.7 |
| D | 1 | 52 | 42301 | 202.56 | 855 | 834 | 204.7 |
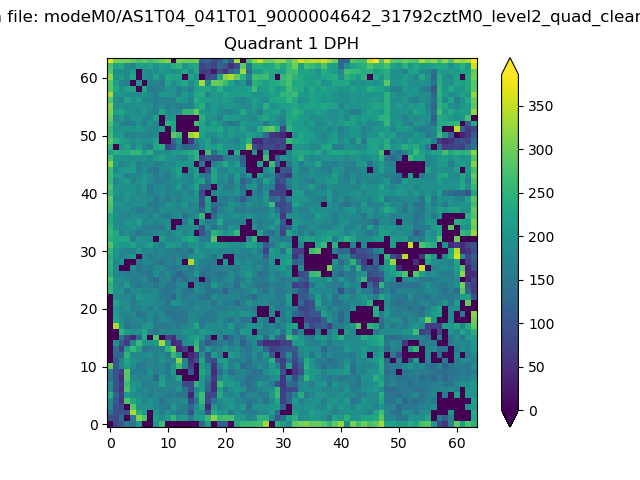
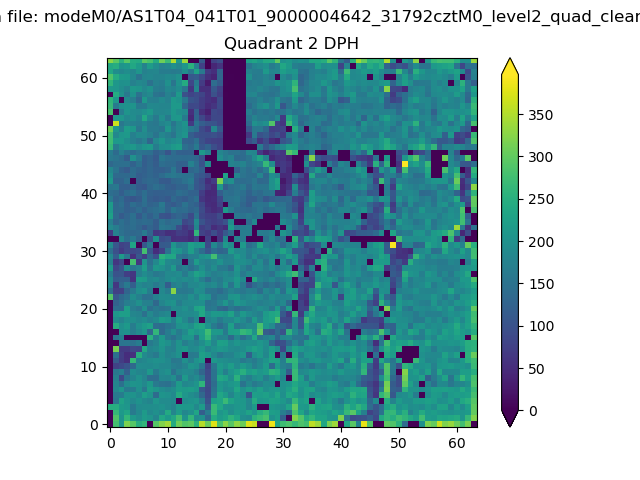
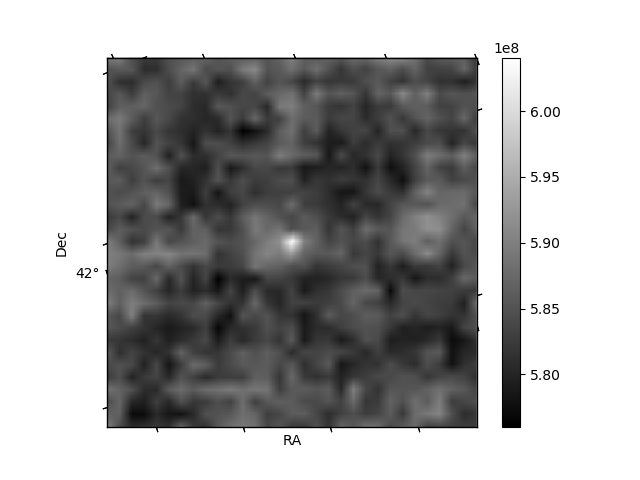
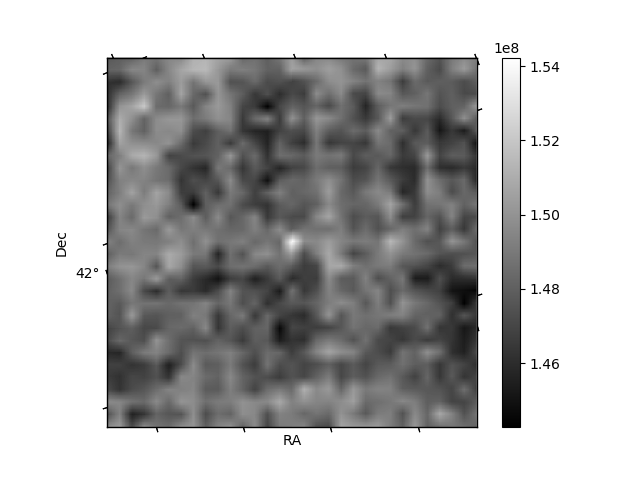
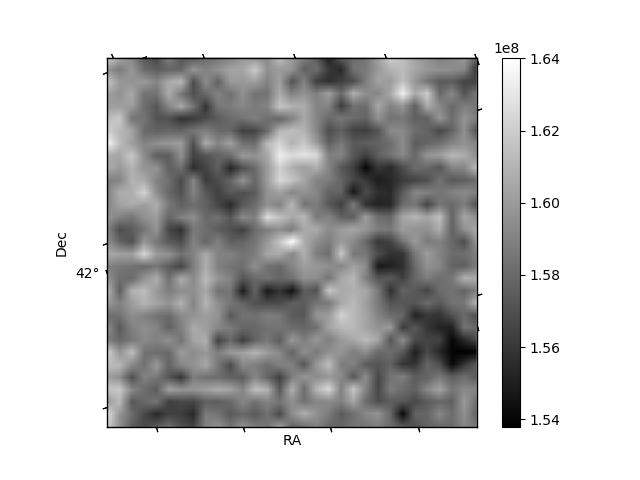
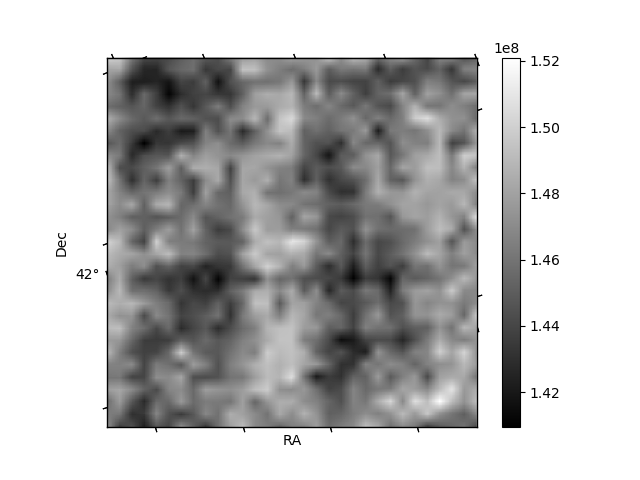
Histogram calculated using DETX and DETY for each event in the final _common_clean file
| Quadrant A | 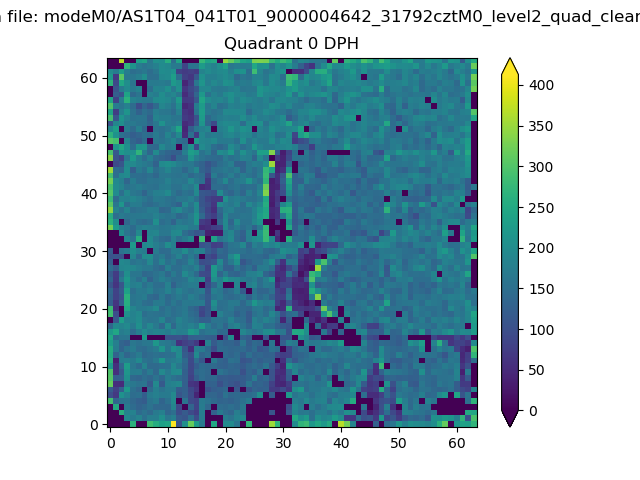 |
 |
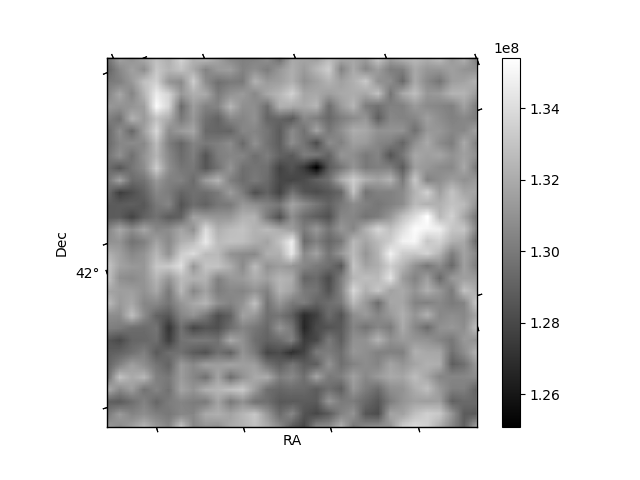
Quadrant B |
|---|---|---|---|
| Quadrant D | 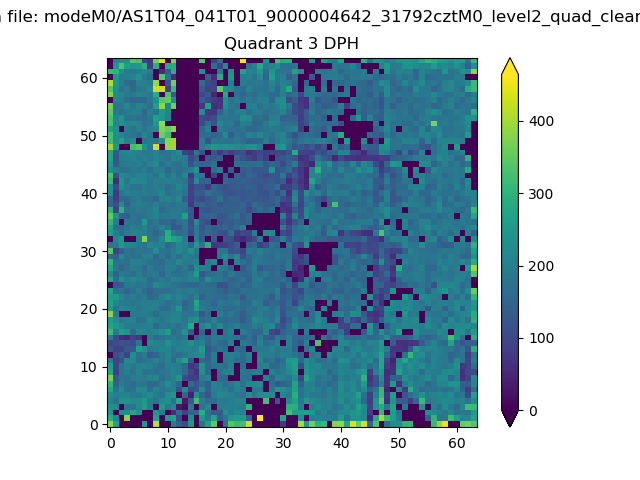 |
 |
Quadrant C |
| Plot type | Count rate plots | Images |
|---|---|---|
| Comparison with Poisson distribution Blue bars denote a histogram of data divided into 1 sec bins. Red curve is a Poisson curve with rate = median count rate of data. |
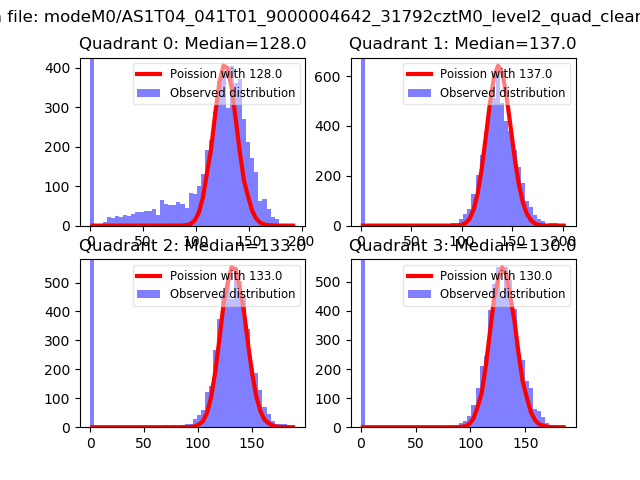 |
 |
| Quadrant-wise count rates Data is divided into 100 sec bins |
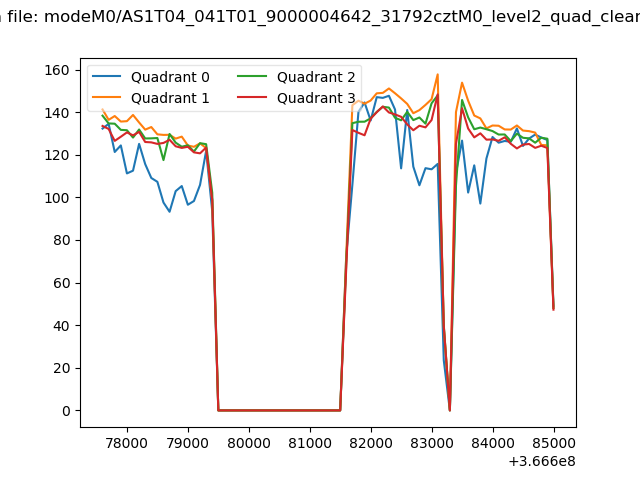 |
|
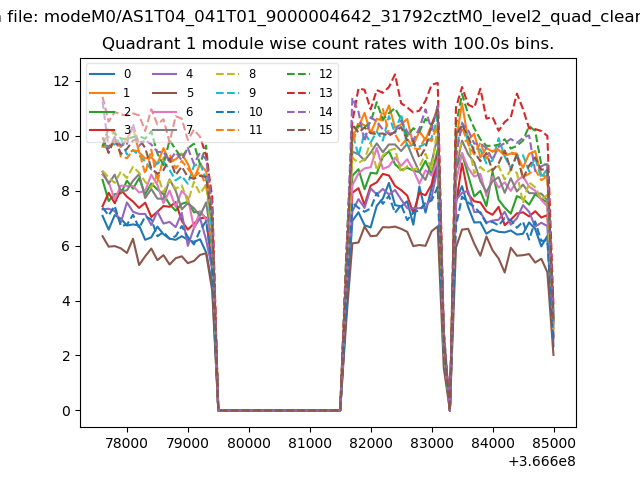
| Module-wise count rates for Quadrant A Data is divided into 100 sec bins |
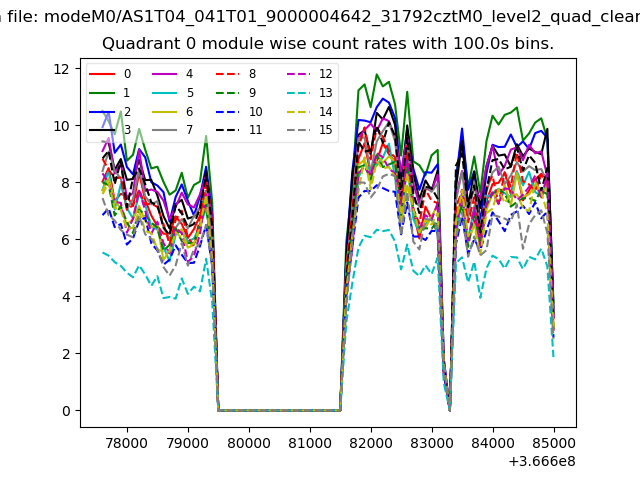 |
 |
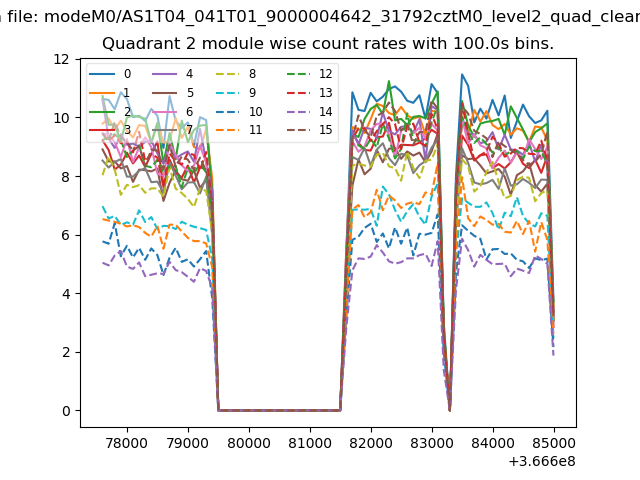
| Module-wise count rates for Quadrant B Data is divided into 100 sec bins |
 |
 |
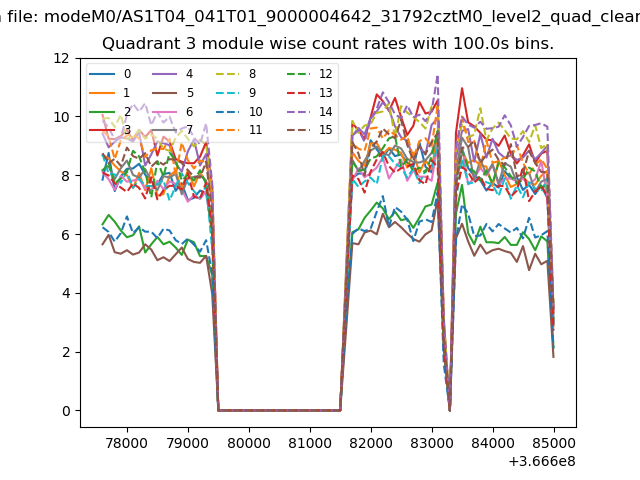
| Module-wise count rates for Quadrant C Data is divided into 100 sec bins |
 |
 |
| Module-wise count rates for Quadrant D Data is divided into 100 sec bins |
 |
 |
| Parameter | Plot |
|---|---|
| CZT HV Monitor | 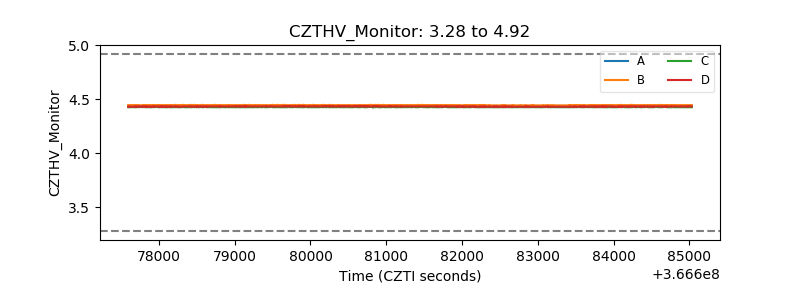 |
| D_VDD | 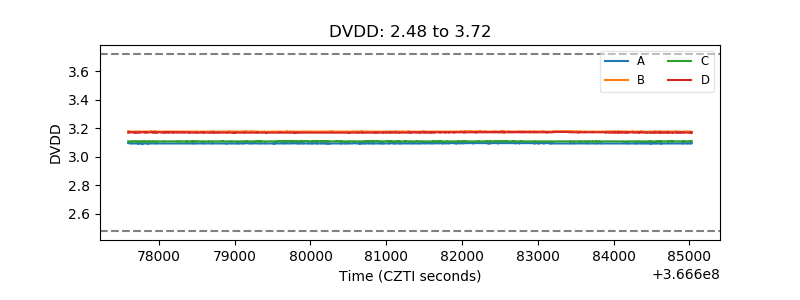 |
| Temperature 1 | 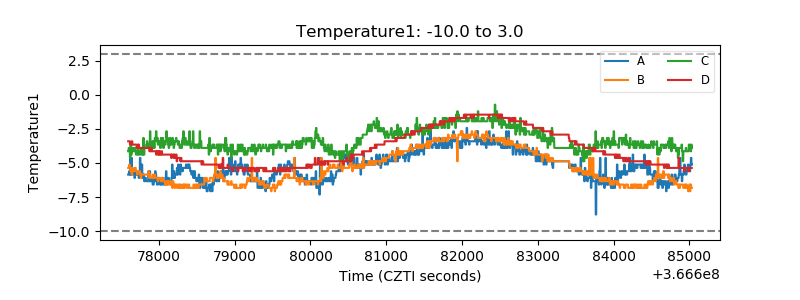 |
| Veto HV Monitor |  |
| Veto LLD | 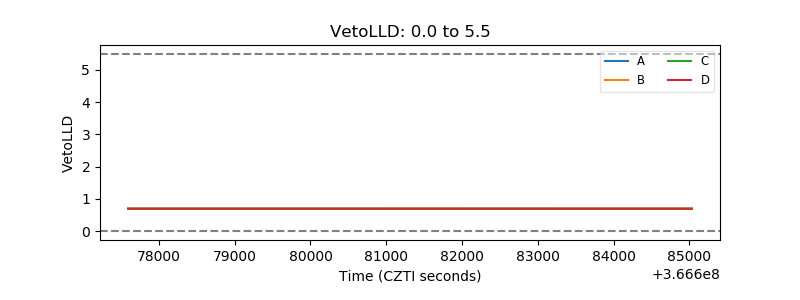 |
| Alpha Counter | 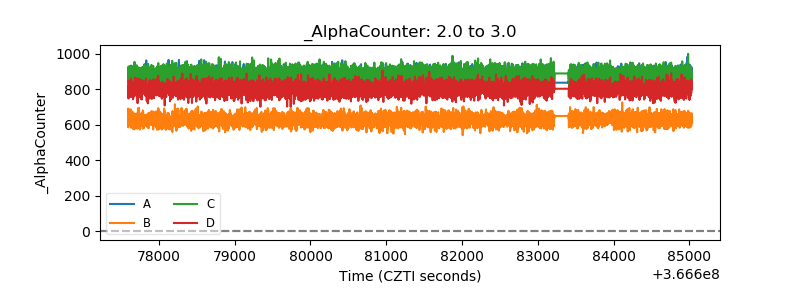 |
| _CPM_Rate | 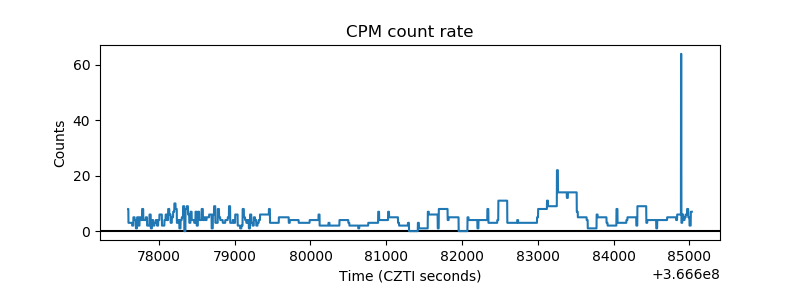 |
| CZT Counter | 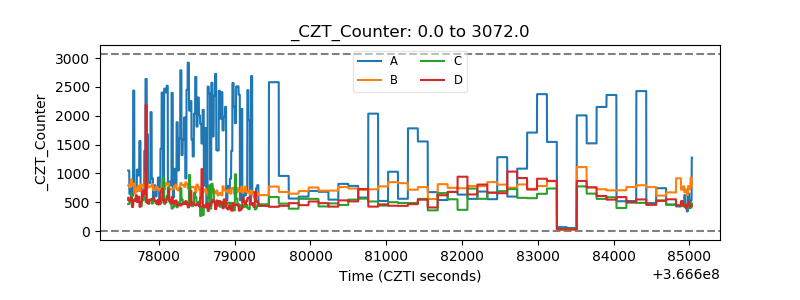 |
| +2.5 Volts monitor |  |
| +5 Volts monitor |  |
| _ROLL_ROT | 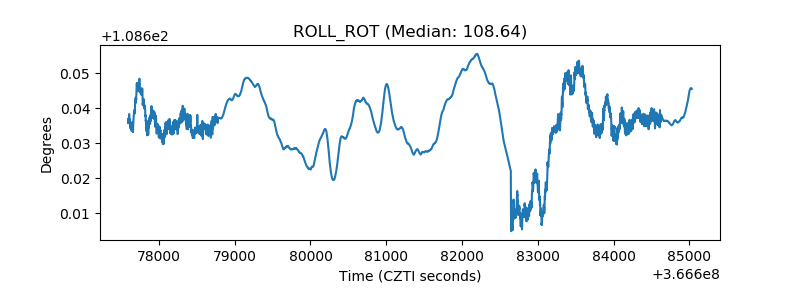 |
| _Roll_DEC | 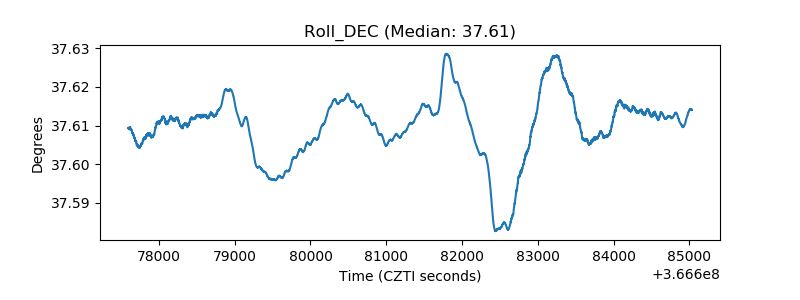 |
| _Roll_RA | 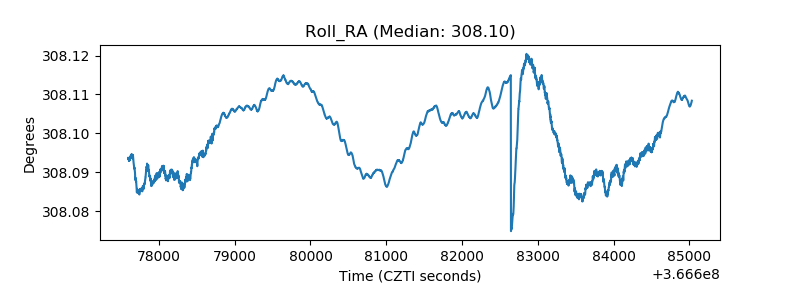 |
| Veto Counter | 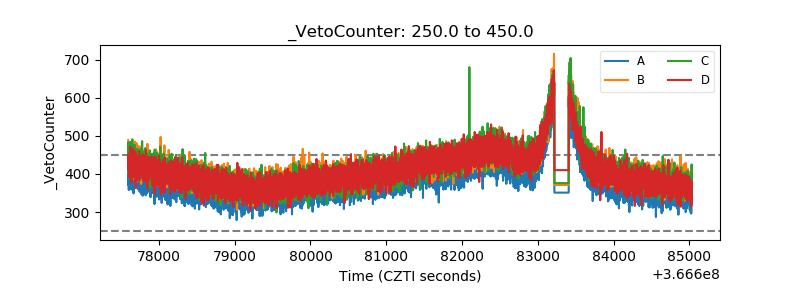 |