| Param | Original file | Final file |
|---|---|---|
| Filename | modeM0/AS1T04_041T01_9000004642_31795cztM0_level2.evt | modeM0/AS1T04_041T01_9000004642_31795cztM0_level2_quad_clean.evt |
| Size (bytes) | 1,452,240,000 | 151,274,880 |
| Size | 1.4 GB | 144.3 MB |
| Events in quadrant A | 18,391,046 | 739,258 |
| Events in quadrant B | 10,051,011 | 1,018,645 |
| Events in quadrant C | 7,208,414 | 967,445 |
| Events in quadrant D | 7,463,585 | 964,903 |
| Mode M9 | |||
|---|---|---|---|
| Quadrant | BADHDUFLAG | Total packets | Discarded packets |
| A | 0 | 12 | 0 |
| B | 0 | 12 | 0 |
| C | 0 | 12 | 0 |
| D | 0 | 12 | 0 |
| Mode M0 | |||
|---|---|---|---|
| Quadrant | BADHDUFLAG | Total packets | Discarded packets |
| A | 0 | 63015 | 3 |
| B | 0 | 39767 | 2 |
| C | 0 | 29602 | 2 |
| D | 0 | 30262 | 2 |
| Mode SS | |||
|---|---|---|---|
| Quadrant | BADHDUFLAG | Total packets | Discarded packets |
| A | 0 | 258 | 0 |
| B | 0 | 258 | 0 |
| C | 0 | 258 | 0 |
| D | 0 | 258 | 0 |
| Quadrant | Total seconds | Saturated seconds | Saturation percentage |
|---|---|---|---|
| A | 12879 | 6372 | 49.475891% |
| B | 12879 | 296 | 2.298315% |
| C | 12880 | 536 | 4.161491% |
| D | 12880 | 153 | 1.187888% |
Noise dominated data is calculated using 1-second bins in cleaned event files. If a bin has >2000 counts, and if more than 50% of those come from <1% of pixels, then it is considered to be noise-dominated and hence unusable.
| Quadrant | # 1 sec bins | Bins with >0 counts | Bins with >2000 counts | High rate bins dominated by noise | Noise dominated (total time) | Noise dominated (detector-on time) | Marked lightcurve |
|---|---|---|---|---|---|---|---|
| A | 13969 | 12880 | 4242 | 4242 | 30.37% | 32.93% | 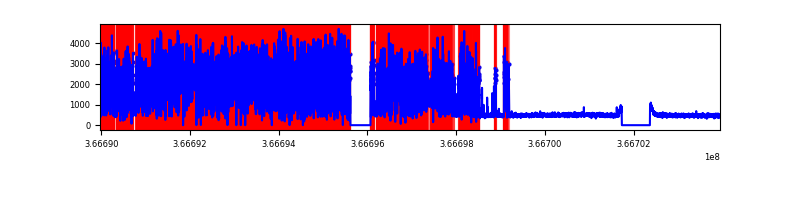 |
| B | 13969 | 12881 | 37 | 37 | 0.26% | 0.29% | 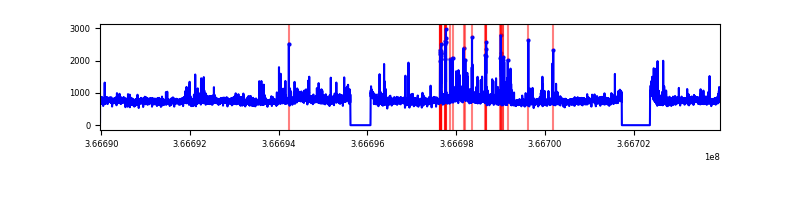 |
| C | 13970 | 12882 | 50 | 50 | 0.36% | 0.39% | 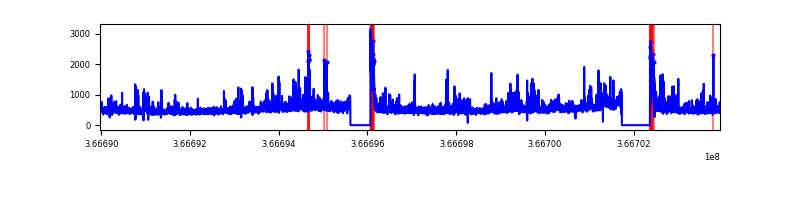 |
| D | 13970 | 12882 | 52 | 52 | 0.37% | 0.40% | 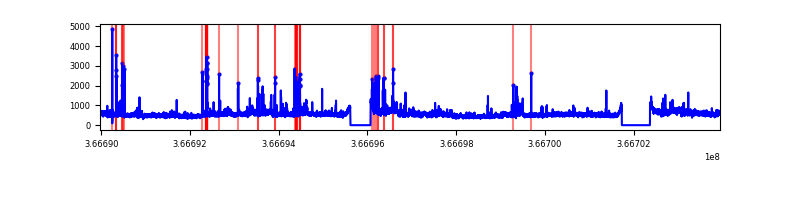 |
Top three noisy pixels from each quadrant. If the there are fewer than three noisy pixels in the level2.evt file, extra rows are filled as -1
| Pixel properties | Quadrant properties | ||||||
|---|---|---|---|---|---|---|---|
| Quadrant | DetID | PixID | Counts | Sigma | Mean | Median | Sigma |
| A | 0 | 13 | 13975269 | 60568.73 | 1143 | 1119 | 230.7 |
| A | 13 | 254 | 16772 | 67.85 | 1143 | 1119 | 230.7 |
| A | 3 | 137 | 11815 | 46.36 | 1143 | 1119 | 230.7 |
| B | 6 | 159 | 3351956 | 11255.0 | 1545 | 1506 | 297.7 |
| B | 10 | 245 | 547365 | 1833.68 | 1545 | 1506 | 297.7 |
| B | 12 | 111 | 38586 | 124.56 | 1545 | 1506 | 297.7 |
| C | 0 | 10 | 714800 | 2031.09 | 1486 | 1497 | 351.2 |
| C | 14 | 238 | 313955 | 889.71 | 1486 | 1497 | 351.2 |
| C | 3 | 233 | 218618 | 618.24 | 1486 | 1497 | 351.2 |
| D | 8 | 195 | 1250647 | 3413.55 | 1518 | 1477 | 365.9 |
| D | 2 | 250 | 131062 | 354.11 | 1518 | 1477 | 365.9 |
| D | 12 | 227 | 123183 | 332.58 | 1518 | 1477 | 365.9 |
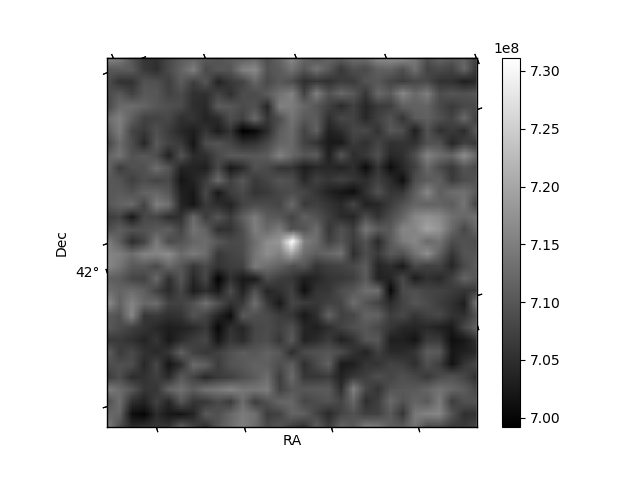
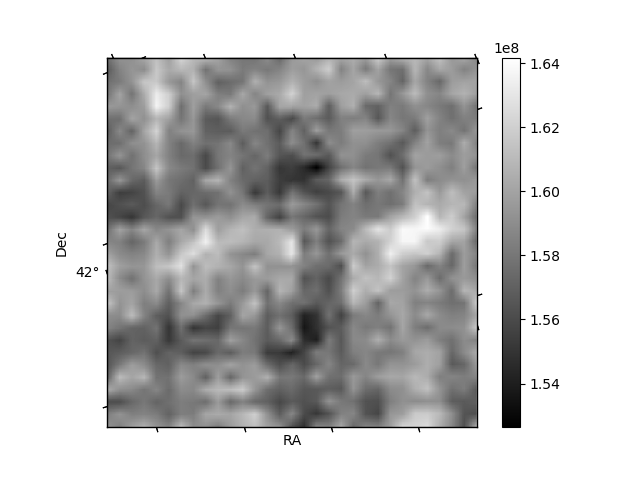
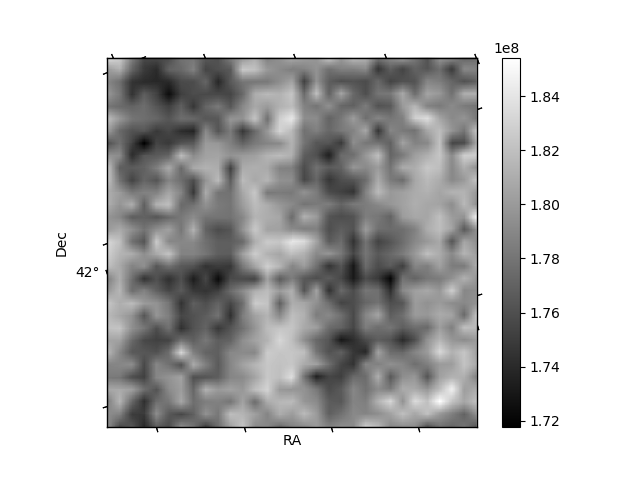
Histogram calculated using DETX and DETY for each event in the final _common_clean file
| Quadrant A |  |
 |
Quadrant B |
|---|---|---|---|
| Quadrant D |  |
 |
Quadrant C |
| Plot type | Count rate plots | Images |
|---|---|---|
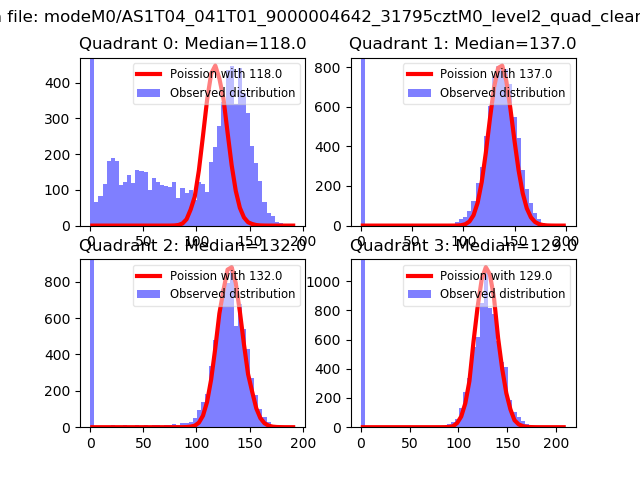
| Comparison with Poisson distribution Blue bars denote a histogram of data divided into 1 sec bins. Red curve is a Poisson curve with rate = median count rate of data. |
 |
 |
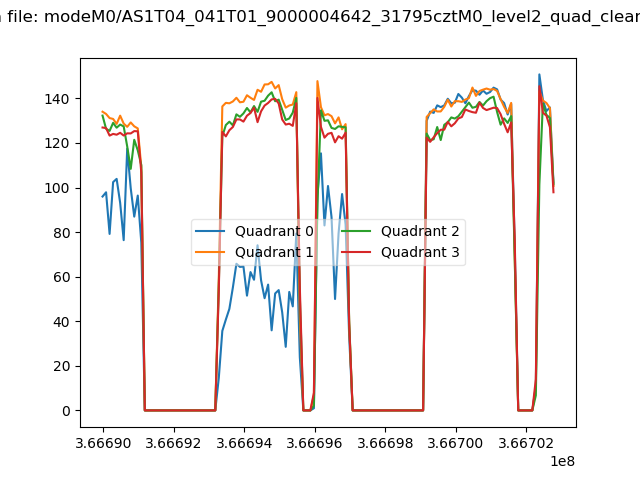
| Quadrant-wise count rates Data is divided into 100 sec bins |
 |
|
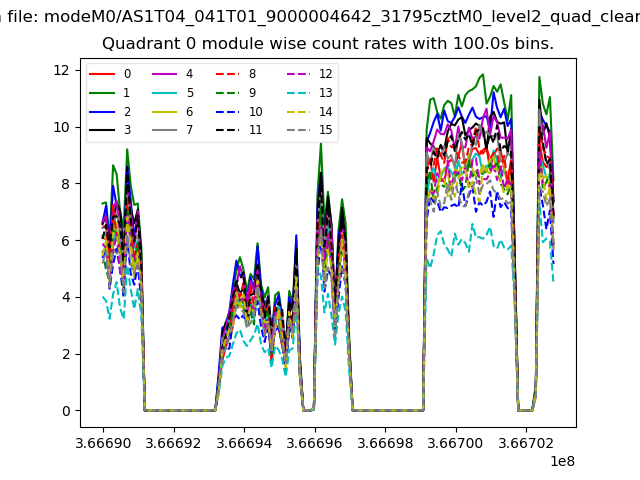
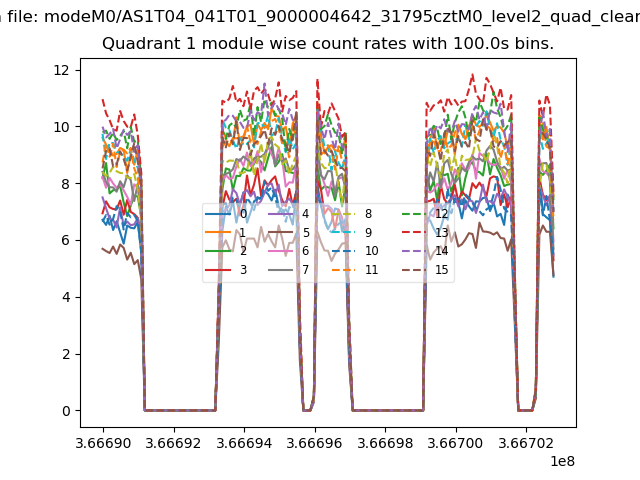
| Module-wise count rates for Quadrant A Data is divided into 100 sec bins |
 |
 |
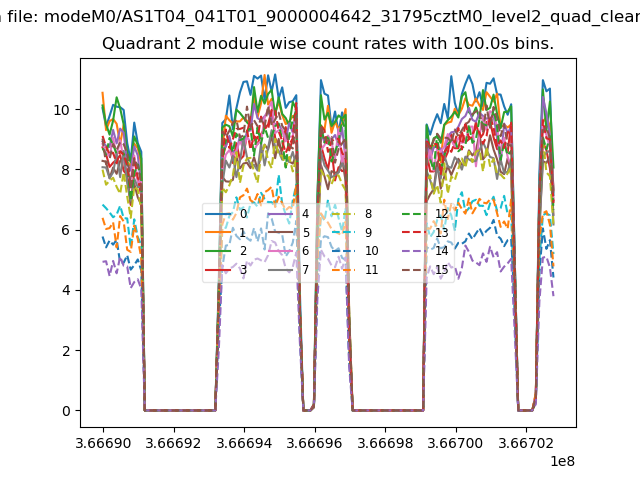
| Module-wise count rates for Quadrant B Data is divided into 100 sec bins |
 |
 |
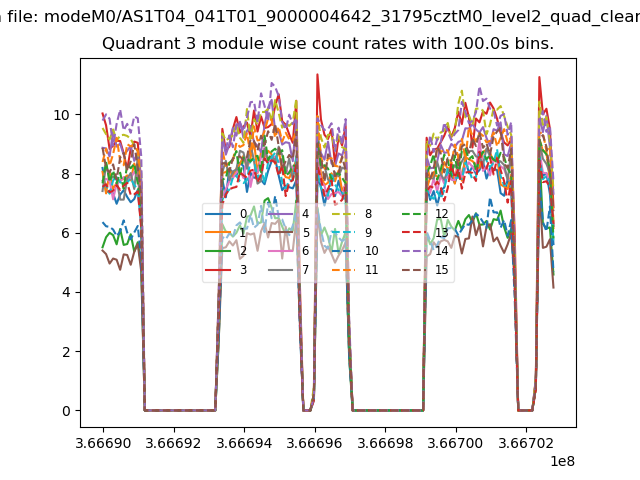
| Module-wise count rates for Quadrant C Data is divided into 100 sec bins |
 |
 |
| Module-wise count rates for Quadrant D Data is divided into 100 sec bins |
 |
 |
| Parameter | Plot |
|---|---|
| CZT HV Monitor | 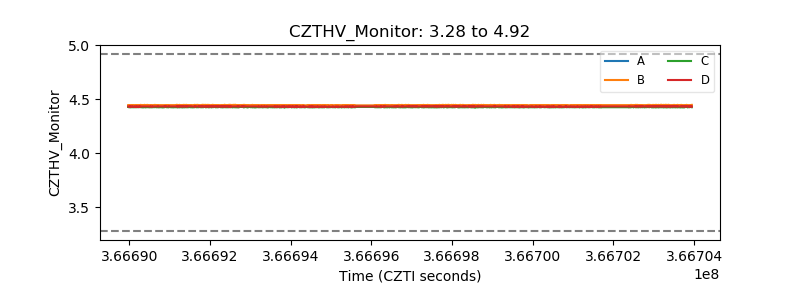 |
| D_VDD | 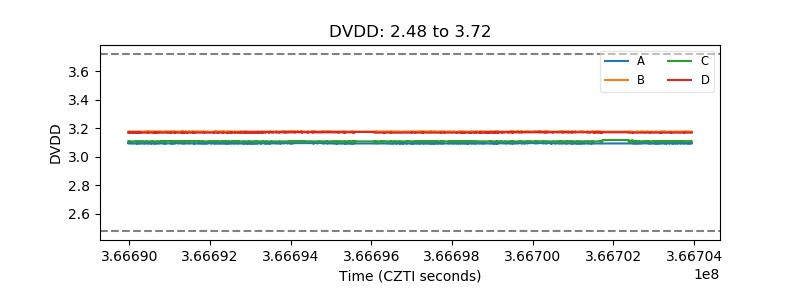 |
| Temperature 1 | 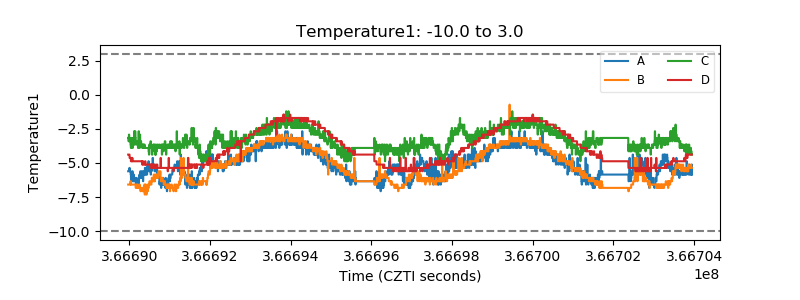 |
| Veto HV Monitor | 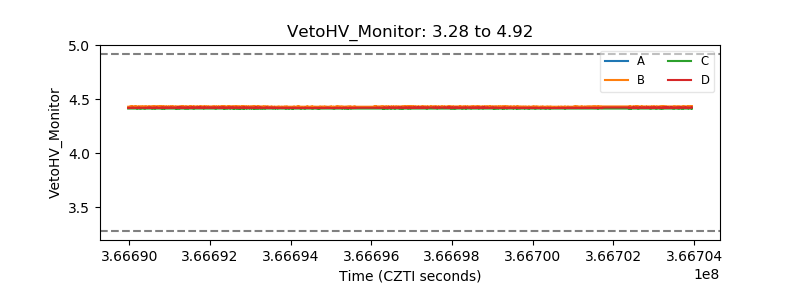 |
| Veto LLD | 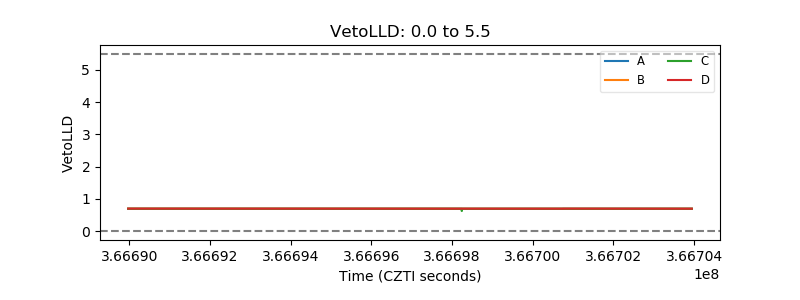 |
| Alpha Counter | 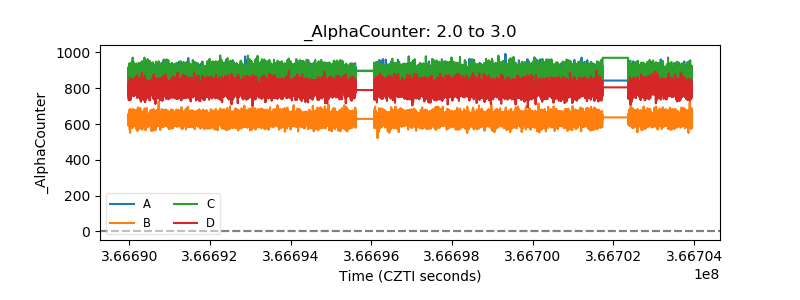 |
| _CPM_Rate | 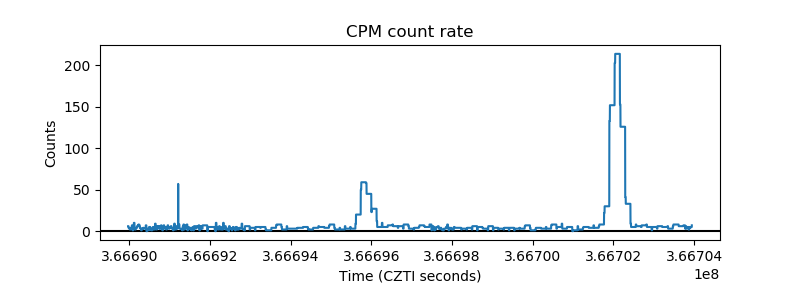 |
| CZT Counter | 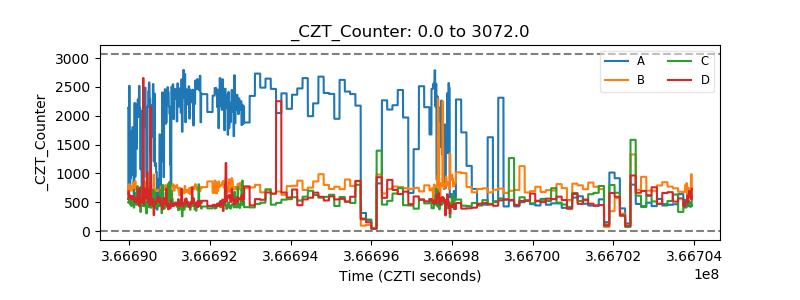 |
| +2.5 Volts monitor | 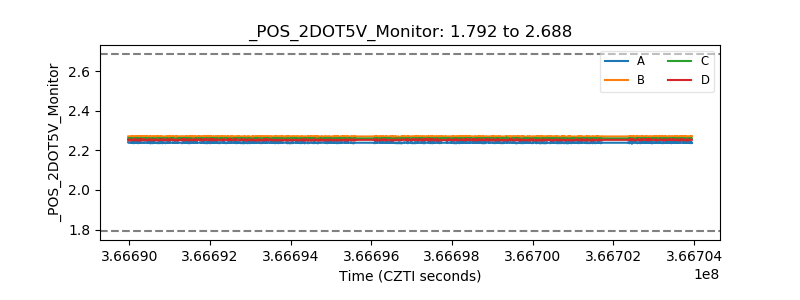 |
| +5 Volts monitor |  |
| _ROLL_ROT | 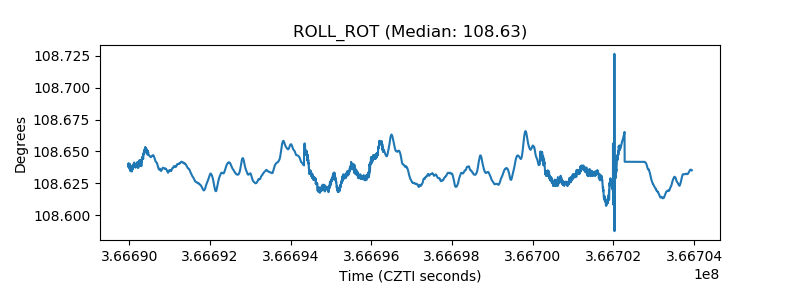 |
| _Roll_DEC | 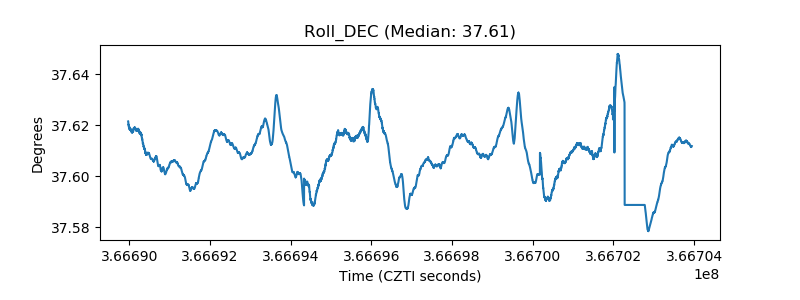 |
| _Roll_RA | 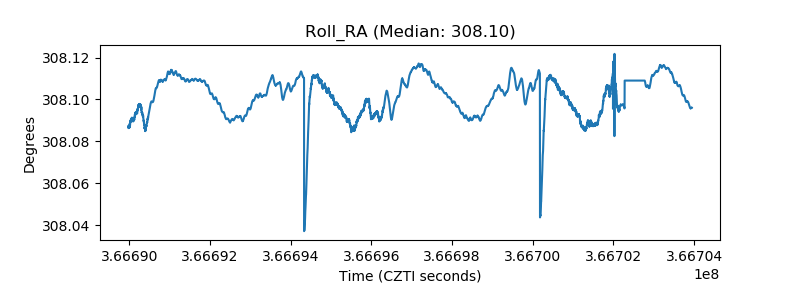 |
| Veto Counter | 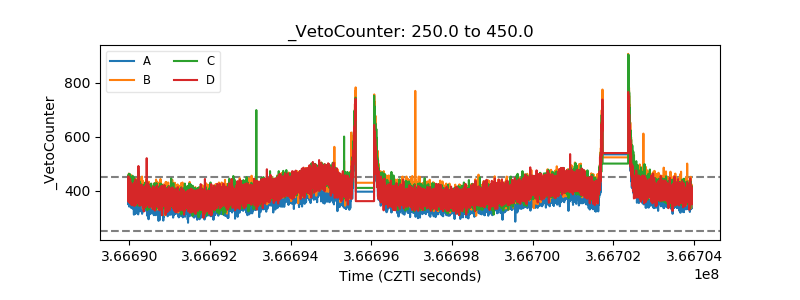 |