| Param | Original file | Final file |
|---|---|---|
| Filename | modeM0/AS1T04_041T01_9000004642_31796cztM0_level2.evt | modeM0/AS1T04_041T01_9000004642_31796cztM0_level2_quad_clean.evt |
| Size (bytes) | 614,226,240 | 74,658,240 |
| Size | 585.8 MB | 71.2 MB |
| Events in quadrant A | 4,448,862 | 458,988 |
| Events in quadrant B | 5,331,411 | 455,490 |
| Events in quadrant C | 4,187,207 | 431,412 |
| Events in quadrant D | 4,162,066 | 428,493 |
| Mode M9 | |||
|---|---|---|---|
| Quadrant | BADHDUFLAG | Total packets | Discarded packets |
| A | 0 | 11 | 0 |
| B | 0 | 12 | 0 |
| C | 0 | 12 | 0 |
| D | 0 | 12 | 0 |
| Mode M0 | |||
|---|---|---|---|
| Quadrant | BADHDUFLAG | Total packets | Discarded packets |
| A | 0 | 17717 | 2 |
| B | 0 | 21268 | 2 |
| C | 0 | 16720 | 2 |
| D | 0 | 16751 | 2 |
| Mode SS | |||
|---|---|---|---|
| Quadrant | BADHDUFLAG | Total packets | Discarded packets |
| A | 0 | 142 | 0 |
| B | 0 | 142 | 0 |
| C | 0 | 142 | 0 |
| D | 0 | 142 | 0 |
| Quadrant | Total seconds | Saturated seconds | Saturation percentage |
|---|---|---|---|
| A | 6976 | 419 | 6.006307% |
| B | 6976 | 177 | 2.537271% |
| C | 6976 | 340 | 4.873853% |
| D | 6976 | 151 | 2.164564% |
Noise dominated data is calculated using 1-second bins in cleaned event files. If a bin has >2000 counts, and if more than 50% of those come from <1% of pixels, then it is considered to be noise-dominated and hence unusable.
| Quadrant | # 1 sec bins | Bins with >0 counts | Bins with >2000 counts | High rate bins dominated by noise | Noise dominated (total time) | Noise dominated (detector-on time) | Marked lightcurve |
|---|---|---|---|---|---|---|---|
| A | 7821 | 6977 | 211 | 211 | 2.70% | 3.02% | 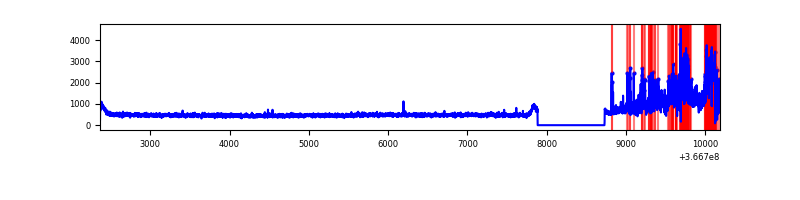 |
| B | 7821 | 6977 | 7 | 7 | 0.09% | 0.10% | 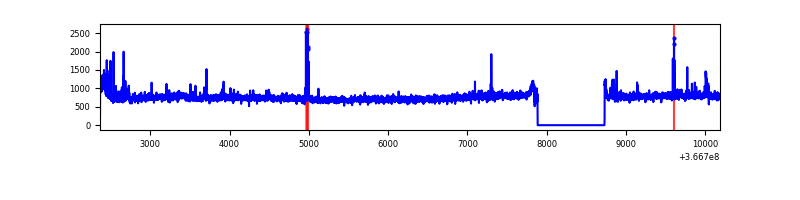 |
| C | 7821 | 6977 | 60 | 60 | 0.77% | 0.86% | 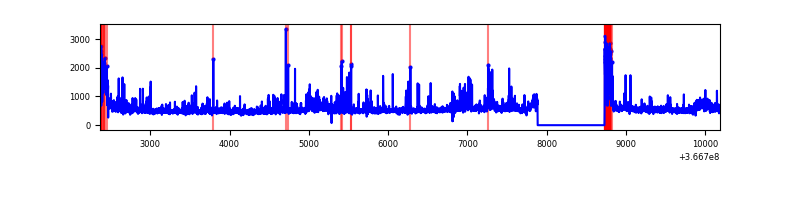 |
| D | 7821 | 6977 | 72 | 72 | 0.92% | 1.03% | 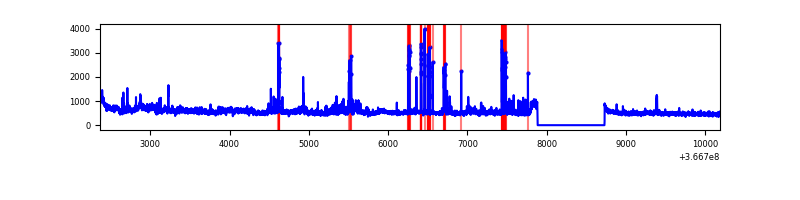 |
Top three noisy pixels from each quadrant. If the there are fewer than three noisy pixels in the level2.evt file, extra rows are filled as -1
| Pixel properties | Quadrant properties | ||||||
|---|---|---|---|---|---|---|---|
| Quadrant | DetID | PixID | Counts | Sigma | Mean | Median | Sigma |
| A | 0 | 13 | 1150328 | 6675.3 | 853 | 837 | 172.2 |
| A | 13 | 254 | 12148 | 65.69 | 853 | 837 | 172.2 |
| A | 3 | 137 | 9081 | 47.87 | 853 | 837 | 172.2 |
| B | 6 | 159 | 1817122 | 10924.78 | 856 | 834 | 166.3 |
| B | 10 | 245 | 116604 | 696.34 | 856 | 834 | 166.3 |
| B | 12 | 111 | 21227 | 122.66 | 856 | 834 | 166.3 |
| C | 0 | 10 | 639581 | 3290.77 | 815 | 820 | 194.1 |
| C | 14 | 238 | 160861 | 824.5 | 815 | 820 | 194.1 |
| C | 3 | 233 | 137446 | 703.87 | 815 | 820 | 194.1 |
| D | 8 | 195 | 569223 | 2788.19 | 836 | 811 | 203.9 |
| D | 1 | 52 | 169276 | 826.36 | 836 | 811 | 203.9 |
| D | 2 | 250 | 121519 | 592.1 | 836 | 811 | 203.9 |
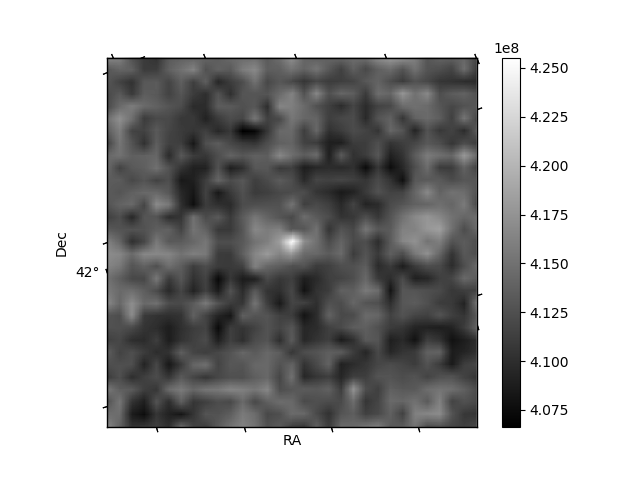
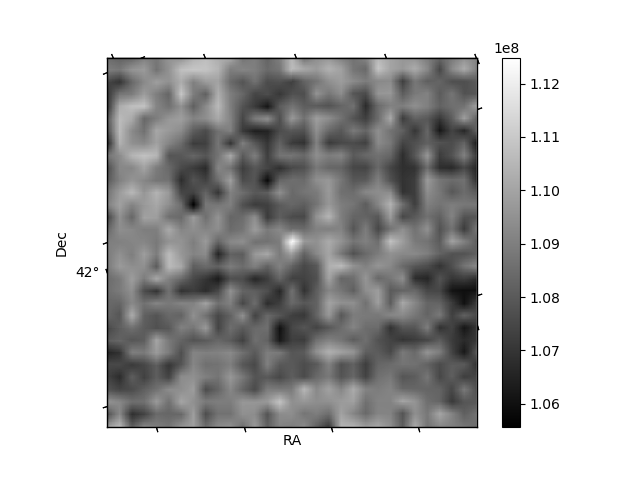
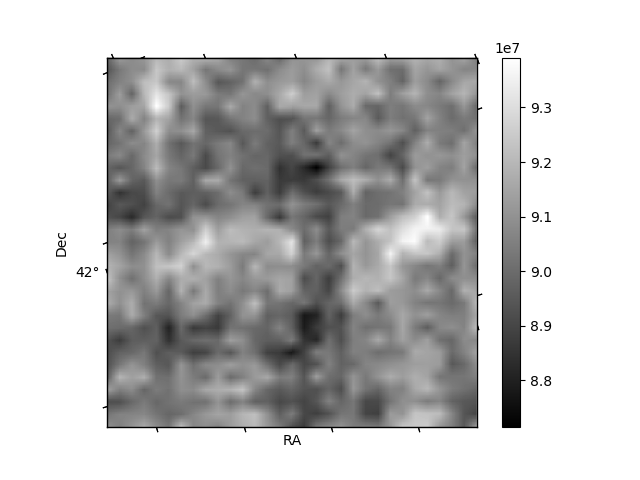
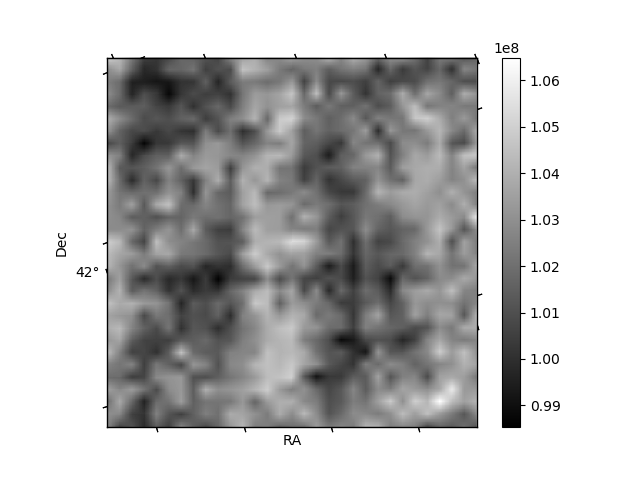
Histogram calculated using DETX and DETY for each event in the final _common_clean file
| Quadrant A | 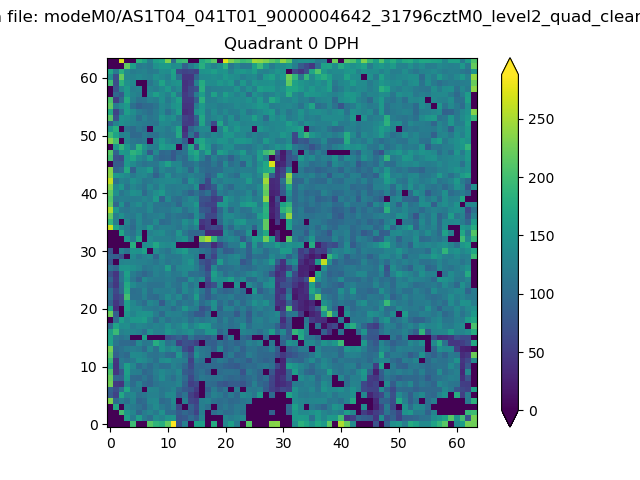 |
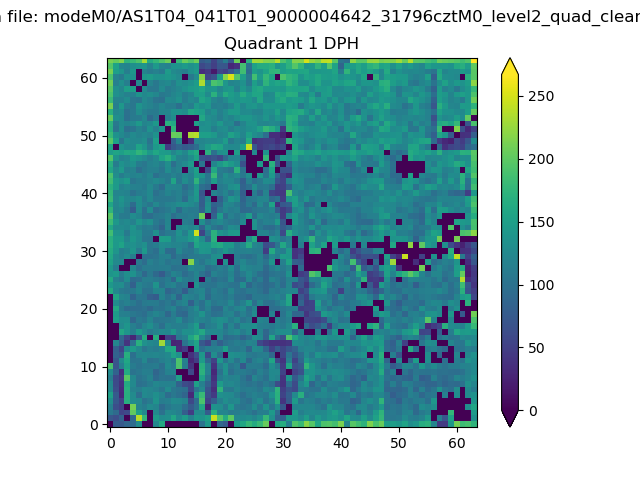 |
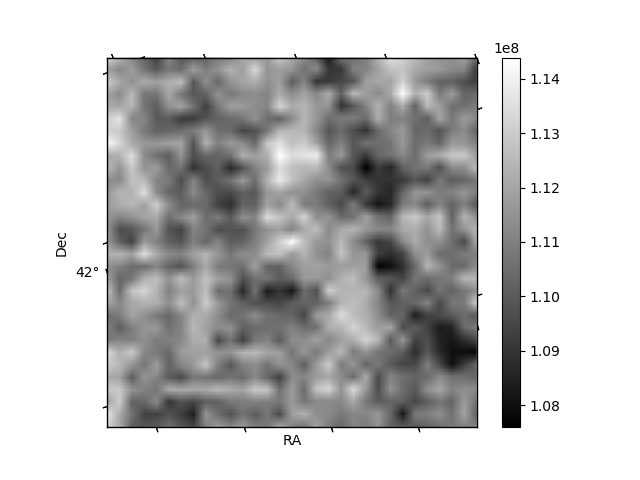
Quadrant B |
|---|---|---|---|
| Quadrant D | 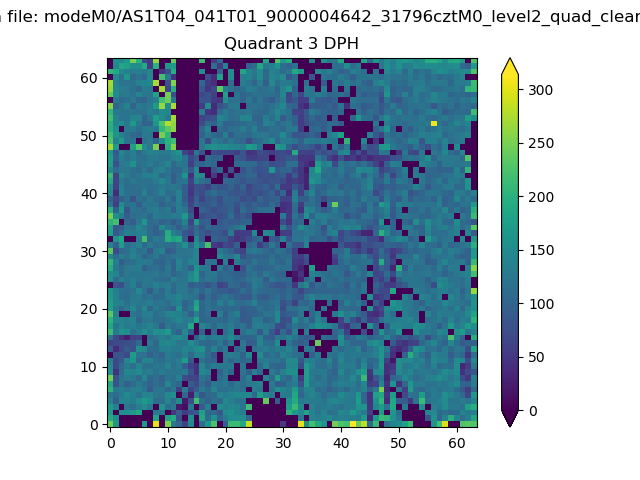 |
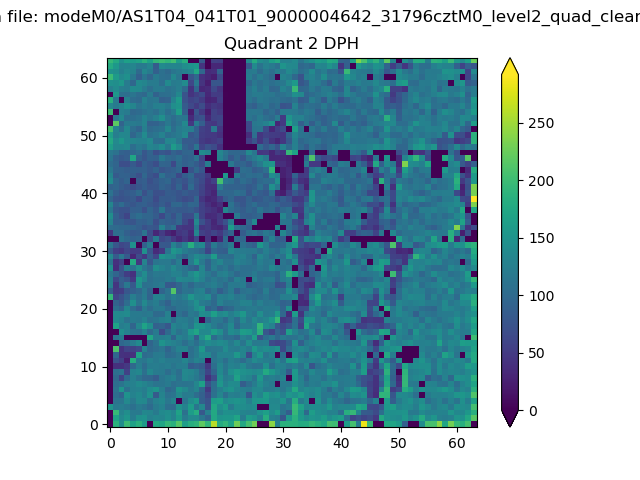 |
Quadrant C |
| Plot type | Count rate plots | Images |
|---|---|---|
| Comparison with Poisson distribution Blue bars denote a histogram of data divided into 1 sec bins. Red curve is a Poisson curve with rate = median count rate of data. |
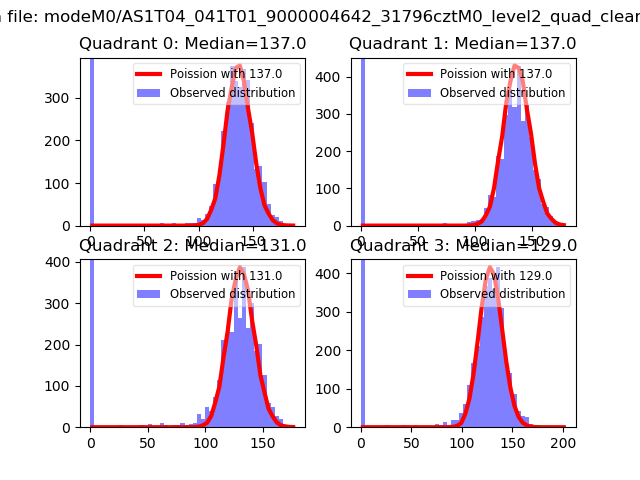 |
 |
| Quadrant-wise count rates Data is divided into 100 sec bins |
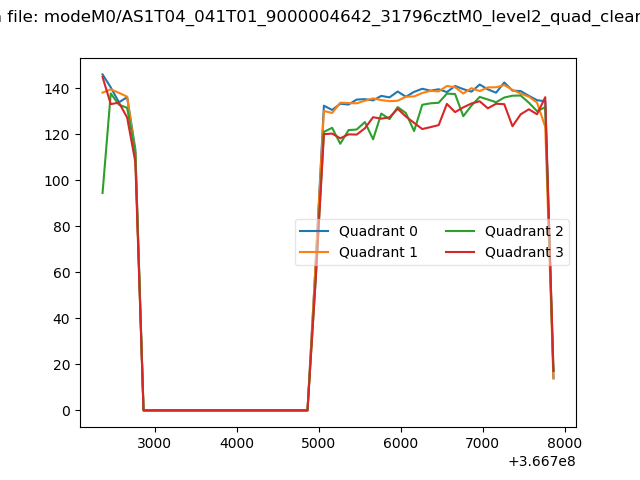 |
|
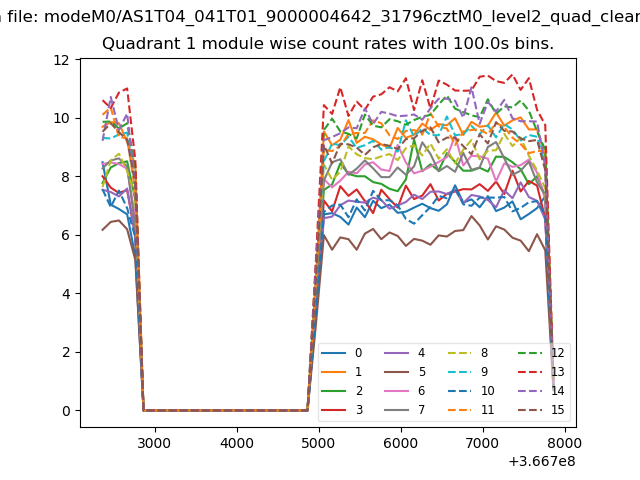
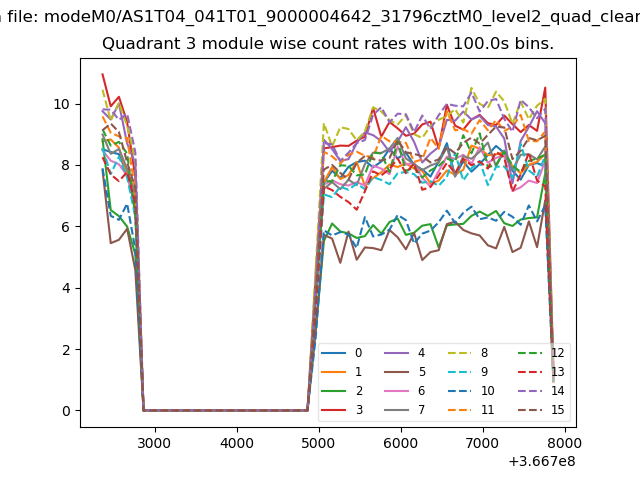
| Module-wise count rates for Quadrant A Data is divided into 100 sec bins |
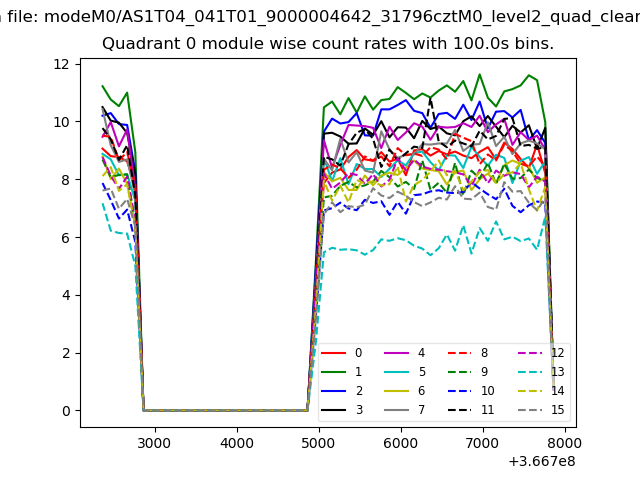 |
 |
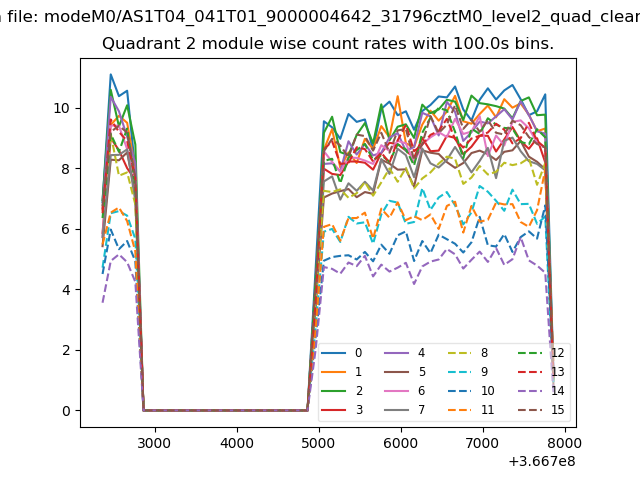
| Module-wise count rates for Quadrant B Data is divided into 100 sec bins |
 |
 |
| Module-wise count rates for Quadrant C Data is divided into 100 sec bins |
 |
 |
| Module-wise count rates for Quadrant D Data is divided into 100 sec bins |
 |
 |
| Parameter | Plot |
|---|---|
| CZT HV Monitor | 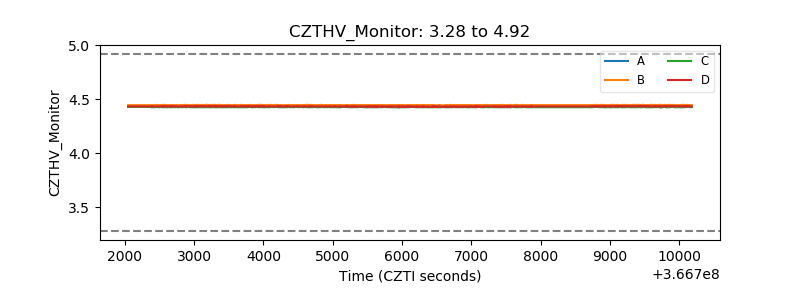 |
| D_VDD | 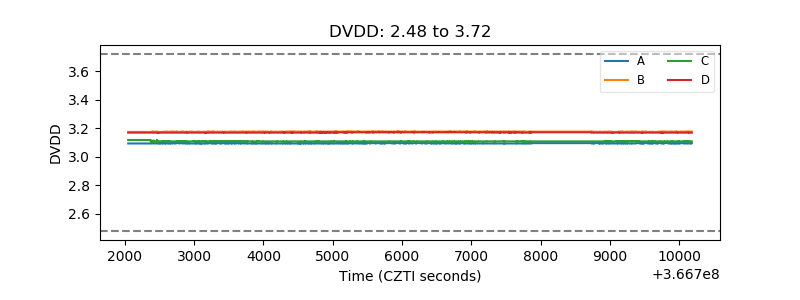 |
| Temperature 1 | 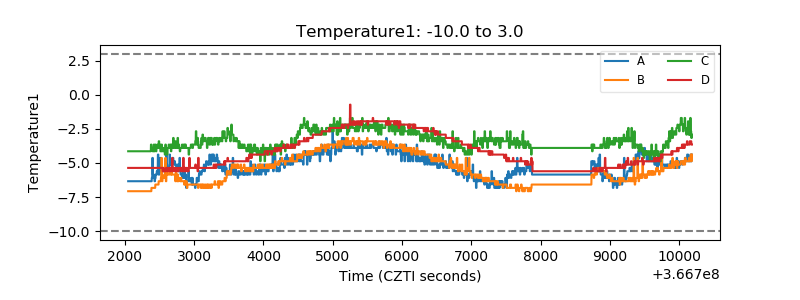 |
| Veto HV Monitor | 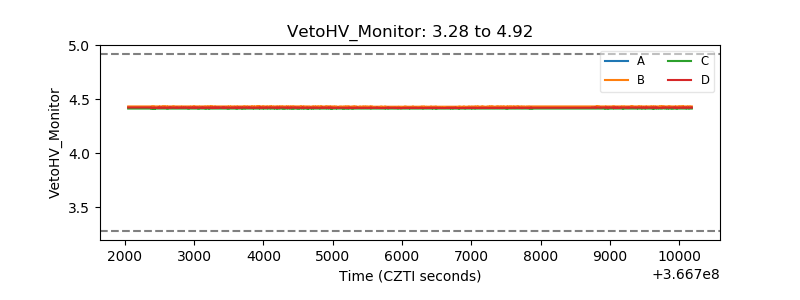 |
| Veto LLD | 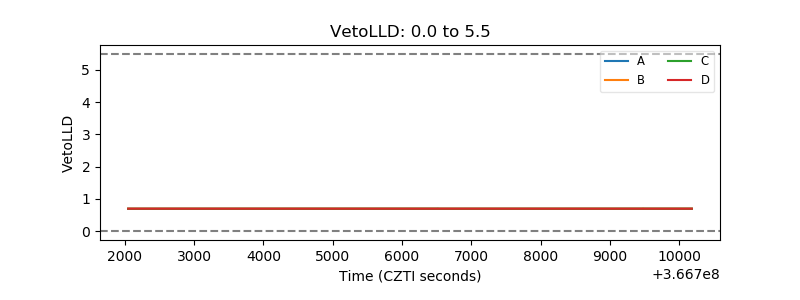 |
| Alpha Counter | 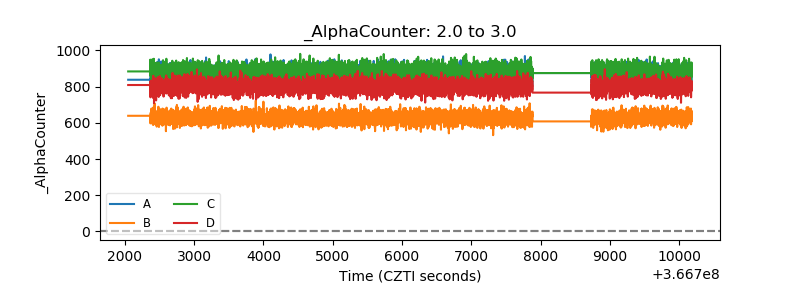 |
| _CPM_Rate | 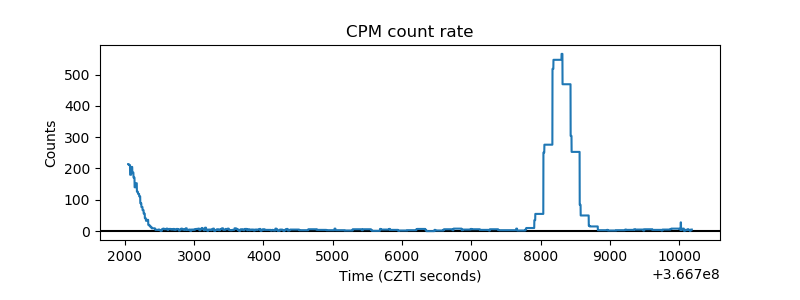 |
| CZT Counter | 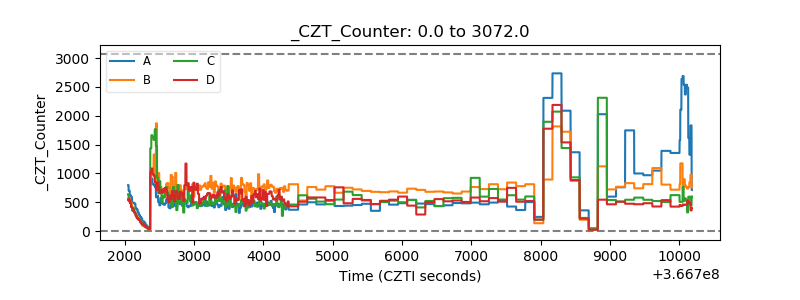 |
| +2.5 Volts monitor |  |
| +5 Volts monitor |  |
| _ROLL_ROT | 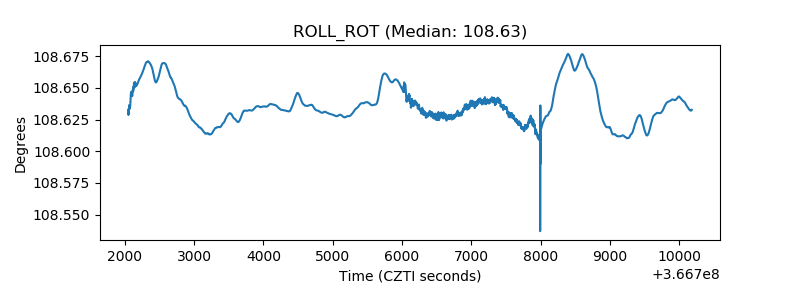 |
| _Roll_DEC | 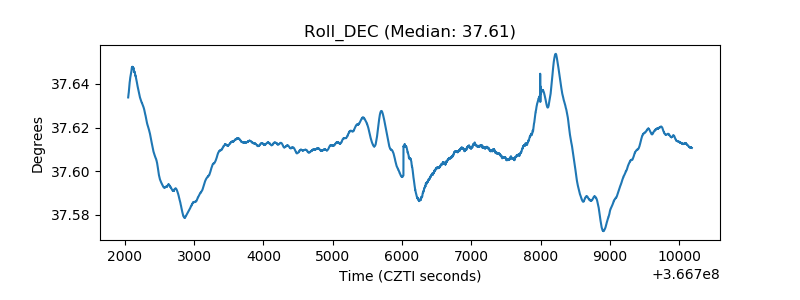 |
| _Roll_RA | 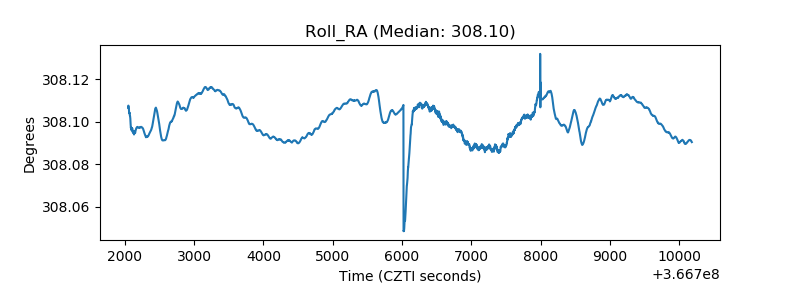 |
| Veto Counter | 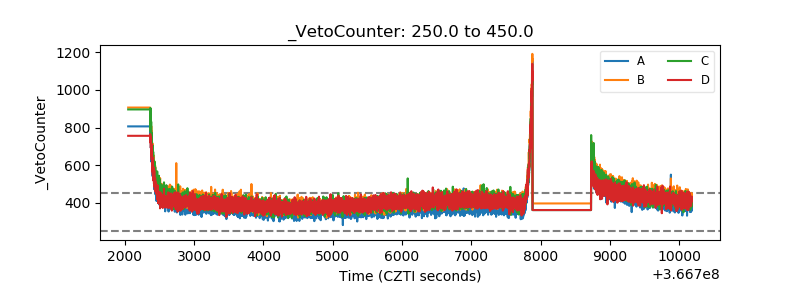 |