| Param | Original file | Final file |
|---|---|---|
| Filename | modeM0/AS1T04_041T01_9000004642_31800cztM0_level2.evt | modeM0/AS1T04_041T01_9000004642_31800cztM0_level2_quad_clean.evt |
| Size (bytes) | 940,291,200 | 88,447,680 |
| Size | 896.7 MB | 84.4 MB |
| Events in quadrant A | 13,652,866 | 321,899 |
| Events in quadrant B | 5,341,019 | 659,245 |
| Events in quadrant C | 4,352,124 | 629,073 |
| Events in quadrant D | 4,693,453 | 614,537 |
| Mode M9 | |||
|---|---|---|---|
| Quadrant | BADHDUFLAG | Total packets | Discarded packets |
| A | 0 | 23 | 0 |
| B | 0 | 23 | 0 |
| C | 0 | 23 | 0 |
| D | 0 | 23 | 0 |
| Mode M0 | |||
|---|---|---|---|
| Quadrant | BADHDUFLAG | Total packets | Discarded packets |
| A | 0 | 44997 | 2 |
| B | 0 | 20432 | 2 |
| C | 0 | 17337 | 2 |
| D | 0 | 18462 | 2 |
| Mode SS | |||
|---|---|---|---|
| Quadrant | BADHDUFLAG | Total packets | Discarded packets |
| A | 0 | 136 | 0 |
| B | 0 | 136 | 0 |
| C | 0 | 136 | 0 |
| D | 0 | 136 | 0 |
| Quadrant | Total seconds | Saturated seconds | Saturation percentage |
|---|---|---|---|
| A | 6471 | 5640 | 87.158090% |
| B | 6471 | 219 | 3.384330% |
| C | 6472 | 350 | 5.407911% |
| D | 6472 | 145 | 2.240420% |
Noise dominated data is calculated using 1-second bins in cleaned event files. If a bin has >2000 counts, and if more than 50% of those come from <1% of pixels, then it is considered to be noise-dominated and hence unusable.
| Quadrant | # 1 sec bins | Bins with >0 counts | Bins with >2000 counts | High rate bins dominated by noise | Noise dominated (total time) | Noise dominated (detector-on time) | Marked lightcurve |
|---|---|---|---|---|---|---|---|
| A | 8826 | 6473 | 3688 | 3688 | 41.79% | 56.98% | 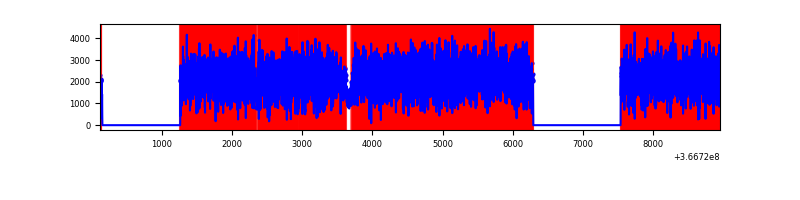 |
| B | 8826 | 6473 | 13 | 13 | 0.15% | 0.20% | 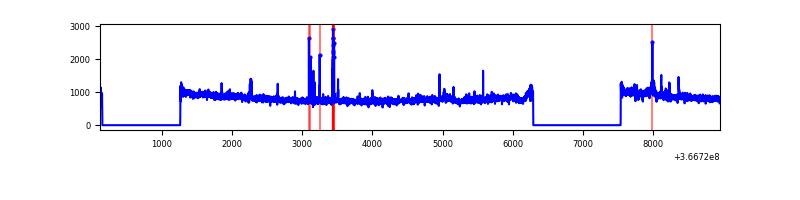 |
| C | 8827 | 6474 | 106 | 106 | 1.20% | 1.64% | 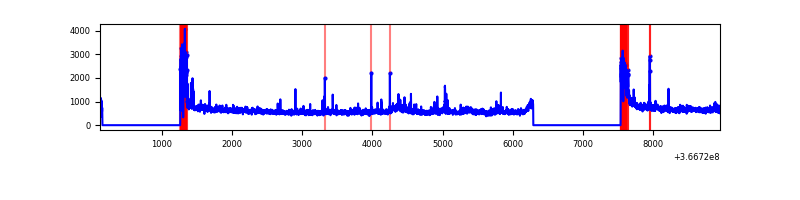 |
| D | 8827 | 6474 | 17 | 17 | 0.19% | 0.26% | 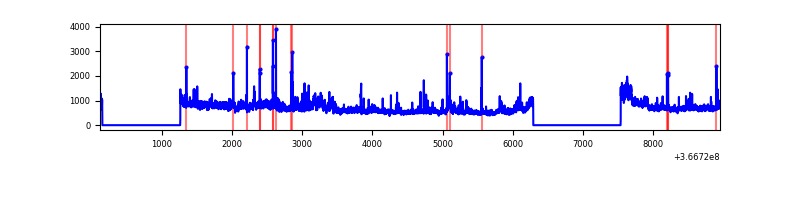 |
Top three noisy pixels from each quadrant. If the there are fewer than three noisy pixels in the level2.evt file, extra rows are filled as -1
| Pixel properties | Quadrant properties | ||||||
|---|---|---|---|---|---|---|---|
| Quadrant | DetID | PixID | Counts | Sigma | Mean | Median | Sigma |
| A | 0 | 13 | 11704331 | 118151.01 | 503 | 496 | 99.1 |
| A | 13 | 6 | 7813 | 73.87 | 503 | 496 | 99.1 |
| A | 13 | 254 | 6144 | 57.02 | 503 | 496 | 99.1 |
| B | 6 | 159 | 1646377 | 9614.24 | 910 | 891 | 171.2 |
| B | 10 | 245 | 81880 | 473.2 | 910 | 891 | 171.2 |
| B | 0 | 190 | 22773 | 127.85 | 910 | 891 | 171.2 |
| C | 0 | 10 | 461412 | 2300.97 | 868 | 879 | 200.1 |
| C | 3 | 233 | 319862 | 1593.74 | 868 | 879 | 200.1 |
| C | 14 | 238 | 145846 | 724.3 | 868 | 879 | 200.1 |
| D | 8 | 195 | 826700 | 3854.41 | 904 | 884 | 214.3 |
| D | 12 | 227 | 295440 | 1374.81 | 904 | 884 | 214.3 |
| D | 2 | 250 | 65152 | 299.96 | 904 | 884 | 214.3 |
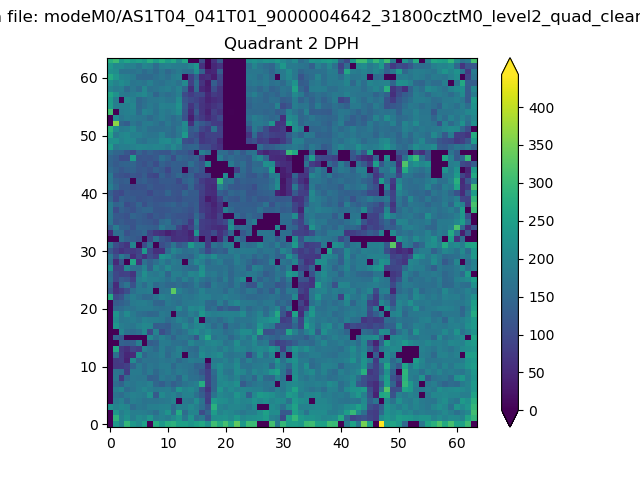
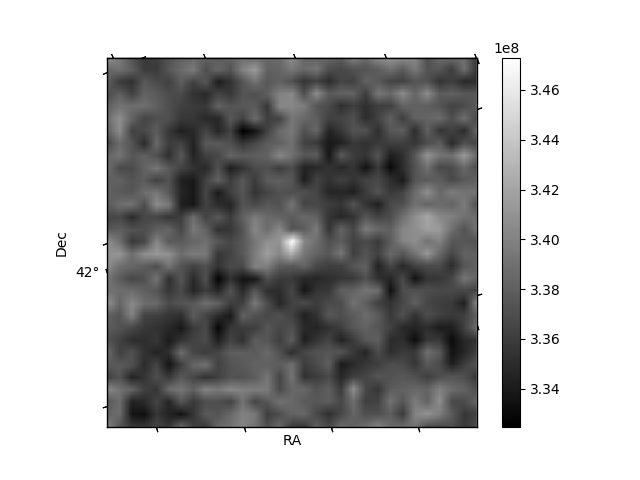
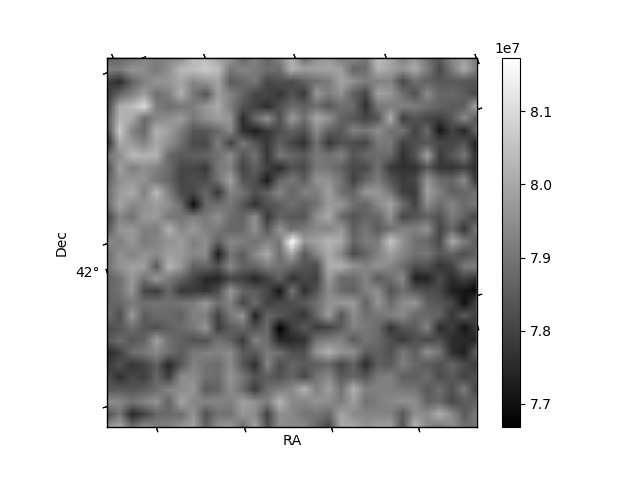
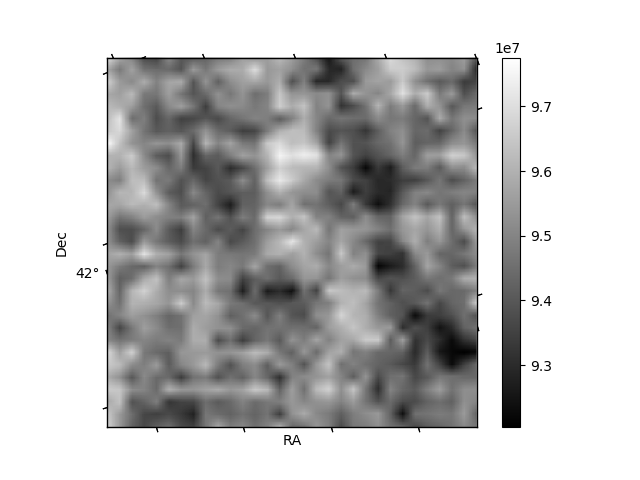
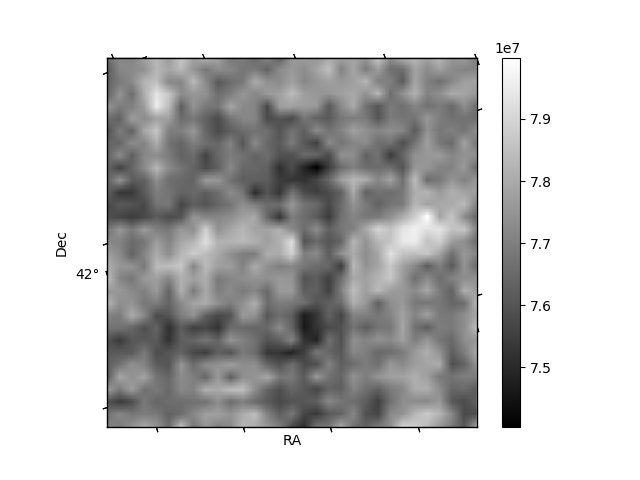
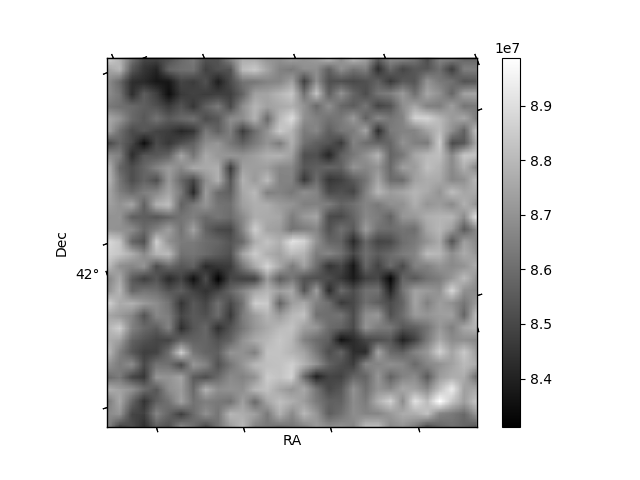
Histogram calculated using DETX and DETY for each event in the final _common_clean file
| Quadrant A | 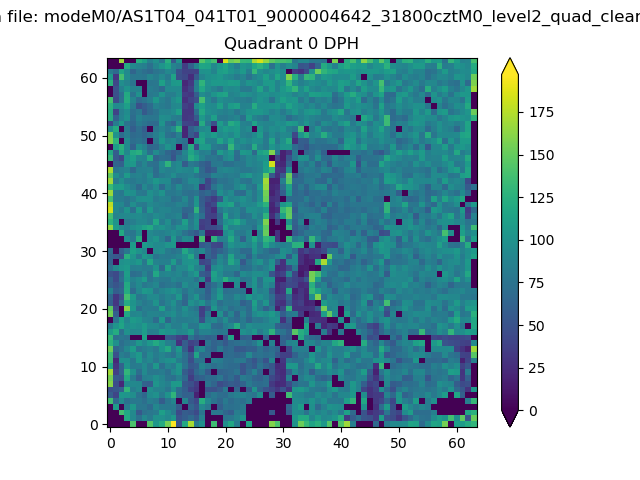 |
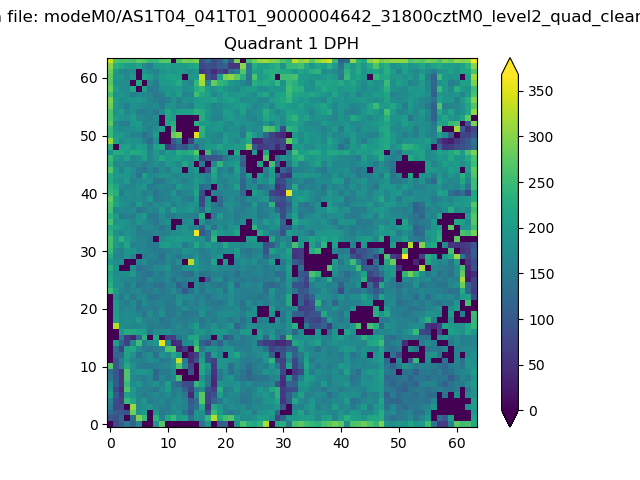 |
Quadrant B |
|---|---|---|---|
| Quadrant D | 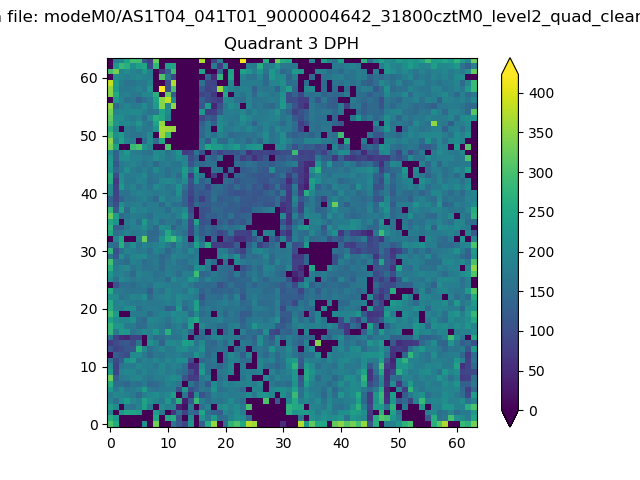 |
 |
Quadrant C |
| Plot type | Count rate plots | Images |
|---|---|---|
| Comparison with Poisson distribution Blue bars denote a histogram of data divided into 1 sec bins. Red curve is a Poisson curve with rate = median count rate of data. |
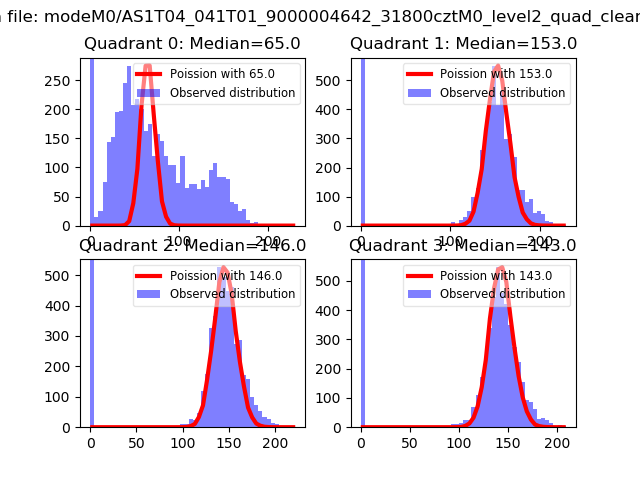 |
 |
| Quadrant-wise count rates Data is divided into 100 sec bins |
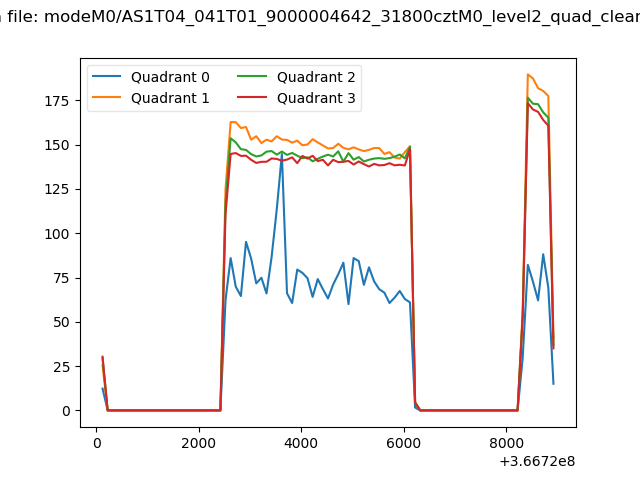 |
|
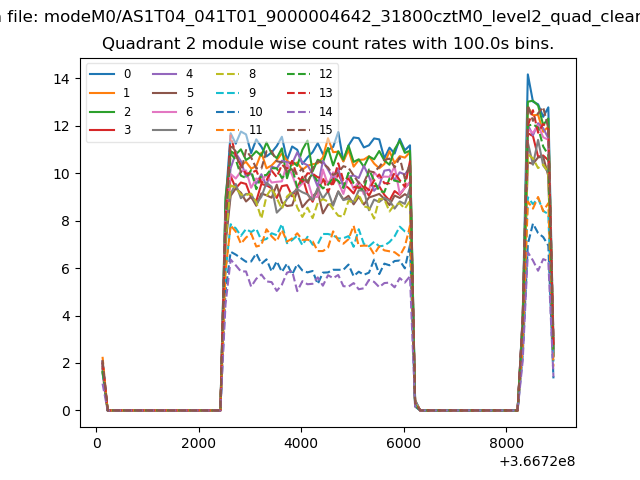
| Module-wise count rates for Quadrant A Data is divided into 100 sec bins |
 |
 |
| Module-wise count rates for Quadrant B Data is divided into 100 sec bins |
 |
 |
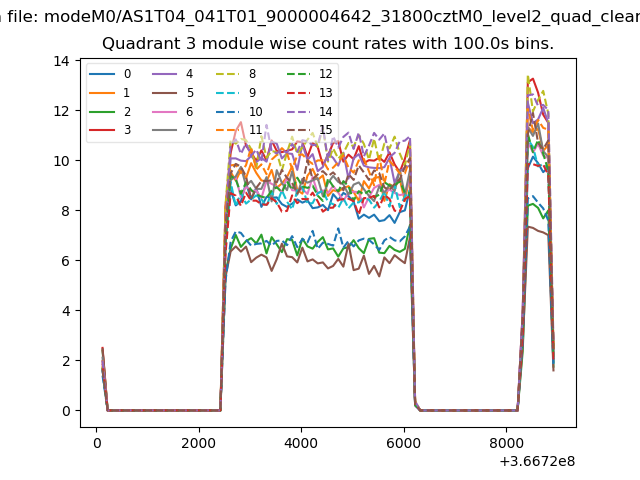
| Module-wise count rates for Quadrant C Data is divided into 100 sec bins |
 |
 |
| Module-wise count rates for Quadrant D Data is divided into 100 sec bins |
 |
 |
| Parameter | Plot |
|---|---|
| CZT HV Monitor | 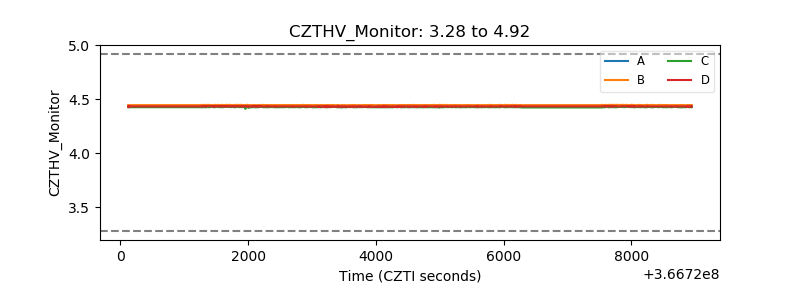 |
| D_VDD | 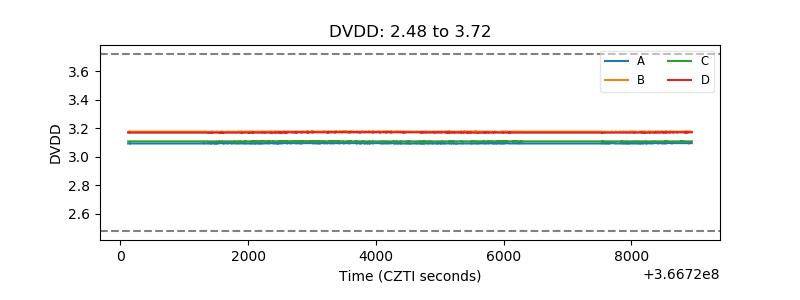 |
| Temperature 1 | 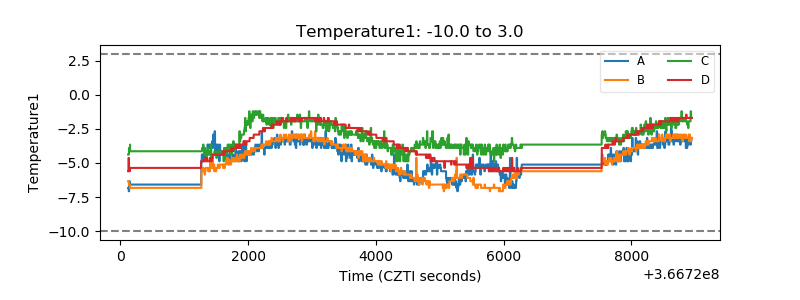 |
| Veto HV Monitor | 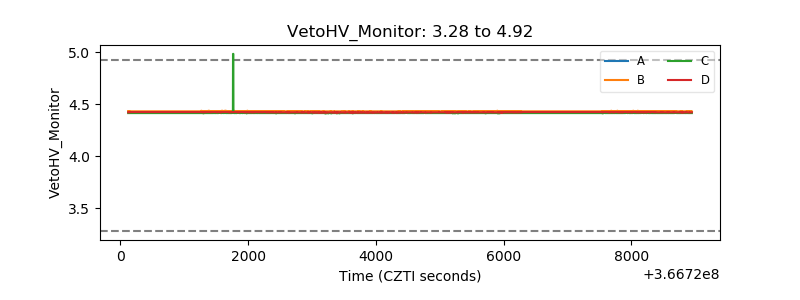 |
| Veto LLD |  |
| Alpha Counter | 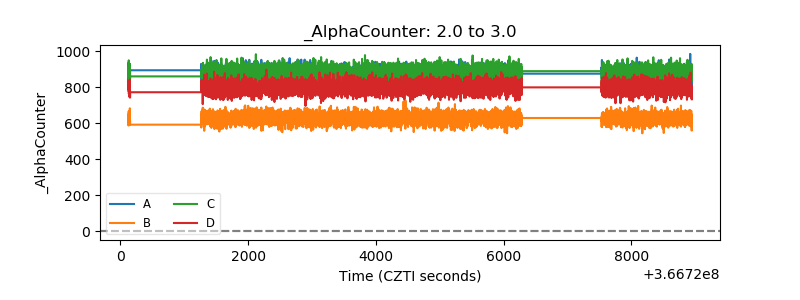 |
| _CPM_Rate | 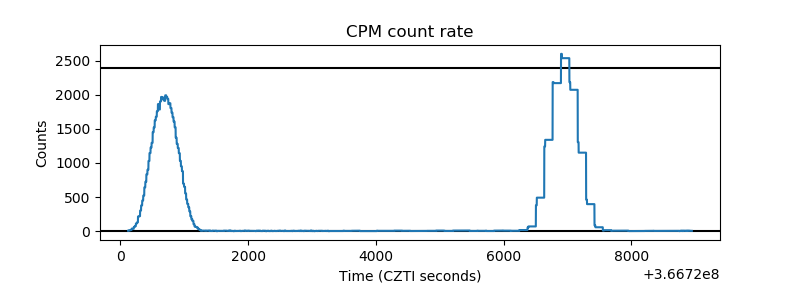 |
| CZT Counter | 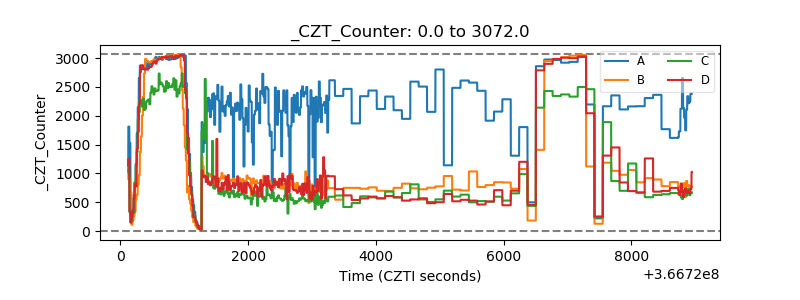 |
| +2.5 Volts monitor |  |
| +5 Volts monitor |  |
| _ROLL_ROT | 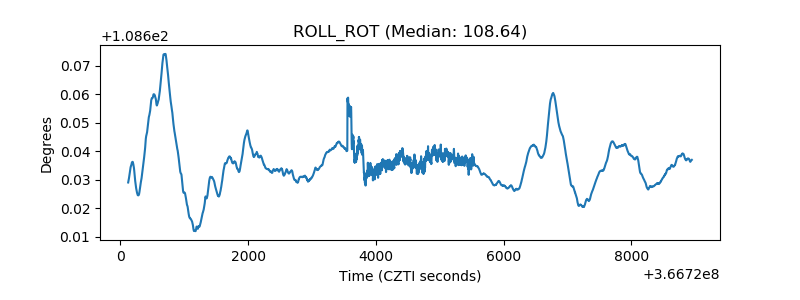 |
| _Roll_DEC | 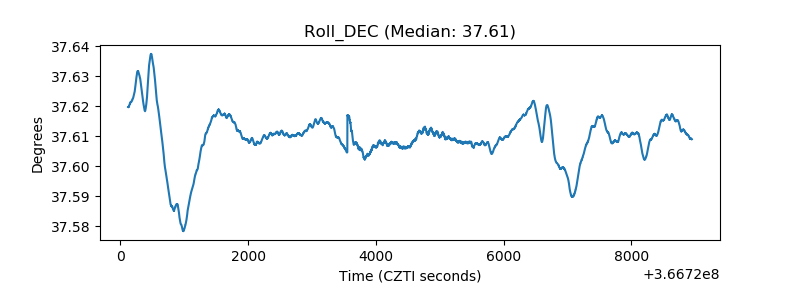 |
| _Roll_RA | 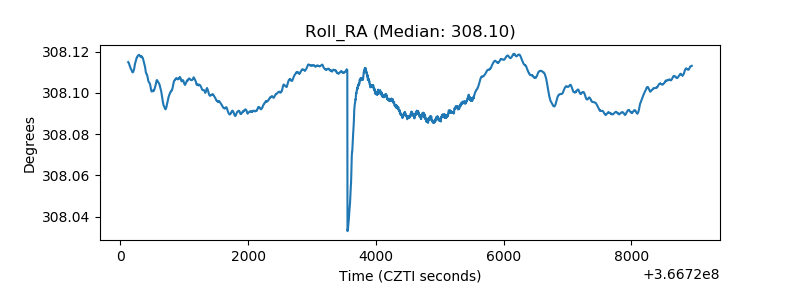 |
| Veto Counter | 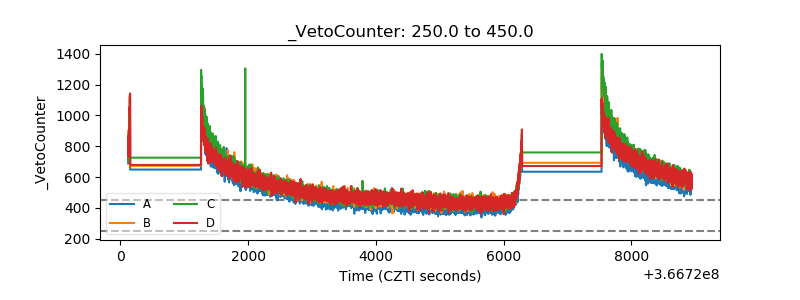 |